The median household income in Onley, VA in 2022 was $46,119, which was 86.2% less than the median annual income of $85,873 across the entire state of Virginia. Compared to the median income of $36,750 in 2000 this represents an increase of 20.3%. The per capita income in 2022 was $35,767, which means an increase of 46.6% compared to 2000 when it was $19,115.
Whole page based on the data from 2000 / 2022 when the population of Onley, Virginia was 496 / 660
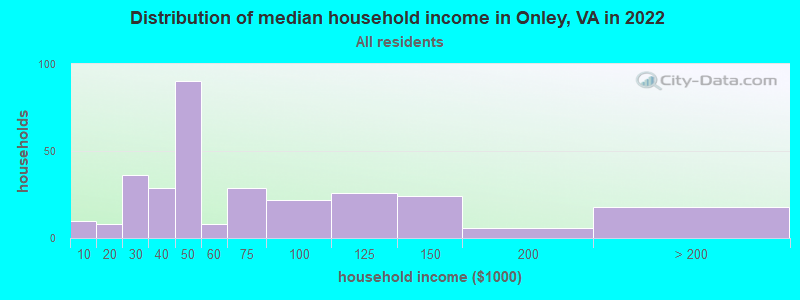
Income statistics for all residents
Median household income in Onley, VA in 2022:
Onley:
$46,120
Virginia:
$85,873
Change in median household income between 2000 and 2022:
Onley, Virginia:
+25.5%
State:
+84.0%
Number of households with income < $10k:
Onley:
3.3% (10)
State:
4.9% (165,315)
Number of households with income $10k - 20k:
Onley:
2.6% (8)
State:
5.9% (199,380)
Number of households with income $20k - 30k:
Onley:
11.8% (36)
State:
6.0% (202,243)
Number of households with income $30k - 40k:
Onley:
9.5% (29)
State:
6.1% (205,967)
Number of households with income $40k - 50k:
Onley:
29.4% (90)
State:
6.4% (215,648)
Number of households with income $50k - 60k:
Onley:
2.6% (8)
Virginia:
6.2% (210,516)
Number of households with income $60k - 75k:
Onley:
9.5% (29)
State:
8.6% (292,112)
Number of households with income $75k - 100k:
Onley:
7.2% (22)
Virginia:
12.2% (412,198)
Number of households with income $100k - 125k:
Onley:
8.5% (26)
State:
10.3% (348,998)
Number of households with income $125k - 150k:
Onley:
7.8% (24)
State:
7.7% (261,236)
Number of households with income $150k - 200k:
Onley:
2.0% (6)
Virginia:
10.3% (347,282)
Number of households with income > $200k:
Onley:
5.9% (18)
Virginia:
15.4% (519,712)
Aggregate household income in Onley in 2022: $22,199,269
Median non-family income in Onley in 2022:
Onley:
$39,634
State:
$51,436
Change in median non-family income between 2000 and 2022:
Onley, Virginia:
+57.2%
State:
+73.5%
Median per capita income in Onley in 2022:
Onley:
$35,768
Virginia:
$47,199
Change in median per capita income between 2000 and 2022:
Onley, Virginia:
+87.1%
State:
+96.9%
Income statistics for White residents
Median household income in Onley, VA in 2022:
Onley:
$45,781
Virginia:
$91,924
Change in median household income between 2000 and 2022:
Onley, Virginia:
+14.5%
State:
+81.9%
Number of households with income < $10k:
Onley:
0.7% (2)
State:
4.1% (90,549)
Number of households with income $10k - 20k:
Onley:
2.6% (7)
State:
5.2% (114,324)
Number of households with income $20k - 30k:
Onley:
12.8% (35)
State:
5.7% (125,676)
Number of households with income $30k - 40k:
Onley:
10.3% (28)
Virginia:
5.5% (121,220)
Number of households with income $40k - 50k:
Onley:
33.0% (90)
Virginia:
6.0% (133,011)
Number of households with income $50k - 60k:
Onley:
2.9% (8)
State:
6.2% (136,856)
Number of households with income $60k - 75k:
Onley:
8.4% (23)
Virginia:
8.4% (186,094)
Number of households with income $75k - 100k:
Onley:
8.1% (22)
State:
12.5% (277,077)
Number of households with income $100k - 125k:
Onley:
5.9% (16)
State:
10.8% (237,562)
Number of households with income $125k - 150k:
Onley:
8.4% (23)
State:
8.0% (177,532)
Number of households with income $150k - 200k:
Onley:
0.7% (2)
Virginia:
11.0% (242,106)
Number of households with income > $200k:
Onley:
6.2% (17)
State:
16.6% (366,064)
Aggregate household income in Onley in 2022: $19,164,049
Median non-family income in Onley in 2022:
Onley:
$33,311
Virginia:
$53,785
Change in median non-family income between 2000 and 2022:
Onley, Virginia:
+32.1%
State:
+70.5%
Median per capita income in Onley in 2022:
Onley:
$40,104
Virginia:
$53,456
Change in median per capita income between 2000 and 2022:
Onley, Virginia:
+93.9%
Virginia:
+99.2%
Income statistics for Black or African American residents
Aggregate household income in Onley in 2022: $2,220,050
Median per capita income in Onley in 2022:
Onley:
$24,593
State:
$34,599
Income statistics for Hispanic or Latino residents
Number of households with income < $10k:
Onley:
28.6% (8)
State:
4.6% (11,664)
Number of households with income $10k - 20k:
Onley:
0.0% (0)
State:
4.9% (12,443)
Number of households with income $20k - 30k:
Onley:
0.0% (0)
State:
5.9% (14,859)
Number of households with income $30k - 40k:
Onley:
0.0% (0)
State:
6.8% (17,059)
Number of households with income $40k - 50k:
Onley:
39.3% (11)
Virginia:
6.4% (16,261)
Number of households with income $50k - 60k:
Onley:
0.0% (0)
State:
6.9% (17,468)
Number of households with income $60k - 75k:
Onley:
0.0% (0)
Virginia:
9.6% (24,193)
Number of households with income $75k - 100k:
Onley:
0.0% (0)
Virginia:
13.2% (33,405)
Number of households with income $100k - 125k:
Onley:
32.1% (9)
State:
10.5% (26,356)
Number of households with income $125k - 150k:
Onley:
0.0% (0)
State:
8.1% (20,494)
Number of households with income $150k - 200k:
Onley:
0.0% (0)
Virginia:
9.5% (23,943)
Number of households with income > $200k:
Onley:
0.0% (0)
State:
13.5% (33,987)
Aggregate household income in Onley in 2022: $1,498,318
Median per capita income in Onley in 2022:
Onley:
$16,770
Virginia:
$32,277
Change in median per capita income between 2000 and 2022:: -16.3%
Onley, Virginia:
-16.3%
State:
+104.6%
Income statistics for Multirace residents
Number of households with income < $10k:
Onley:
40.0% (8)
Virginia:
4.1% (9,125)
Number of households with income $10k - 20k:
Onley:
0.0% (0)
State:
5.9% (12,969)
Number of households with income $20k - 30k:
Onley:
0.0% (0)
Virginia:
4.8% (10,563)
Number of households with income $30k - 40k:
Onley:
0.0% (0)
Virginia:
6.6% (14,553)
Number of households with income $40k - 50k:
Onley:
0.0% (0)
State:
5.2% (11,391)
Number of households with income $50k - 60k:
Onley:
0.0% (0)
State:
6.8% (14,994)
Number of households with income $60k - 75k:
Onley:
0.0% (0)
State:
8.8% (19,323)
Number of households with income $75k - 100k:
Onley:
0.0% (0)
State:
12.1% (26,729)
Number of households with income $100k - 125k:
Onley:
60.0% (12)
Virginia:
10.4% (22,807)
Number of households with income $125k - 150k:
Onley:
0.0% (0)
State:
8.1% (17,881)
Number of households with income $150k - 200k:
Onley:
0.0% (0)
State:
10.4% (22,979)
Number of households with income > $200k:
Onley:
0.0% (0)
Virginia:
16.7% (36,748)
Median per capita income in Onley in 2022:
Onley:
$17,420
State:
$34,385
Discuss Onley, Virginia (VA) on our hugely popular Virginia forum.