The median household income in Orchard, TX in 2022 was $39,934, which was 81.0% less than the median annual income of $72,284 across the entire state of Texas. Compared to the median income of $47,000 in 2000 this represents a decrease of 17.7%. The per capita income in 2022 was $20,417, which means a decrease of 4.5% compared to 2000 when it was $21,329.
Whole page based on the data from 2000 / 2022 when the population of Orchard, Texas was 408 / 265
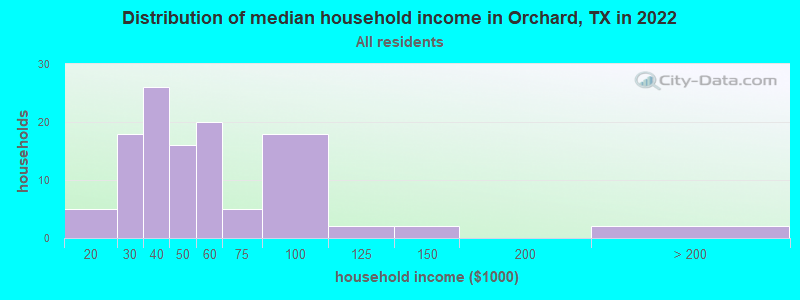
Income statistics for all residents
Median household income in Orchard, TX in 2022:
Orchard:
$39,935
State:
$72,284
Change in median household income between 2000 and 2022:: -15.0%
Orchard, Texas:
-15.0%
Texas:
+81.0%
Number of households with income < $10k:
Orchard:
0.0% (0)
State:
5.5% (611,011)
Number of households with income $10k - 20k:
Orchard:
4.4% (5)
State:
6.7% (743,157)
Number of households with income $20k - 30k:
Orchard:
15.8% (18)
State:
7.2% (803,381)
Number of households with income $30k - 40k:
Orchard:
22.8% (26)
State:
7.8% (866,080)
Number of households with income $40k - 50k:
Orchard:
14.0% (16)
State:
7.3% (810,440)
Number of households with income $50k - 60k:
Orchard:
17.5% (20)
State:
7.2% (799,783)
Number of households with income $60k - 75k:
Orchard:
4.4% (5)
State:
9.9% (1,095,384)
Number of households with income $75k - 100k:
Orchard:
15.8% (18)
State:
12.8% (1,419,057)
Number of households with income $100k - 125k:
Orchard:
1.8% (2)
Texas:
9.5% (1,054,577)
Number of households with income $125k - 150k:
Orchard:
1.8% (2)
Texas:
6.7% (741,518)
Number of households with income $150k - 200k:
Orchard:
0.0% (0)
Texas:
8.7% (961,776)
Number of households with income > $200k:
Orchard:
1.8% (2)
Texas:
10.7% (1,181,544)
Aggregate household income in Orchard in 2022: $5,711,779
Median family income in Orchard in 2022:
Orchard:
$49,863
State:
$86,267
Number of families with income $20k - 30k:
Orchard:
25.0% (20)
State:
5.8% (430,949)
Number of families with income $30k - 40k:
Orchard:
15.7% (12)
State:
6.6% (493,535)
Number of families with income $40k - 50k:
Orchard:
7.2% (6)
State:
6.7% (499,663)
Number of families with income $50k - 60k:
Orchard:
13.5% (11)
Texas:
6.6% (492,203)
Number of families with income $60k - 75k:
Orchard:
6.9% (5)
State:
9.5% (710,229)
Number of families with income $75k - 100k:
Orchard:
23.4% (18)
Texas:
13.6% (1,015,480)
Number of families with income $100k - 125k:
Orchard:
5.6% (4)
Texas:
10.7% (797,961)
Number of families with income > $200k:
Orchard:
2.7% (2)
State:
13.5% (1,013,514)
Median non-family income in Orchard in 2022:
Orchard:
$29,457
Texas:
$45,999
Change in median non-family income between 2000 and 2022:
Orchard, Texas:
+5.5%
State:
+79.5%
Median per capita income in Orchard in 2022:
Orchard:
$20,417
Texas:
$38,123
Change in median per capita income between 2000 and 2022:: -4.3%
Orchard, Texas:
-4.3%
State:
+94.3%
Income statistics for White residents
Median household income in Orchard, TX in 2022:
Orchard:
$45,225
State:
$82,032
Change in median household income between 2000 and 2022:: -9.5%
Orchard, Texas:
-9.5%
State:
+91.0%
Number of households with income < $10k:
Orchard:
0.0% (0)
State:
4.7% (273,716)
Number of households with income $10k - 20k:
Orchard:
4.5% (3)
State:
5.5% (322,702)
Number of households with income $20k - 30k:
Orchard:
21.2% (14)
State:
6.2% (363,947)
Number of households with income $30k - 40k:
Orchard:
15.2% (10)
State:
6.8% (399,275)
Number of households with income $40k - 50k:
Orchard:
13.6% (9)
Texas:
6.5% (383,417)
Number of households with income $50k - 60k:
Orchard:
18.2% (12)
Texas:
6.6% (388,535)
Number of households with income $60k - 75k:
Orchard:
7.6% (5)
Texas:
9.7% (566,295)
Number of households with income $75k - 100k:
Orchard:
13.6% (9)
Texas:
13.0% (760,276)
Number of households with income $100k - 125k:
Orchard:
0.0% (0)
Texas:
10.2% (597,596)
Number of households with income $125k - 150k:
Orchard:
3.0% (2)
State:
7.4% (436,830)
Number of households with income $150k - 200k:
Orchard:
0.0% (0)
Texas:
9.9% (583,067)
Number of households with income > $200k:
Orchard:
3.0% (2)
Texas:
13.5% (792,647)
Aggregate household income in Orchard in 2022: $3,304,003
Median family income in Orchard in 2022:
Orchard:
$46,976
State:
$101,788
Number of families with income $20k - 30k:
Orchard:
32.1% (15)
Texas:
4.1% (157,688)
Number of families with income $30k - 40k:
Orchard:
20.9% (10)
State:
5.2% (198,847)
Number of families with income $50k - 60k:
Orchard:
10.0% (5)
State:
5.7% (220,689)
Number of families with income $60k - 75k:
Orchard:
9.5% (4)
State:
9.0% (346,106)
Number of families with income $75k - 100k:
Orchard:
19.4% (9)
State:
13.7% (527,363)
Number of families with income $100k - 125k:
Orchard:
4.2% (2)
State:
11.6% (448,411)
Number of families with income > $200k:
Orchard:
3.9% (2)
Texas:
17.6% (677,490)
Median non-family income in Orchard in 2022:
Orchard:
$48,546
Texas:
$50,587
Change in median non-family income between 2000 and 2022:
Orchard, Texas:
+73.9%
Texas:
+87.7%
Median per capita income in Orchard in 2022:
Orchard:
$22,140
Texas:
$47,740
Change in median per capita income between 2000 and 2022:
Orchard, Texas:
+0.1%
State:
+114.3%
Income statistics for Black or African American residents
Aggregate household income in Orchard in 2022: $1,487,344
Median per capita income in Orchard in 2022:
Orchard:
$78,308
Texas:
$30,490
Change in median per capita income between 2000 and 2022:
Orchard, Texas:
+104.2%
State:
+113.9%
Income statistics for Hispanic or Latino residents
Median household income in Orchard, TX in 2022:
Orchard:
$37,924
State:
$60,504
Change in median household income between 2000 and 2022:
Orchard, Texas:
+26.4%
State:
+102.5%
Number of households with income < $10k:
Orchard:
0.0% (0)
State:
5.8% (213,953)
Number of households with income $10k - 20k:
Orchard:
0.0% (0)
State:
8.0% (297,456)
Number of households with income $20k - 30k:
Orchard:
22.4% (15)
State:
9.2% (340,166)
Number of households with income $30k - 40k:
Orchard:
35.8% (24)
State:
9.5% (354,336)
Number of households with income $40k - 50k:
Orchard:
6.0% (4)
Texas:
8.8% (327,013)
Number of households with income $50k - 60k:
Orchard:
9.0% (6)
State:
8.3% (308,818)
Number of households with income $60k - 75k:
Orchard:
9.0% (6)
Texas:
10.9% (405,109)
Number of households with income $75k - 100k:
Orchard:
14.9% (10)
State:
13.8% (511,639)
Number of households with income $100k - 125k:
Orchard:
3.0% (2)
Texas:
8.6% (319,728)
Number of households with income $125k - 150k:
Orchard:
0.0% (0)
State:
5.7% (210,932)
Number of households with income $150k - 200k:
Orchard:
0.0% (0)
State:
6.4% (236,055)
Number of households with income > $200k:
Orchard:
0.0% (0)
Texas:
5.1% (189,259)
Aggregate household income in Orchard in 2022: $3,110,858
Median family income in Orchard in 2022:
Orchard:
$36,778
Texas:
$65,080
Number of families with income $20k - 30k:
Orchard:
35.6% (20)
State:
8.6% (238,528)
Number of families with income $30k - 40k:
Orchard:
18.8% (11)
State:
9.1% (251,999)
Number of families with income $40k - 50k:
Orchard:
5.8% (3)
Texas:
8.6% (240,188)
Number of families with income $50k - 60k:
Orchard:
8.8% (5)
State:
8.0% (223,566)
Number of families with income $60k - 75k:
Orchard:
10.9% (6)
State:
10.9% (302,688)
Number of families with income $75k - 100k:
Orchard:
16.9% (10)
State:
14.3% (398,554)
Number of families with income $100k - 125k:
Orchard:
3.2% (2)
Texas:
9.5% (264,007)
Median per capita income in Orchard in 2022:
Orchard:
$15,818
State:
$24,862
Change in median per capita income between 2000 and 2022:
Orchard, Texas:
+42.3%
Texas:
+130.8%
Income statistics for American Indian and Alaska Native residents
Median per capita income in Orchard in 2022:
Orchard:
$38,518
State:
$28,166
Change in median per capita income between 2000 and 2022:
Orchard, Texas:
+78.2%
State:
+77.2%
Income statistics for Multirace residents
Number of households with income < $10k:
Orchard:
0.0% (0)
State:
5.5% (122,324)
Number of households with income $10k - 20k:
Orchard:
0.0% (0)
Texas:
8.2% (182,232)
Number of households with income $20k - 30k:
Orchard:
0.0% (0)
State:
8.5% (189,456)
Number of households with income $30k - 40k:
Orchard:
55.8% (24)
State:
8.9% (197,499)
Number of households with income $40k - 50k:
Orchard:
0.0% (0)
Texas:
8.7% (191,735)
Number of households with income $50k - 60k:
Orchard:
11.6% (5)
Texas:
8.0% (177,535)
Number of households with income $60k - 75k:
Orchard:
0.0% (0)
State:
10.5% (232,479)
Number of households with income $75k - 100k:
Orchard:
23.3% (10)
State:
13.1% (290,448)
Number of households with income $100k - 125k:
Orchard:
9.3% (4)
State:
8.6% (191,595)
Number of households with income $125k - 150k:
Orchard:
0.0% (0)
State:
6.0% (133,361)
Number of households with income $150k - 200k:
Orchard:
0.0% (0)
Texas:
7.2% (159,195)
Number of households with income > $200k:
Orchard:
0.0% (0)
Texas:
6.7% (148,064)
Aggregate household income in Orchard in 2022: $2,507,510
Median family income in Orchard in 2022:
Orchard:
$80,627
State:
$69,780
Number of families with income $30k - 40k:
Orchard:
24.9% (7)
Texas:
8.5% (137,626)
Number of families with income $50k - 60k:
Orchard:
13.8% (4)
State:
7.9% (127,739)
Number of families with income $75k - 100k:
Orchard:
45.7% (12)
State:
14.0% (226,284)
Number of families with income $100k - 125k:
Orchard:
15.6% (4)
Texas:
9.5% (153,597)
Median per capita income in Orchard in 2022:
Orchard:
$19,484
State:
$26,785
Income statistics for other residents
Aggregate household income in Orchard in 2022: $1,136,787
Median per capita income in Orchard in 2022:
Orchard:
$12,392
State:
$23,899
Change in median per capita income between 2000 and 2022:
Orchard, Texas:
+28.9%
State:
+135.2%
Discuss Orchard, Texas (TX) on our hugely popular Texas forum.