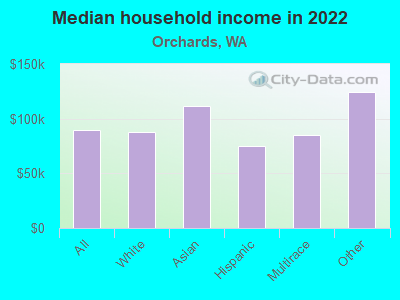
The median household income in Orchards, WA in 2022 was $89,307, which was 2.2% less than the median annual income of $91,306 across the entire state of Washington. Compared to the median income of $49,216 in 2000 this represents an increase of 44.9%. The per capita income in 2022 was $41,055, which means an increase of 56.5% compared to 2000 when it was $17,866.
Whole page based on the data from 2000 / 2022 when the population of Orchards, Washington was 17,852 / 29,949
Income statistics for all residents
Median household income in Orchards, WA in 2022:
Orchards:
$89,308
State:
$91,306
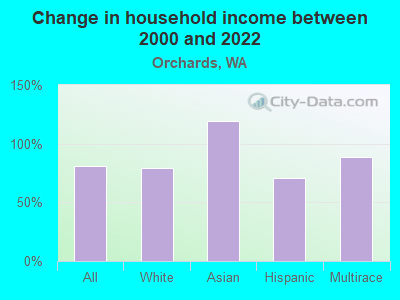
Change in median household income between 2000 and 2022:
Orchards, Washington:
+81.5%
State:
+99.5%
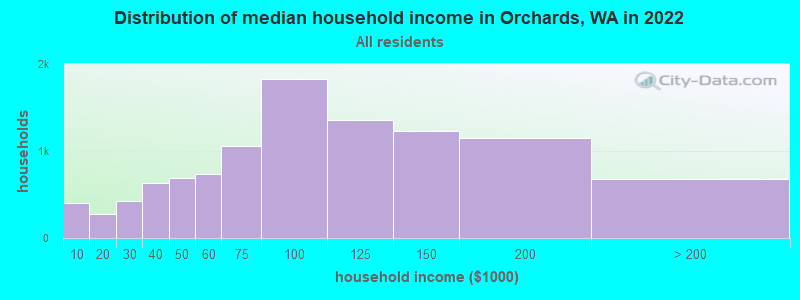
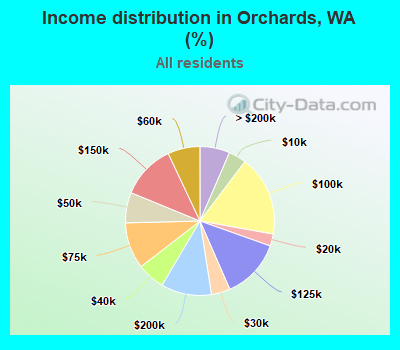
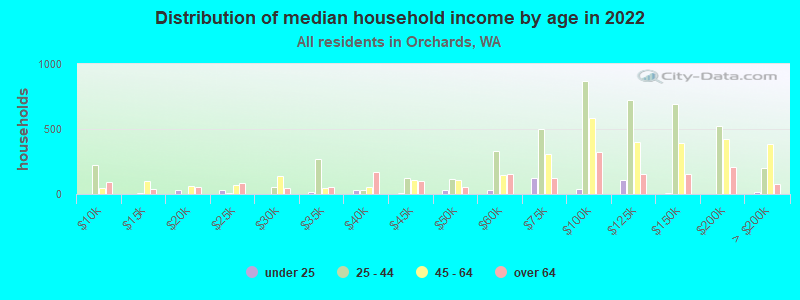
Number of households with income < $10k:
Orchards:
3.8% (400)
State:
4.5% (139,331)
Number of households with income $10k - 20k:
Orchards:
2.6% (273)
Washington:
5.0% (154,508)
Number of households with income $20k - 30k:
Orchards:
4.1% (428)
State:
5.4% (166,555)
Number of households with income $30k - 40k:
Orchards:
6.0% (631)
State:
5.5% (170,324)
Number of households with income $40k - 50k:
Orchards:
6.6% (691)
Washington:
6.0% (183,941)
Number of households with income $50k - 60k:
Orchards:
7.0% (731)
State:
6.1% (187,395)
Number of households with income $60k - 75k:
Orchards:
10.1% (1,054)
State:
8.7% (266,771)
Number of households with income $75k - 100k:
Orchards:
17.5% (1,832)
State:
13.1% (404,672)
Number of households with income $100k - 125k:
Orchards:
13.0% (1,361)
Washington:
11.0% (337,911)
Number of households with income $125k - 150k:
Orchards:
11.8% (1,233)
State:
8.0% (244,934)
Number of households with income $150k - 200k:
Orchards:
11.0% (1,146)
State:
10.5% (323,812)
Number of households with income > $200k:
Orchards:
6.5% (678)
State:
16.2% (499,799)
Aggregate household income in Orchards in 2022: $1,182,054,024
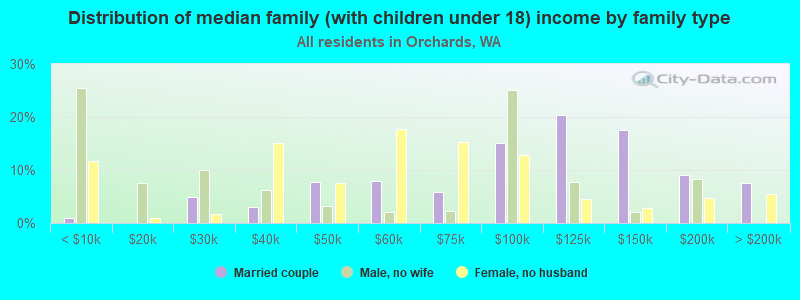
Median family income in Orchards in 2022:
Orchards:
$92,770
Washington:
$109,192
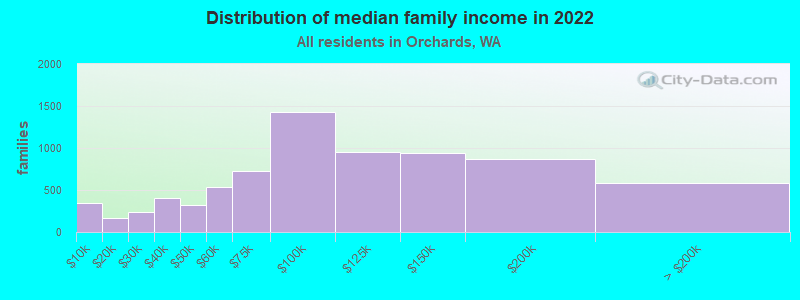
Number of families with income < $10k:
Orchards:
4.6% (347)
Washington:
2.9% (55,953)
Number of families with income $10k - 20k:
Orchards:
2.2% (168)
State:
2.6% (50,138)
Number of families with income $20k - 30k:
Orchards:
3.1% (233)
Washington:
3.2% (61,974)
Number of families with income $30k - 40k:
Orchards:
5.4% (404)
State:
4.1% (80,240)
Number of families with income $40k - 50k:
Orchards:
4.3% (321)
State:
4.9% (94,310)
Number of families with income $50k - 60k:
Orchards:
7.2% (538)
Washington:
5.3% (101,674)
Number of families with income $60k - 75k:
Orchards:
9.6% (724)
Washington:
8.2% (158,348)
Number of families with income $75k - 100k:
Orchards:
19.1% (1,431)
Washington:
13.8% (267,812)
Number of families with income $100k - 125k:
Orchards:
12.6% (947)
State:
12.4% (240,213)
Number of families with income $125k - 150k:
Orchards:
12.6% (945)
State:
9.3% (180,011)
Number of families with income $150k - 200k:
Orchards:
11.5% (868)
State:
13.0% (250,874)
Number of families with income > $200k:
Orchards:
7.8% (586)
State:
20.4% (393,898)
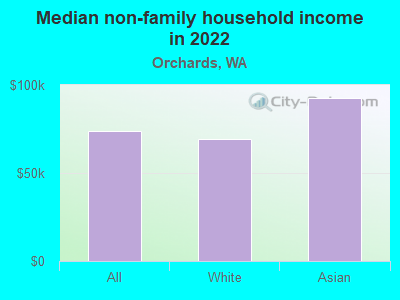
Median non-family income in Orchards in 2022:
Orchards:
$73,740
State:
$57,299
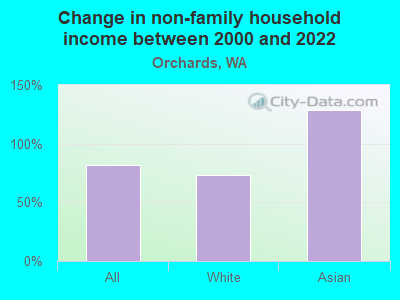
Change in median non-family income between 2000 and 2022:
Orchards, Washington:
+82.0%
State:
+94.9%
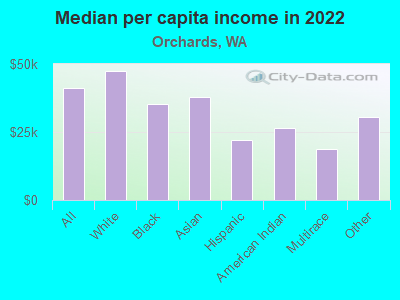
Median per capita income in Orchards in 2022:
Orchards:
$41,055
State:
$50,764
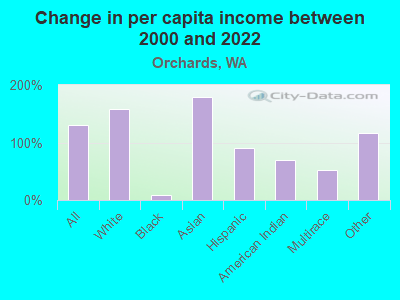
Change in median per capita income between 2000 and 2022:
Orchards, Washington:
+129.8%
Washington:
+121.0%
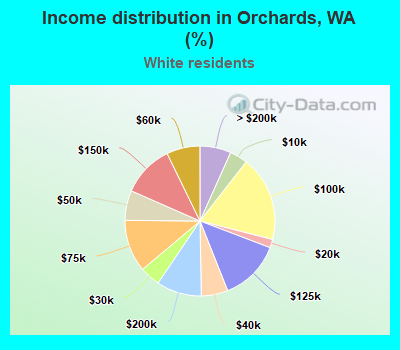
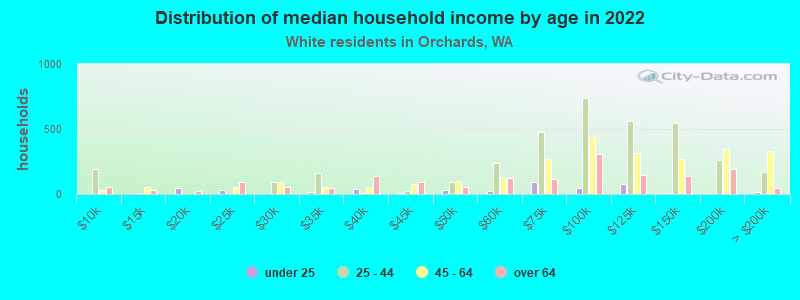
Income statistics for White residents
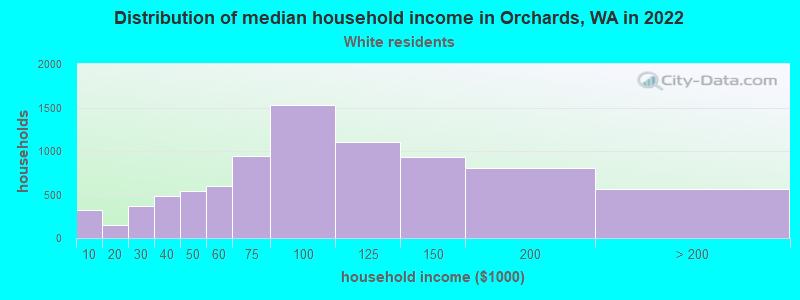
Median household income in Orchards, WA in 2022:
Orchards:
$87,588
State:
$91,916
Change in median household income between 2000 and 2022:
Orchards, Washington:
+78.9%
Washington:
+95.4%
Number of households with income < $10k:
Orchards:
3.9% (321)
State:
4.3% (95,850)
Number of households with income $10k - 20k:
Orchards:
1.8% (150)
Washington:
4.8% (106,421)
Number of households with income $20k - 30k:
Orchards:
4.4% (365)
State:
5.5% (122,860)
Number of households with income $30k - 40k:
Orchards:
5.7% (478)
State:
5.4% (119,627)
Number of households with income $40k - 50k:
Orchards:
6.4% (536)
State:
5.9% (132,276)
Number of households with income $50k - 60k:
Orchards:
7.2% (600)
State:
6.1% (136,212)
Number of households with income $60k - 75k:
Orchards:
11.3% (939)
State:
8.8% (196,086)
Number of households with income $75k - 100k:
Orchards:
18.4% (1,532)
Washington:
13.4% (299,192)
Number of households with income $100k - 125k:
Orchards:
13.2% (1,098)
State:
11.3% (252,209)
Number of households with income $125k - 150k:
Orchards:
11.2% (931)
State:
7.9% (175,962)
Number of households with income $150k - 200k:
Orchards:
9.7% (810)
Washington:
10.7% (239,156)
Number of households with income > $200k:
Orchards:
6.7% (558)
State:
16.1% (359,917)
Aggregate household income in Orchards in 2022: $961,679,176
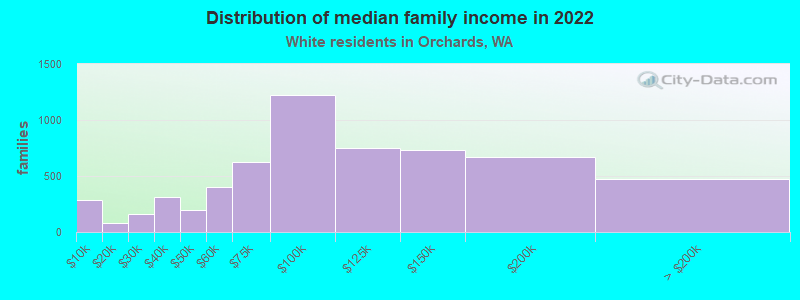
Median family income in Orchards in 2022:
Orchards:
$92,973
Washington:
$112,511
Number of families with income < $10k:
Orchards:
4.9% (289)
State:
2.4% (33,676)
Number of families with income $10k - 20k:
Orchards:
1.4% (80)
State:
2.0% (28,228)
Number of families with income $20k - 30k:
Orchards:
2.7% (159)
State:
2.9% (39,288)
Number of families with income $30k - 40k:
Orchards:
5.3% (311)
State:
3.6% (50,190)
Number of families with income $40k - 50k:
Orchards:
3.3% (196)
Washington:
4.6% (63,009)
Number of families with income $50k - 60k:
Orchards:
6.8% (400)
State:
5.0% (69,270)
Number of families with income $60k - 75k:
Orchards:
10.6% (628)
State:
8.2% (112,369)
Number of families with income $75k - 100k:
Orchards:
20.7% (1,222)
State:
14.1% (194,214)
Number of families with income $100k - 125k:
Orchards:
12.7% (751)
State:
13.2% (182,184)
Number of families with income $125k - 150k:
Orchards:
12.4% (732)
Washington:
9.5% (130,928)
Number of families with income $150k - 200k:
Orchards:
11.3% (666)
Washington:
13.7% (188,621)
Number of families with income > $200k:
Orchards:
8.1% (476)
Washington:
20.8% (285,982)
Median non-family income in Orchards in 2022:
Orchards:
$69,513
Washington:
$56,103
Change in median non-family income between 2000 and 2022:
Orchards, Washington:
+73.0%
Washington:
+87.7%
Median per capita income in Orchards in 2022:
Orchards:
$47,605
Washington:
$55,212
Income statistics for Black or African American residents
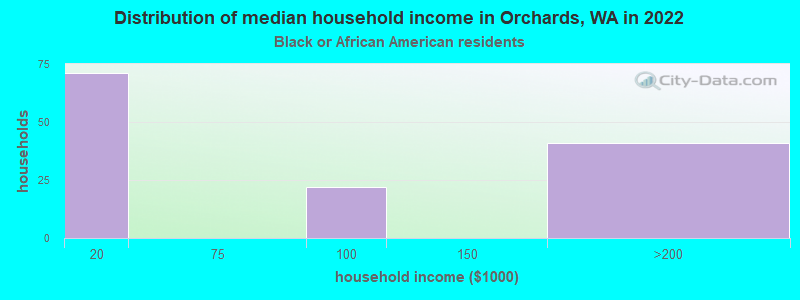
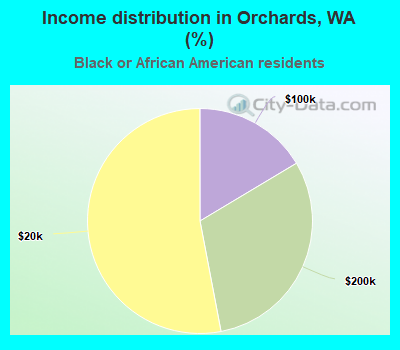
Number of households with income < $10k:
Orchards:
0.0% (0)
State:
7.2% (8,014)
Number of households with income $10k - 20k:
Orchards:
53.0% (71)
State:
8.0% (8,904)
Number of households with income $20k - 30k:
Orchards:
0.0% (0)
State:
7.4% (8,207)
Number of households with income $30k - 40k:
Orchards:
0.0% (0)
State:
5.6% (6,220)
Number of households with income $40k - 50k:
Orchards:
0.0% (0)
State:
9.5% (10,585)
Number of households with income $50k - 60k:
Orchards:
0.0% (0)
Washington:
7.3% (8,078)
Number of households with income $60k - 75k:
Orchards:
0.0% (0)
State:
8.7% (9,704)
Number of households with income $75k - 100k:
Orchards:
16.4% (22)
State:
12.9% (14,315)
Number of households with income $100k - 125k:
Orchards:
0.0% (0)
State:
7.7% (8,592)
Number of households with income $125k - 150k:
Orchards:
0.0% (0)
State:
8.9% (9,840)
Number of households with income $150k - 200k:
Orchards:
30.6% (41)
State:
7.6% (8,434)
Number of households with income > $200k:
Orchards:
0.0% (0)
State:
9.1% (10,075)
Aggregate household income in Orchards in 2022: $10,584,498
Median per capita income in Orchards in 2022:
Orchards:
$35,151
State:
$38,209
Change in median per capita income between 2000 and 2022:
Orchards, Washington:
+7.8%
State:
+115.3%
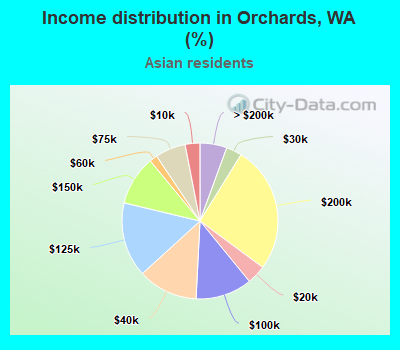
Income statistics for Asian residents
Median household income in Orchards, WA in 2022:
Orchards:
$111,208
Washington:
$125,692
Change in median household income between 2000 and 2022:
Orchards, Washington:
+119.1%
State:
+164.5%
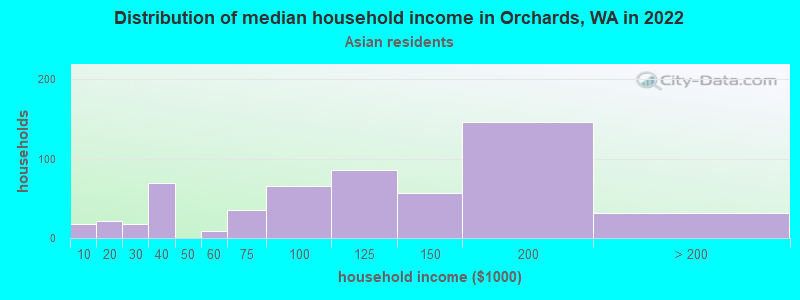
Number of households with income < $10k:
Orchards:
3.1% (17)
State:
4.9% (14,099)
Number of households with income $10k - 20k:
Orchards:
4.0% (22)
Washington:
3.5% (9,873)
Number of households with income $20k - 30k:
Orchards:
3.2% (18)
State:
2.9% (8,352)
Number of households with income $30k - 40k:
Orchards:
12.4% (69)
State:
4.0% (11,415)
Number of households with income $40k - 50k:
Orchards:
0.0% (0)
State:
4.0% (11,421)
Number of households with income $50k - 60k:
Orchards:
1.6% (9)
Washington:
4.2% (12,100)
Number of households with income $60k - 75k:
Orchards:
6.3% (35)
State:
6.3% (17,903)
Number of households with income $75k - 100k:
Orchards:
11.7% (65)
State:
10.4% (29,663)
Number of households with income $100k - 125k:
Orchards:
15.5% (86)
State:
9.4% (26,839)
Number of households with income $125k - 150k:
Orchards:
10.3% (57)
Washington:
8.5% (24,200)
Number of households with income $150k - 200k:
Orchards:
26.3% (146)
State:
12.6% (35,976)
Number of households with income > $200k:
Orchards:
5.6% (31)
Washington:
29.2% (83,109)
Aggregate household income in Orchards in 2022: $61,886,858
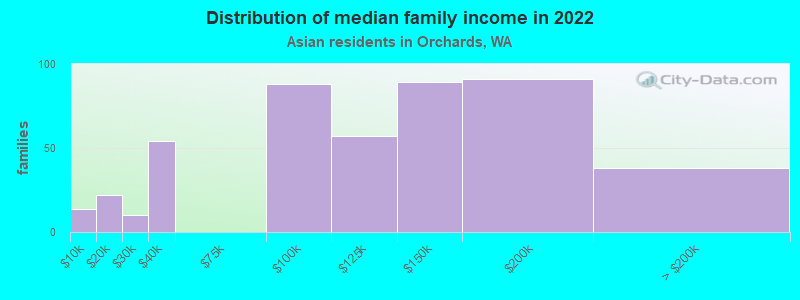
Median family income in Orchards in 2022:
Orchards:
$110,959
State:
$143,595
Number of families with income < $10k:
Orchards:
3.0% (14)
Washington:
2.9% (5,479)
Number of families with income $10k - 20k:
Orchards:
4.7% (22)
Washington:
2.2% (4,150)
Number of families with income $20k - 30k:
Orchards:
2.2% (10)
State:
1.9% (3,558)
Number of families with income $30k - 40k:
Orchards:
11.7% (54)
State:
3.1% (5,734)
Number of families with income $75k - 100k:
Orchards:
18.9% (88)
State:
11.7% (21,919)
Number of families with income $100k - 125k:
Orchards:
12.3% (57)
State:
9.3% (17,280)
Number of families with income $125k - 150k:
Orchards:
19.2% (89)
State:
8.4% (15,602)
Number of families with income $150k - 200k:
Orchards:
19.6% (91)
State:
13.3% (24,789)
Number of families with income > $200k:
Orchards:
8.3% (38)
State:
34.4% (64,250)
Median non-family income in Orchards in 2022:
Orchards:
$92,727
Washington:
$84,971
Change in median non-family income between 2000 and 2022:
Orchards, Washington:
+129.4%
State:
+211.1%
Median per capita income in Orchards in 2022:
Orchards:
$37,739
Washington:
$67,666
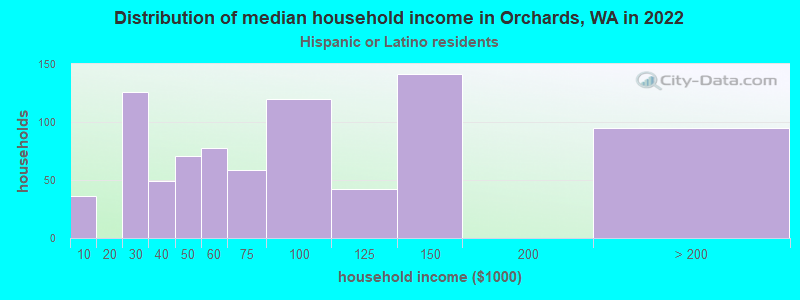
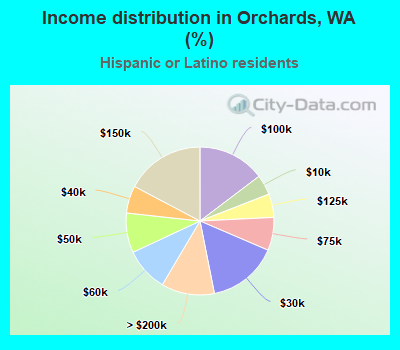
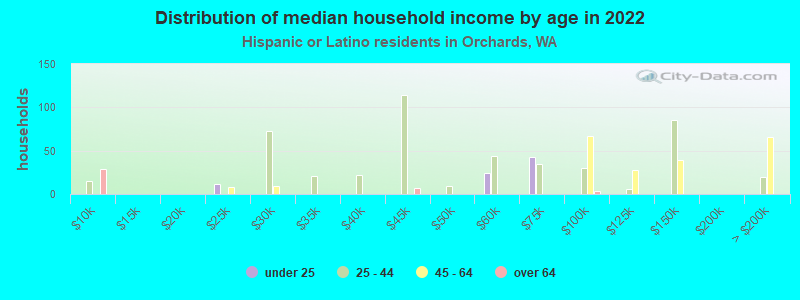
Income statistics for Hispanic or Latino residents
Median household income in Orchards, WA in 2022:
Orchards:
$75,255
Washington:
$74,770
Change in median household income between 2000 and 2022:
Orchards, Washington:
+70.6%
State:
+128.3%
Number of households with income < $10k:
Orchards:
4.4% (36)
State:
4.9% (14,456)
Number of households with income $10k - 20k:
Orchards:
0.0% (0)
State:
5.3% (15,449)
Number of households with income $20k - 30k:
Orchards:
15.4% (126)
Washington:
6.8% (20,016)
Number of households with income $30k - 40k:
Orchards:
6.0% (49)
Washington:
7.7% (22,548)
Number of households with income $40k - 50k:
Orchards:
8.7% (71)
State:
7.3% (21,450)
Number of households with income $50k - 60k:
Orchards:
9.5% (78)
State:
7.7% (22,744)
Number of households with income $60k - 75k:
Orchards:
7.2% (59)
Washington:
10.5% (30,737)
Number of households with income $75k - 100k:
Orchards:
14.7% (120)
State:
14.9% (43,843)
Number of households with income $100k - 125k:
Orchards:
5.1% (42)
Washington:
11.1% (32,554)
Number of households with income $125k - 150k:
Orchards:
17.3% (141)
Washington:
7.4% (21,624)
Number of households with income $150k - 200k:
Orchards:
0.0% (0)
State:
7.3% (21,360)
Number of households with income > $200k:
Orchards:
11.6% (95)
Washington:
9.2% (27,055)
Aggregate household income in Orchards in 2022: $75,777,807
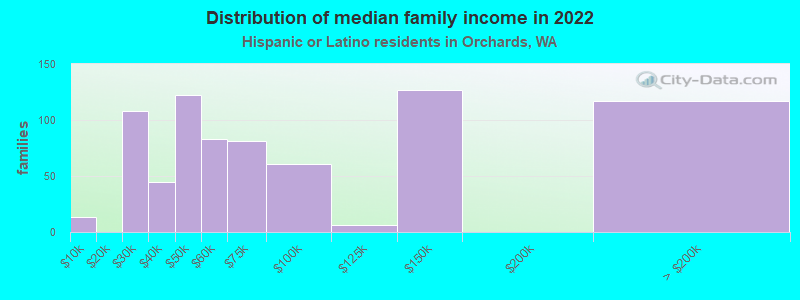
Median family income in Orchards in 2022:
Orchards:
$61,665
State:
$76,866
Number of families with income < $10k:
Orchards:
1.7% (13)
Washington:
4.4% (9,443)
Number of families with income $20k - 30k:
Orchards:
14.1% (108)
State:
5.6% (12,052)
Number of families with income $30k - 40k:
Orchards:
5.9% (45)
State:
8.3% (17,803)
Number of families with income $40k - 50k:
Orchards:
15.9% (122)
State:
7.7% (16,361)
Number of families with income $50k - 60k:
Orchards:
10.9% (83)
Washington:
7.9% (16,852)
Number of families with income $60k - 75k:
Orchards:
10.6% (81)
State:
11.4% (24,342)
Number of families with income $75k - 100k:
Orchards:
8.1% (61)
State:
14.4% (30,698)
Number of families with income $100k - 125k:
Orchards:
0.8% (6)
Washington:
11.4% (24,331)
Number of families with income $125k - 150k:
Orchards:
16.6% (127)
State:
7.5% (16,099)
Number of families with income > $200k:
Orchards:
15.4% (117)
State:
9.7% (20,653)
Median per capita income in Orchards in 2022:
Orchards:
$22,000
State:
$28,252
Change in median per capita income between 2000 and 2022:
Orchards, Washington:
+90.0%
State:
+150.2%
Income statistics for American Indian and Alaska Native residents
Median per capita income in Orchards in 2022:
Orchards:
$26,349
State:
$27,053
Change in median per capita income between 2000 and 2022:
Orchards, Washington:
+68.8%
State:
+98.6%
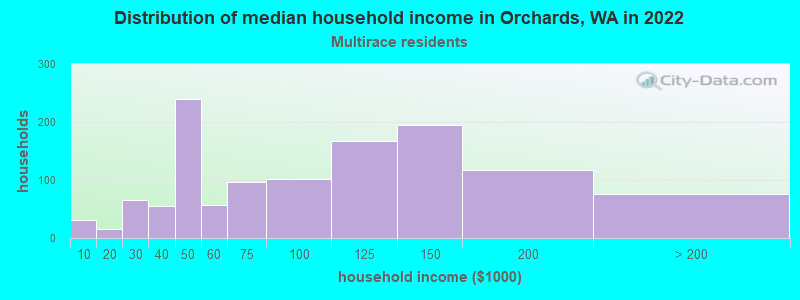
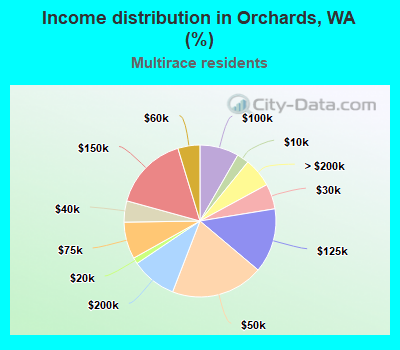
Income statistics for Multirace residents
Median household income in Orchards, WA in 2022:
Orchards:
$85,423
Washington:
$84,303
Change in median household income between 2000 and 2022:
Orchards, Washington:
+89.2%
State:
+125.7%
Number of households with income < $10k:
Orchards:
2.5% (31)
Washington:
4.3% (12,040)
Number of households with income $10k - 20k:
Orchards:
1.3% (16)
Washington:
6.6% (18,437)
Number of households with income $20k - 30k:
Orchards:
5.3% (65)
Washington:
5.2% (14,559)
Number of households with income $30k - 40k:
Orchards:
4.5% (55)
State:
6.7% (18,491)
Number of households with income $40k - 50k:
Orchards:
19.7% (240)
Washington:
6.3% (17,459)
Number of households with income $50k - 60k:
Orchards:
4.7% (57)
Washington:
6.9% (19,086)
Number of households with income $60k - 75k:
Orchards:
7.9% (96)
Washington:
9.1% (25,310)
Number of households with income $75k - 100k:
Orchards:
8.3% (101)
Washington:
13.5% (37,493)
Number of households with income $100k - 125k:
Orchards:
13.7% (167)
State:
10.7% (29,626)
Number of households with income $125k - 150k:
Orchards:
16.0% (195)
State:
8.6% (23,899)
Number of households with income $150k - 200k:
Orchards:
9.7% (118)
Washington:
10.2% (28,214)
Number of households with income > $200k:
Orchards:
6.2% (76)
State:
11.9% (32,947)
Aggregate household income in Orchards in 2022: $134,990,318
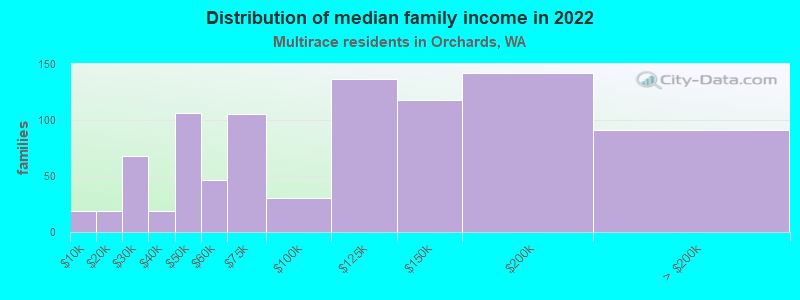
Median family income in Orchards in 2022:
Orchards:
$75,097
State:
$95,629
Number of families with income < $10k:
Orchards:
2.2% (19)
State:
3.5% (6,121)
Number of families with income $10k - 20k:
Orchards:
2.1% (19)
Washington:
4.3% (7,519)
Number of families with income $20k - 30k:
Orchards:
7.6% (68)
State:
4.4% (7,775)
Number of families with income $30k - 40k:
Orchards:
2.1% (19)
Washington:
5.8% (10,186)
Number of families with income $40k - 50k:
Orchards:
11.8% (106)
State:
5.9% (10,412)
Number of families with income $50k - 60k:
Orchards:
5.1% (46)
State:
5.6% (9,922)
Number of families with income $60k - 75k:
Orchards:
11.7% (105)
Washington:
9.7% (17,113)
Number of families with income $75k - 100k:
Orchards:
3.3% (30)
State:
13.6% (23,984)
Number of families with income $100k - 125k:
Orchards:
15.2% (137)
State:
10.4% (18,288)
Number of families with income $125k - 150k:
Orchards:
13.1% (118)
State:
10.5% (18,481)
Number of families with income $150k - 200k:
Orchards:
15.8% (142)
Washington:
11.9% (20,852)
Number of families with income > $200k:
Orchards:
10.2% (91)
State:
14.4% (25,289)
Median per capita income in Orchards in 2022:
Orchards:
$18,606
State:
$32,496
Change in median per capita income between 2000 and 2022:
Orchards, Washington:
+53.2%
Washington:
+156.8%
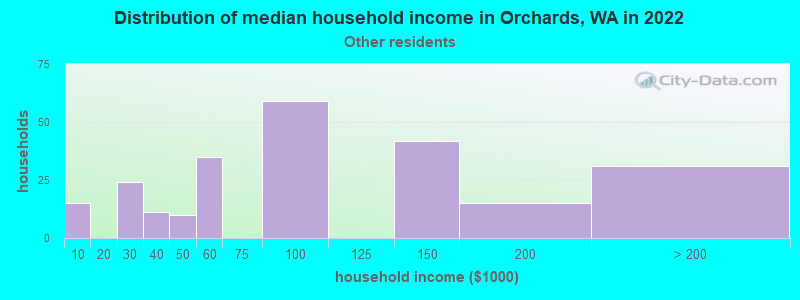
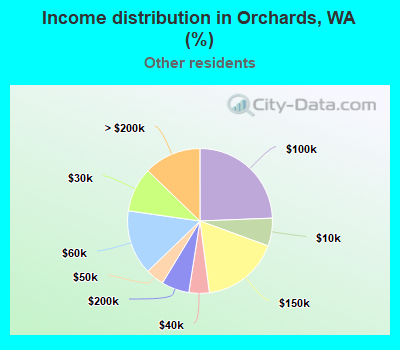
Income statistics for other residents
Median household income in Orchards, WA in 2022:
Orchards:
$123,984
State:
$69,545
Number of households with income < $10k:
Orchards:
6.2% (15)
State:
5.3% (6,540)
Number of households with income $10k - 20k:
Orchards:
0.0% (0)
State:
6.0% (7,385)
Number of households with income $20k - 30k:
Orchards:
9.9% (24)
State:
7.5% (9,289)
Number of households with income $30k - 40k:
Orchards:
4.5% (11)
State:
8.9% (11,015)
Number of households with income $40k - 50k:
Orchards:
4.1% (10)
State:
7.6% (9,399)
Number of households with income $50k - 60k:
Orchards:
14.5% (35)
State:
7.2% (8,867)
Number of households with income $60k - 75k:
Orchards:
0.0% (0)
Washington:
10.5% (13,032)
Number of households with income $75k - 100k:
Orchards:
24.4% (59)
State:
14.6% (18,007)
Number of households with income $100k - 125k:
Orchards:
0.0% (0)
State:
12.2% (15,128)
Number of households with income $125k - 150k:
Orchards:
17.4% (42)
State:
5.6% (6,950)
Number of households with income $150k - 200k:
Orchards:
6.2% (15)
Washington:
7.1% (8,749)
Number of households with income > $200k:
Orchards:
12.8% (31)
State:
7.5% (9,208)
Aggregate household income in Orchards in 2022: $24,362,087
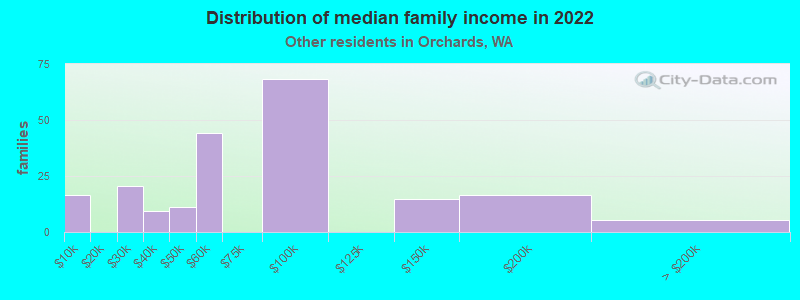
Median family income in Orchards in 2022:
Orchards:
$69,472
State:
$72,588
Number of families with income < $10k:
Orchards:
8.0% (17)
Washington:
5.5% (5,287)
Number of families with income $20k - 30k:
Orchards:
10.0% (21)
State:
6.6% (6,293)
Number of families with income $30k - 40k:
Orchards:
4.6% (10)
State:
9.2% (8,827)
Number of families with income $40k - 50k:
Orchards:
5.4% (11)
Washington:
8.0% (7,634)
Number of families with income $50k - 60k:
Orchards:
21.4% (44)
State:
7.7% (7,357)
Number of families with income $75k - 100k:
Orchards:
32.9% (68)
State:
14.5% (13,800)
Number of families with income $125k - 150k:
Orchards:
7.0% (15)
Washington:
6.0% (5,679)
Number of families with income $150k - 200k:
Orchards:
8.0% (17)
State:
8.2% (7,822)
Number of families with income > $200k:
Orchards:
2.7% (6)
State:
7.1% (6,764)
Median per capita income in Orchards in 2022:
Orchards:
$30,381
State:
$27,542
Change in median per capita income between 2000 and 2022:
Orchards, Washington:
+117.1%
Washington:
+167.8%
Discuss Orchards, Washington (WA) on our hugely popular Washington forum.