The median household income in Orland Park, IL in 2022 was $95,285, which was 19.5% greater than the median annual income of $76,708 across the entire state of Illinois. Compared to the median income of $67,574 in 2000 this represents an increase of 29.1%. The per capita income in 2022 was $49,914, which means an increase of 39.0% compared to 2000 when it was $30,467.
Whole page based on the data from 2000 / 2022 when the population of Orland Park, Illinois was 51,077 / 57,049
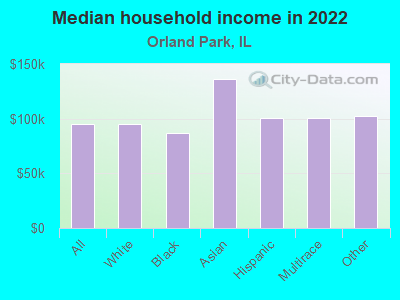
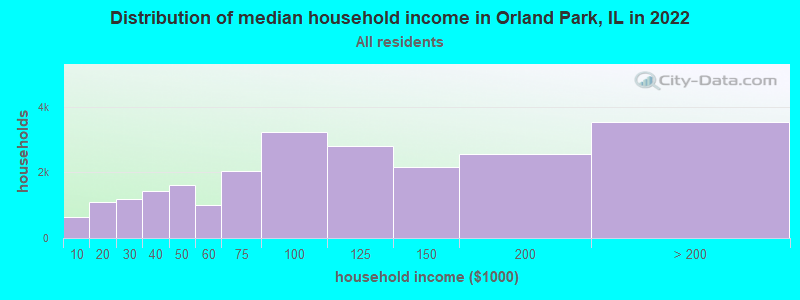
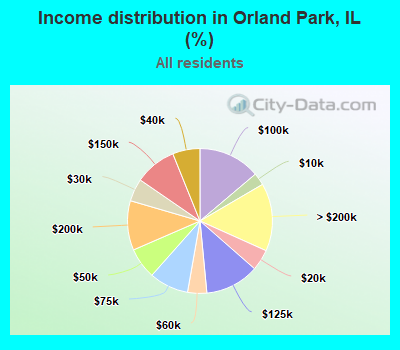
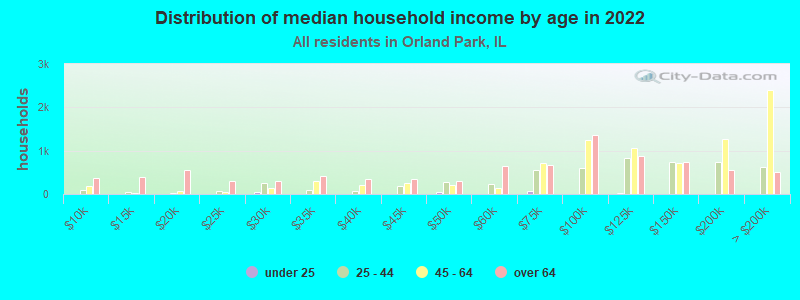
Income statistics for all residents
Median household income in Orland Park, IL in 2022:
Orland Park:
$95,286
State:
$76,708
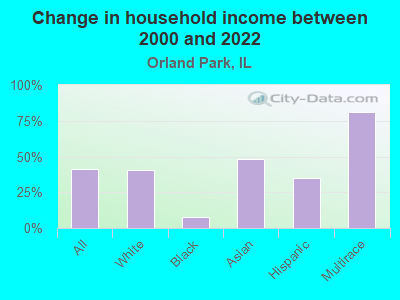
Change in median household income between 2000 and 2022:
Orland Park, Illinois:
+41.0%
State:
+64.6%
Number of households with income < $10k:
Orland Park:
2.7% (640)
State:
5.9% (296,090)
Number of households with income $10k - 20k:
Orland Park:
4.7% (1,102)
State:
6.6% (333,259)
Number of households with income $20k - 30k:
Orland Park:
5.1% (1,183)
State:
6.8% (342,921)
Number of households with income $30k - 40k:
Orland Park:
6.1% (1,425)
State:
7.0% (355,254)
Number of households with income $40k - 50k:
Orland Park:
6.9% (1,618)
State:
6.7% (340,678)
Number of households with income $50k - 60k:
Orland Park:
4.3% (998)
Illinois:
6.7% (339,405)
Number of households with income $60k - 75k:
Orland Park:
8.8% (2,047)
Illinois:
9.2% (465,709)
Number of households with income $75k - 100k:
Orland Park:
13.8% (3,226)
Illinois:
12.9% (651,353)
Number of households with income $100k - 125k:
Orland Park:
12.0% (2,808)
State:
10.3% (522,359)
Number of households with income $125k - 150k:
Orland Park:
9.3% (2,169)
State:
7.3% (367,136)
Number of households with income $150k - 200k:
Orland Park:
11.0% (2,574)
State:
9.0% (455,249)
Number of households with income > $200k:
Orland Park:
15.2% (3,537)
State:
11.6% (586,947)
Aggregate household income in Orland Park in 2022: $2,841,637,597
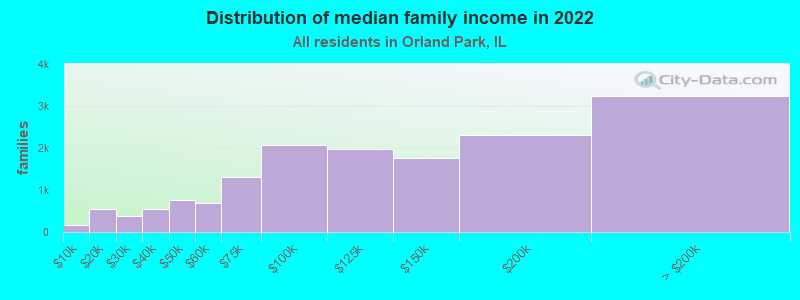
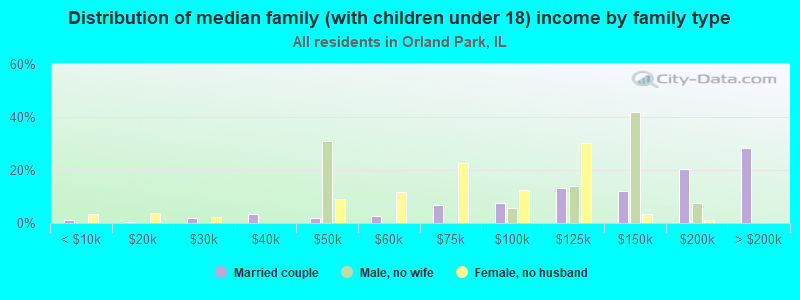
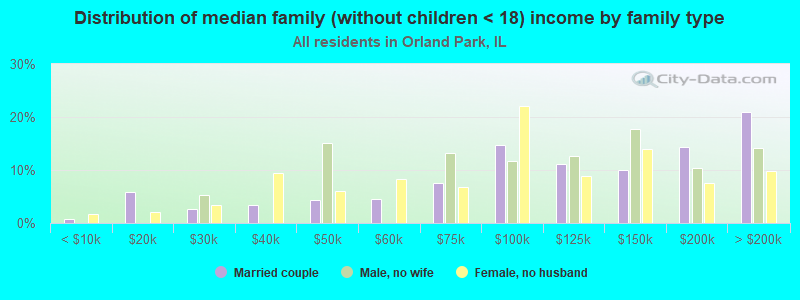
Median family income in Orland Park in 2022:
Orland Park:
$115,247
Illinois:
$96,948
Number of families with income < $10k:
Orland Park:
1.0% (157)
State:
3.4% (105,875)
Number of families with income $10k - 20k:
Orland Park:
3.5% (554)
State:
3.3% (105,017)
Number of families with income $20k - 30k:
Orland Park:
2.5% (390)
Illinois:
4.7% (146,403)
Number of families with income $30k - 40k:
Orland Park:
3.5% (558)
State:
5.3% (167,069)
Number of families with income $40k - 50k:
Orland Park:
4.8% (762)
State:
5.8% (181,164)
Number of families with income $50k - 60k:
Orland Park:
4.4% (693)
Illinois:
6.1% (191,561)
Number of families with income $60k - 75k:
Orland Park:
8.2% (1,298)
Illinois:
9.0% (282,985)
Number of families with income $75k - 100k:
Orland Park:
13.1% (2,072)
State:
13.8% (432,725)
Number of families with income $100k - 125k:
Orland Park:
12.5% (1,981)
Illinois:
11.9% (373,296)
Number of families with income $125k - 150k:
Orland Park:
11.2% (1,769)
State:
8.9% (279,791)
Number of families with income $150k - 200k:
Orland Park:
14.6% (2,312)
Illinois:
11.9% (372,004)
Number of families with income > $200k:
Orland Park:
20.6% (3,248)
Illinois:
15.9% (500,033)
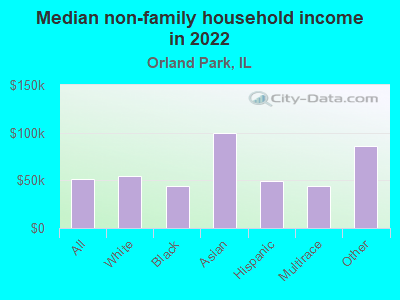
Median non-family income in Orland Park in 2022:
Orland Park:
$51,519
State:
$46,533
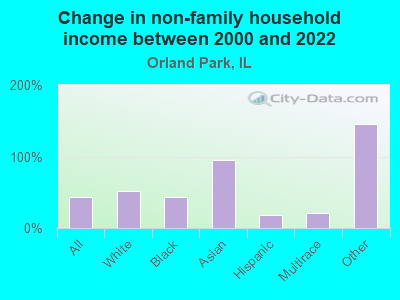
Change in median non-family income between 2000 and 2022:
Orland Park, Illinois:
+44.2%
State:
+64.0%
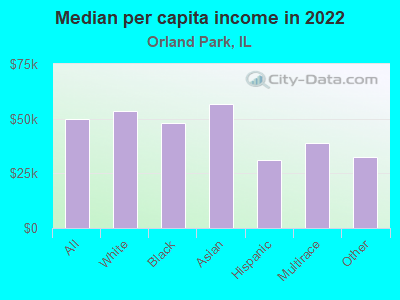
Median per capita income in Orland Park in 2022:
Orland Park:
$49,915
Illinois:
$43,317
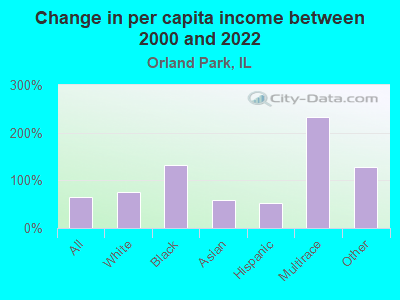
Change in median per capita income between 2000 and 2022:
Orland Park, Illinois:
+63.8%
Illinois:
+87.5%
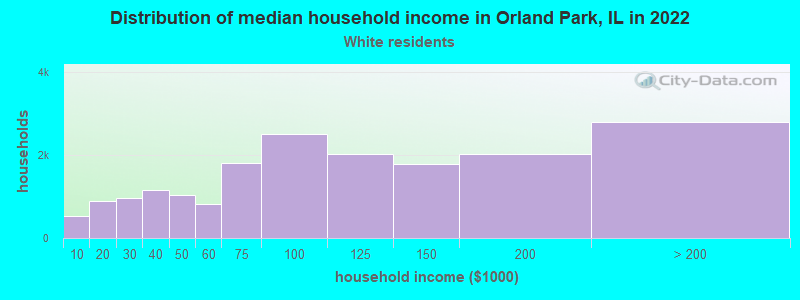
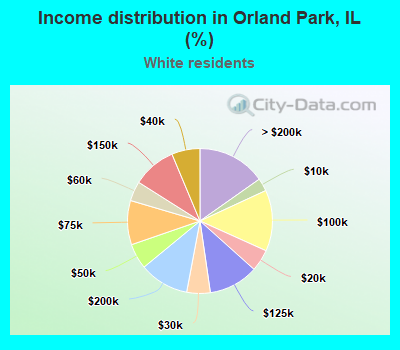
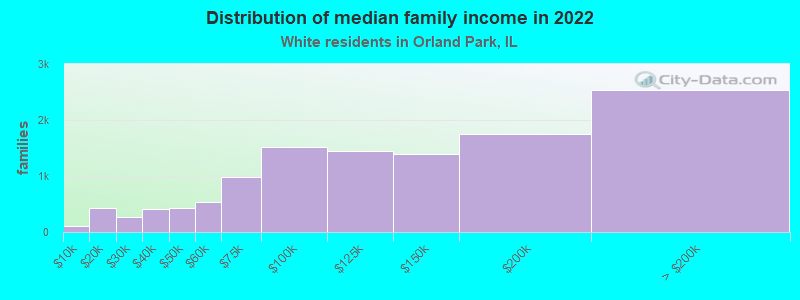
Income statistics for White residents
Median household income in Orland Park, IL in 2022:
Orland Park:
$94,903
Illinois:
$83,346
Change in median household income between 2000 and 2022:
Orland Park, Illinois:
+40.8%
State:
+67.5%
Number of households with income < $10k:
Orland Park:
2.9% (525)
State:
4.5% (149,895)
Number of households with income $10k - 20k:
Orland Park:
4.9% (895)
State:
5.5% (184,529)
Number of households with income $20k - 30k:
Orland Park:
5.3% (961)
State:
6.1% (205,767)
Number of households with income $30k - 40k:
Orland Park:
6.3% (1,153)
Illinois:
6.7% (225,572)
Number of households with income $40k - 50k:
Orland Park:
5.7% (1,035)
Illinois:
6.5% (216,965)
Number of households with income $50k - 60k:
Orland Park:
4.4% (806)
State:
6.6% (222,841)
Number of households with income $60k - 75k:
Orland Park:
9.9% (1,805)
State:
9.3% (312,758)
Number of households with income $75k - 100k:
Orland Park:
13.6% (2,495)
Illinois:
12.9% (433,180)
Number of households with income $100k - 125k:
Orland Park:
11.1% (2,026)
State:
10.7% (360,753)
Number of households with income $125k - 150k:
Orland Park:
9.7% (1,779)
State:
7.9% (266,532)
Number of households with income $150k - 200k:
Orland Park:
11.1% (2,027)
State:
10.0% (337,357)
Number of households with income > $200k:
Orland Park:
15.2% (2,787)
Illinois:
13.3% (446,069)
Aggregate household income in Orland Park in 2022: $2,273,300,549
Median family income in Orland Park in 2022:
Orland Park:
$119,087
State:
$107,938
Number of families with income < $10k:
Orland Park:
0.8% (100)
State:
2.2% (45,983)
Number of families with income $10k - 20k:
Orland Park:
3.7% (431)
State:
2.5% (50,574)
Number of families with income $20k - 30k:
Orland Park:
2.2% (261)
State:
3.5% (70,927)
Number of families with income $30k - 40k:
Orland Park:
3.4% (406)
State:
4.4% (90,563)
Number of families with income $40k - 50k:
Orland Park:
3.7% (433)
State:
5.0% (102,597)
Number of families with income $50k - 60k:
Orland Park:
4.5% (531)
State:
5.8% (119,129)
Number of families with income $60k - 75k:
Orland Park:
8.4% (984)
State:
8.8% (179,665)
Number of families with income $75k - 100k:
Orland Park:
12.9% (1,524)
State:
13.5% (276,887)
Number of families with income $100k - 125k:
Orland Park:
12.2% (1,439)
State:
12.5% (256,099)
Number of families with income $125k - 150k:
Orland Park:
11.8% (1,385)
State:
9.8% (199,855)
Number of families with income $150k - 200k:
Orland Park:
14.8% (1,749)
State:
13.4% (274,569)
Number of families with income > $200k:
Orland Park:
21.5% (2,536)
Illinois:
18.6% (381,354)
Median non-family income in Orland Park in 2022:
Orland Park:
$54,072
State:
$50,934
Change in median non-family income between 2000 and 2022:
Orland Park, Illinois:
+51.6%
State:
+70.7%
Median per capita income in Orland Park in 2022:
Orland Park:
$53,617
Illinois:
$50,738
Change in median per capita income between 2000 and 2022:
Orland Park, Illinois:
+74.9%
State:
+95.5%
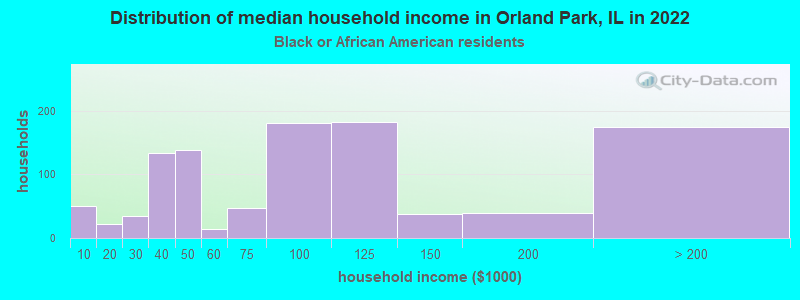
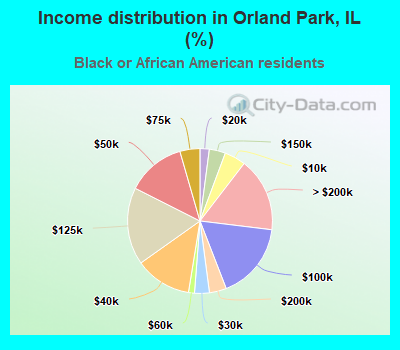
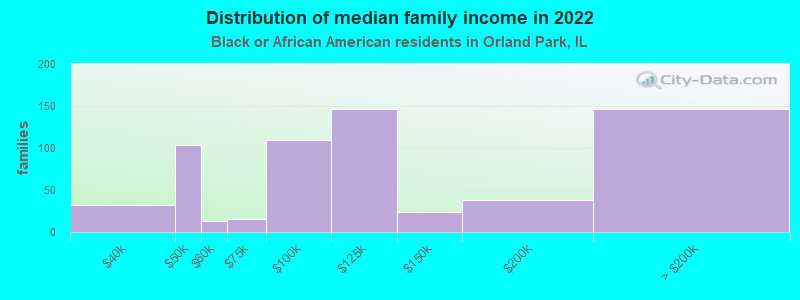
Income statistics for Black or African American residents
Median household income in Orland Park, IL in 2022:
Orland Park:
$86,654
State:
$45,019
Change in median household income between 2000 and 2022:
Orland Park, Illinois:
+7.9%
State:
+42.0%
Number of households with income < $10k:
Orland Park:
4.7% (50)
Illinois:
13.3% (92,224)
Number of households with income $10k - 20k:
Orland Park:
2.1% (22)
State:
13.5% (93,732)
Number of households with income $20k - 30k:
Orland Park:
3.3% (35)
Illinois:
9.9% (68,453)
Number of households with income $30k - 40k:
Orland Park:
12.6% (133)
Illinois:
8.5% (59,072)
Number of households with income $40k - 50k:
Orland Park:
13.1% (138)
Illinois:
7.9% (55,033)
Number of households with income $50k - 60k:
Orland Park:
1.3% (14)
State:
7.2% (49,556)
Number of households with income $60k - 75k:
Orland Park:
4.5% (47)
State:
7.8% (53,726)
Number of households with income $75k - 100k:
Orland Park:
17.2% (181)
Illinois:
11.6% (80,439)
Number of households with income $100k - 125k:
Orland Park:
17.3% (182)
State:
7.5% (52,244)
Number of households with income $125k - 150k:
Orland Park:
3.6% (38)
State:
3.9% (27,058)
Number of households with income $150k - 200k:
Orland Park:
3.8% (40)
Illinois:
4.6% (32,057)
Number of households with income > $200k:
Orland Park:
16.5% (174)
State:
4.1% (28,731)
Aggregate household income in Orland Park in 2022: $110,628,578
Median family income in Orland Park in 2022:
Orland Park:
$107,356
State:
$60,661
Number of families with income $30k - 40k:
Orland Park:
5.1% (32)
Illinois:
7.8% (28,775)
Number of families with income $40k - 50k:
Orland Park:
16.4% (104)
State:
8.5% (31,429)
Number of families with income $50k - 60k:
Orland Park:
2.1% (13)
Illinois:
7.1% (26,341)
Number of families with income $60k - 75k:
Orland Park:
2.5% (16)
State:
8.3% (30,626)
Number of families with income $75k - 100k:
Orland Park:
17.5% (110)
State:
14.0% (51,750)
Number of families with income $100k - 125k:
Orland Park:
23.2% (146)
Illinois:
9.3% (34,471)
Number of families with income $125k - 150k:
Orland Park:
3.7% (24)
State:
5.7% (21,103)
Number of families with income $150k - 200k:
Orland Park:
6.1% (38)
State:
6.8% (25,177)
Number of families with income > $200k:
Orland Park:
23.4% (147)
Illinois:
6.3% (23,371)
Median non-family income in Orland Park in 2022:
Orland Park:
$44,337
State:
$29,966
Change in median non-family income between 2000 and 2022:
Orland Park, Illinois:
+44.0%
State:
+44.4%
Median per capita income in Orland Park in 2022:
Orland Park:
$48,141
Illinois:
$28,045
Change in median per capita income between 2000 and 2022:
Orland Park, Illinois:
+131.9%
State:
+90.2%
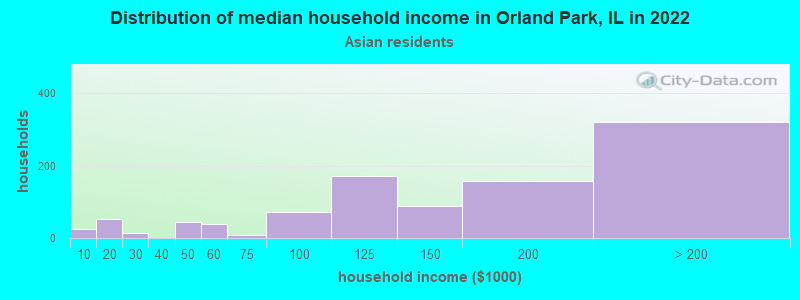
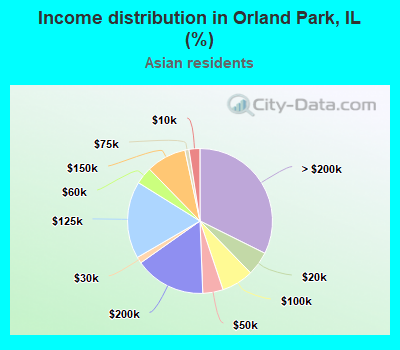
Income statistics for Asian residents
Median household income in Orland Park, IL in 2022:
Orland Park:
$136,506
State:
$104,287
Change in median household income between 2000 and 2022:
Orland Park, Illinois:
+48.4%
State:
+81.9%
Number of households with income < $10k:
Orland Park:
2.4% (24)
State:
5.3% (14,653)
Number of households with income $10k - 20k:
Orland Park:
5.3% (53)
State:
4.5% (12,283)
Number of households with income $20k - 30k:
Orland Park:
1.4% (14)
State:
4.8% (13,135)
Number of households with income $30k - 40k:
Orland Park:
0.0% (0)
State:
5.0% (13,655)
Number of households with income $40k - 50k:
Orland Park:
4.5% (45)
State:
4.5% (12,357)
Number of households with income $50k - 60k:
Orland Park:
3.8% (38)
State:
4.9% (13,568)
Number of households with income $60k - 75k:
Orland Park:
0.9% (9)
State:
7.1% (19,606)
Number of households with income $75k - 100k:
Orland Park:
7.2% (71)
Illinois:
12.1% (33,349)
Number of households with income $100k - 125k:
Orland Park:
17.2% (171)
Illinois:
9.7% (26,669)
Number of households with income $125k - 150k:
Orland Park:
9.0% (89)
State:
7.3% (20,172)
Number of households with income $150k - 200k:
Orland Park:
15.8% (157)
State:
11.5% (31,711)
Number of households with income > $200k:
Orland Park:
32.4% (321)
State:
23.1% (63,411)
Aggregate household income in Orland Park in 2022: $156,456,550
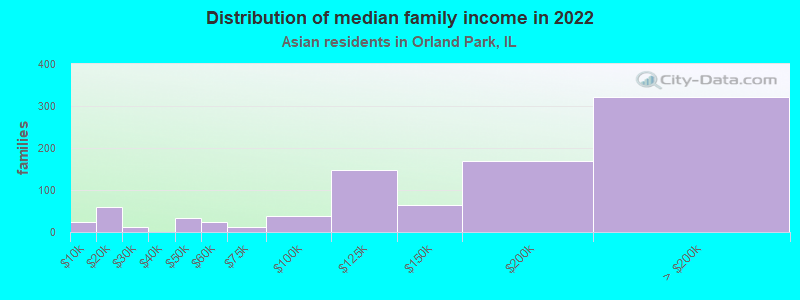
Median family income in Orland Park in 2022:
Orland Park:
$146,276
Illinois:
$124,630
Number of families with income < $10k:
Orland Park:
2.5% (23)
State:
2.0% (3,841)
Number of families with income $10k - 20k:
Orland Park:
6.6% (59)
State:
2.6% (5,077)
Number of families with income $20k - 30k:
Orland Park:
1.2% (11)
Illinois:
4.4% (8,618)
Number of families with income $40k - 50k:
Orland Park:
3.8% (34)
State:
3.9% (7,584)
Number of families with income $50k - 60k:
Orland Park:
2.6% (24)
State:
4.1% (7,974)
Number of families with income $60k - 75k:
Orland Park:
1.2% (11)
State:
7.0% (13,773)
Number of families with income $75k - 100k:
Orland Park:
4.4% (39)
Illinois:
12.3% (24,156)
Number of families with income $100k - 125k:
Orland Park:
16.4% (148)
State:
9.6% (18,808)
Number of families with income $125k - 150k:
Orland Park:
7.1% (64)
Illinois:
8.0% (15,639)
Number of families with income $150k - 200k:
Orland Park:
18.6% (168)
State:
13.9% (27,222)
Number of families with income > $200k:
Orland Park:
35.7% (322)
Illinois:
28.0% (54,999)
Median non-family income in Orland Park in 2022:
Orland Park:
$99,394
State:
$57,292
Change in median non-family income between 2000 and 2022:
Orland Park, Illinois:
+95.2%
State:
+78.3%
Median per capita income in Orland Park in 2022:
Orland Park:
$56,856
Illinois:
$52,977
Change in median per capita income between 2000 and 2022:
Orland Park, Illinois:
+58.1%
Illinois:
+119.5%
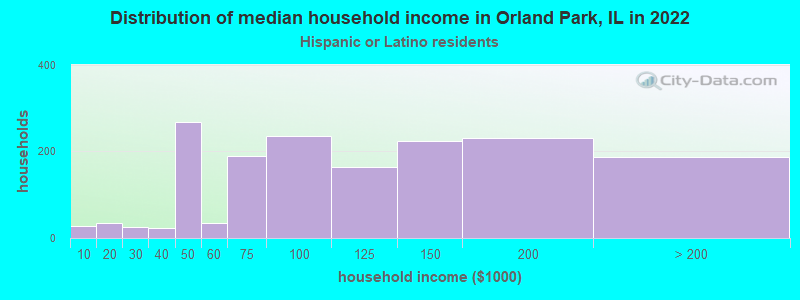
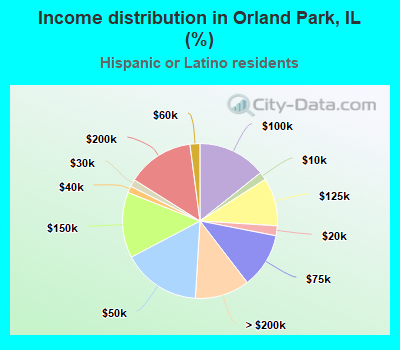
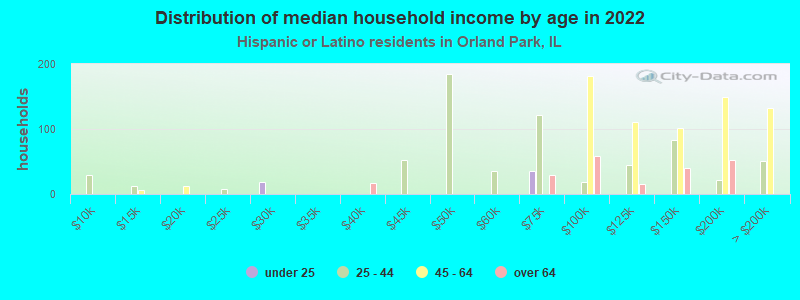
Income statistics for Hispanic or Latino residents
Median household income in Orland Park, IL in 2022:
Orland Park:
$100,827
State:
$72,139
Change in median household income between 2000 and 2022:
Orland Park, Illinois:
+34.8%
State:
+75.7%
Number of households with income < $10k:
Orland Park:
1.6% (27)
Illinois:
4.9% (33,145)
Number of households with income $10k - 20k:
Orland Park:
2.1% (34)
State:
5.4% (36,345)
Number of households with income $20k - 30k:
Orland Park:
1.5% (25)
State:
7.5% (50,677)
Number of households with income $30k - 40k:
Orland Park:
1.4% (23)
Illinois:
7.7% (52,008)
Number of households with income $40k - 50k:
Orland Park:
16.3% (268)
State:
8.1% (54,702)
Number of households with income $50k - 60k:
Orland Park:
2.1% (34)
State:
7.5% (51,062)
Number of households with income $60k - 75k:
Orland Park:
11.5% (189)
State:
11.3% (76,576)
Number of households with income $75k - 100k:
Orland Park:
14.3% (235)
Illinois:
15.5% (105,152)
Number of households with income $100k - 125k:
Orland Park:
10.0% (165)
Illinois:
11.5% (77,760)
Number of households with income $125k - 150k:
Orland Park:
13.7% (225)
Illinois:
7.3% (49,310)
Number of households with income $150k - 200k:
Orland Park:
14.0% (230)
Illinois:
7.6% (51,233)
Number of households with income > $200k:
Orland Park:
11.4% (187)
State:
5.9% (40,028)
Aggregate household income in Orland Park in 2022: $183,727,963
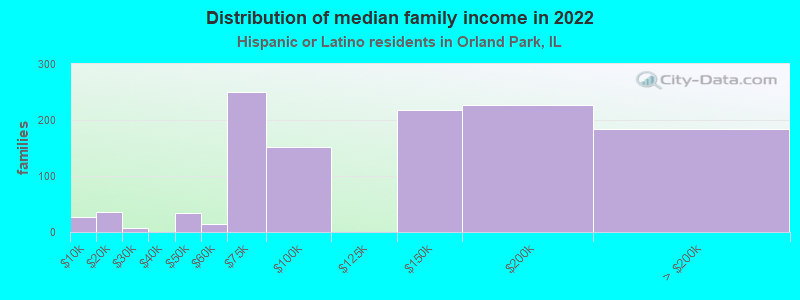
Median family income in Orland Park in 2022:
Orland Park:
$133,471
Illinois:
$76,467
Number of families with income < $10k:
Orland Park:
2.3% (26)
State:
3.8% (19,330)
Number of families with income $10k - 20k:
Orland Park:
3.0% (35)
Illinois:
3.8% (19,314)
Number of families with income $20k - 30k:
Orland Park:
0.7% (8)
State:
6.8% (34,467)
Number of families with income $40k - 50k:
Orland Park:
3.0% (34)
State:
7.7% (38,858)
Number of families with income $50k - 60k:
Orland Park:
1.3% (14)
Illinois:
7.6% (38,606)
Number of families with income $60k - 75k:
Orland Park:
21.8% (250)
State:
11.5% (58,164)
Number of families with income $75k - 100k:
Orland Park:
13.1% (151)
State:
16.0% (81,055)
Number of families with income $125k - 150k:
Orland Park:
18.9% (217)
State:
8.0% (40,271)
Number of families with income $150k - 200k:
Orland Park:
19.8% (227)
State:
8.6% (43,536)
Number of families with income > $200k:
Orland Park:
16.0% (184)
State:
6.6% (33,240)
Median non-family income in Orland Park in 2022:
Orland Park:
$49,372
State:
$45,965
Change in median non-family income between 2000 and 2022:
Orland Park, Illinois:
+17.9%
State:
+75.9%
Median per capita income in Orland Park in 2022:
Orland Park:
$30,970
State:
$26,551
Change in median per capita income between 2000 and 2022:
Orland Park, Illinois:
+51.7%
State:
+111.0%
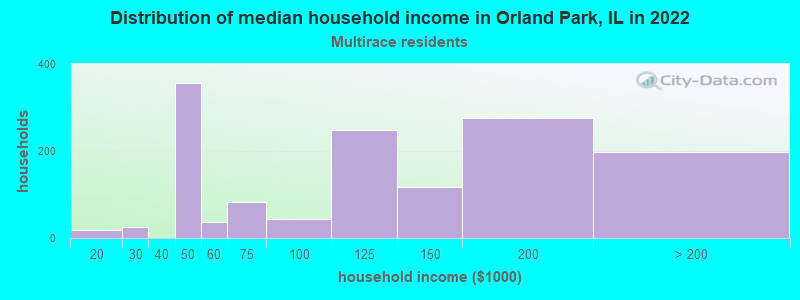
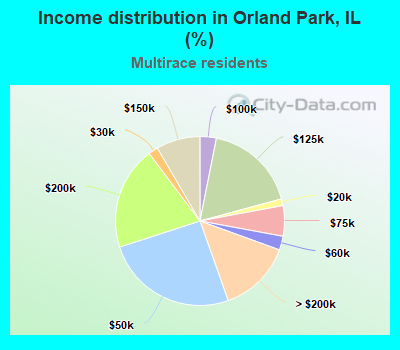
Income statistics for Multirace residents
Median household income in Orland Park, IL in 2022:
Orland Park:
$100,898
State:
$71,185
Change in median household income between 2000 and 2022:
Orland Park, Illinois:
+80.8%
Illinois:
+81.4%
Number of households with income < $10k:
Orland Park:
0.0% (0)
State:
5.3% (21,595)
Number of households with income $10k - 20k:
Orland Park:
1.3% (18)
State:
6.5% (26,720)
Number of households with income $20k - 30k:
Orland Park:
1.9% (26)
State:
8.0% (32,573)
Number of households with income $30k - 40k:
Orland Park:
0.0% (0)
State:
8.4% (34,383)
Number of households with income $40k - 50k:
Orland Park:
25.4% (357)
Illinois:
7.4% (30,234)
Number of households with income $50k - 60k:
Orland Park:
2.6% (37)
Illinois:
6.9% (28,432)
Number of households with income $60k - 75k:
Orland Park:
5.8% (82)
State:
10.2% (41,780)
Number of households with income $75k - 100k:
Orland Park:
3.1% (44)
Illinois:
13.0% (53,426)
Number of households with income $100k - 125k:
Orland Park:
17.7% (248)
Illinois:
10.5% (43,126)
Number of households with income $125k - 150k:
Orland Park:
8.4% (118)
Illinois:
7.6% (31,153)
Number of households with income $150k - 200k:
Orland Park:
19.7% (277)
State:
7.6% (30,946)
Number of households with income > $200k:
Orland Park:
14.0% (197)
Illinois:
8.6% (35,208)
Aggregate household income in Orland Park in 2022: $170,607,269
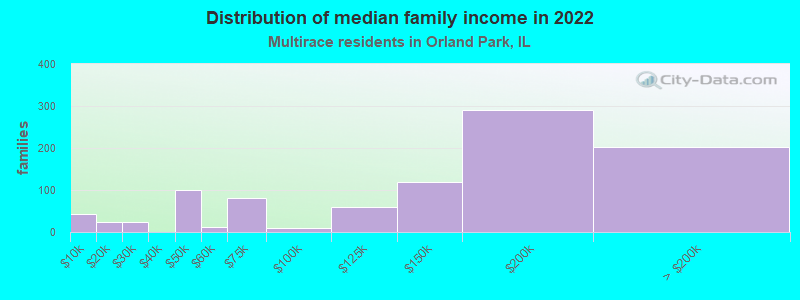
Median family income in Orland Park in 2022:
Orland Park:
$146,116
State:
$84,400
Number of families with income < $10k:
Orland Park:
4.6% (44)
State:
3.9% (10,812)
Number of families with income $10k - 20k:
Orland Park:
2.4% (23)
State:
4.2% (11,692)
Number of families with income $20k - 30k:
Orland Park:
2.4% (23)
State:
6.3% (17,559)
Number of families with income $40k - 50k:
Orland Park:
10.3% (99)
Illinois:
7.1% (19,595)
Number of families with income $50k - 60k:
Orland Park:
1.2% (12)
State:
6.9% (19,177)
Number of families with income $60k - 75k:
Orland Park:
8.3% (80)
Illinois:
9.3% (25,936)
Number of families with income $75k - 100k:
Orland Park:
1.0% (10)
State:
13.6% (37,857)
Number of families with income $100k - 125k:
Orland Park:
6.2% (59)
Illinois:
12.2% (33,852)
Number of families with income $125k - 150k:
Orland Park:
12.5% (120)
State:
9.0% (25,085)
Number of families with income $150k - 200k:
Orland Park:
30.3% (291)
State:
9.5% (26,306)
Number of families with income > $200k:
Orland Park:
21.0% (202)
State:
10.4% (28,926)
Median non-family income in Orland Park in 2022:
Orland Park:
$44,106
State:
$43,615
Change in median non-family income between 2000 and 2022:
Orland Park, Illinois:
+20.9%
State:
+77.3%
Median per capita income in Orland Park in 2022:
Orland Park:
$38,833
State:
$29,285
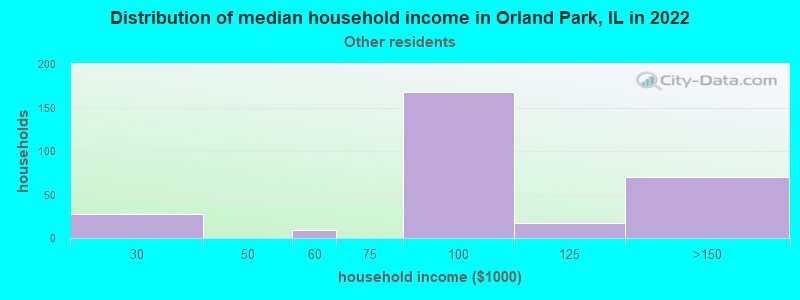
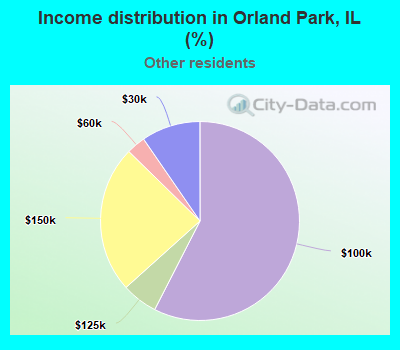
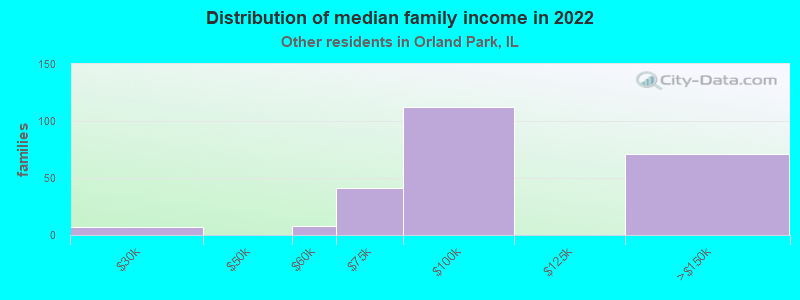
Income statistics for other residents
Median household income in Orland Park, IL in 2022:
Orland Park:
$102,348
Illinois:
$71,711
Number of households with income < $10k:
Orland Park:
0.0% (0)
Illinois:
5.7% (16,383)
Number of households with income $10k - 20k:
Orland Park:
0.0% (0)
State:
4.8% (13,886)
Number of households with income $20k - 30k:
Orland Park:
9.6% (28)
State:
7.0% (20,054)
Number of households with income $30k - 40k:
Orland Park:
0.0% (0)
Illinois:
7.0% (20,038)
Number of households with income $40k - 50k:
Orland Park:
0.0% (0)
State:
8.3% (23,759)
Number of households with income $50k - 60k:
Orland Park:
3.1% (9)
State:
7.8% (22,410)
Number of households with income $60k - 75k:
Orland Park:
0.0% (0)
Illinois:
12.0% (34,448)
Number of households with income $75k - 100k:
Orland Park:
57.5% (168)
Illinois:
16.2% (46,508)
Number of households with income $100k - 125k:
Orland Park:
5.8% (17)
Illinois:
12.5% (35,952)
Number of households with income $125k - 150k:
Orland Park:
24.0% (70)
Illinois:
6.9% (19,732)
Number of households with income $150k - 200k:
Orland Park:
0.0% (0)
State:
7.5% (21,422)
Number of households with income > $200k:
Orland Park:
0.0% (0)
State:
4.3% (12,194)
Aggregate household income in Orland Park in 2022: $28,329,474
Median family income in Orland Park in 2022:
Orland Park:
$95,973
Illinois:
$74,069
Number of families with income $20k - 30k:
Orland Park:
3.0% (7)
State:
6.8% (15,193)
Number of families with income $50k - 60k:
Orland Park:
3.4% (8)
State:
7.4% (16,614)
Number of families with income $60k - 75k:
Orland Park:
17.0% (41)
Illinois:
13.4% (30,011)
Number of families with income $75k - 100k:
Orland Park:
46.8% (112)
State:
17.2% (38,560)
Number of families with income $125k - 150k:
Orland Park:
29.8% (71)
Illinois:
7.3% (16,287)
Median non-family income in Orland Park in 2022:
Orland Park:
$85,549
State:
$44,975
Change in median non-family income between 2000 and 2022:
Orland Park, Illinois:
+145.2%
Illinois:
+80.6%
Median per capita income in Orland Park in 2022:
Orland Park:
$32,548
State:
$25,392
Change in median per capita income between 2000 and 2022:
Orland Park, Illinois:
+129.5%
State:
+117.4%
Discuss Orland Park, Illinois (IL) on our hugely popular Illinois forum.