Orwell, New York (NY) income map, earnings map, and wages data
The median household income in Orwell, NY in 2022 was $56,408, which was 41.0% less than the median annual income of $79,557 across the entire state of New York. Compared to the median income of $35,000 in 2000 this represents an increase of 38.0%. The per capita income in 2022 was $29,751, which means an increase of 48.7% compared to 2000 when it was $15,256.
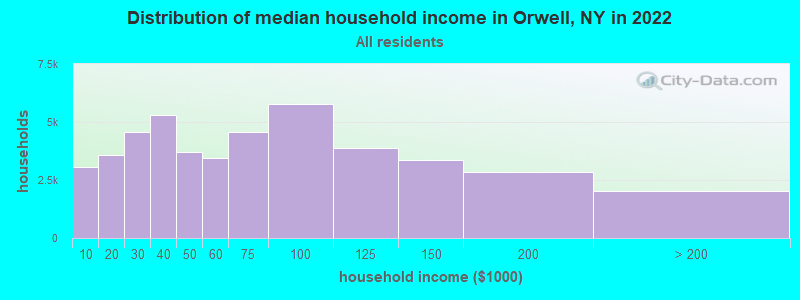
Income statistics for all residents
Median household income in Orwell, NY in 2022:| Orwell: | $56,409 |
| State: | $79,557 |
Change in median household income between 2000 and 2022:| Orwell, New York: | +61.2% |
| State: | +83.3% |
Number of households with income < $10k:| Orwell: | 6.6% (3,045) |
| State: | 6.8% (527,598) |
Number of households with income $10k - 20k:| Orwell: | 7.8% (3,578) |
| New York: | 7.4% (574,940) |
Number of households with income $20k - 30k:| Orwell: | 9.9% (4,559) |
| New York: | 6.7% (517,718) |
Number of households with income $30k - 40k:| Orwell: | 11.5% (5,288) |
| New York: | 6.5% (506,674) |
Number of households with income $40k - 50k:| Orwell: | 8.0% (3,695) |
| New York: | 6.1% (470,439) |
Number of households with income $50k - 60k:| Orwell: | 7.5% (3,439) |
| State: | 5.8% (454,042) |
Number of households with income $60k - 75k:| Orwell: | 9.9% (4,549) |
| State: | 8.5% (657,508) |
Number of households with income $75k - 100k:| Orwell: | 12.6% (5,781) |
| State: | 11.6% (899,824) |
Number of households with income $100k - 125k:| Orwell: | 8.4% (3,859) |
| State: | 9.3% (723,825) |
Number of households with income $125k - 150k:| Orwell: | 7.3% (3,381) |
| New York: | 7.1% (552,420) |
Number of households with income $150k - 200k:| Orwell: | 6.2% (2,861) |
| State: | 9.4% (727,051) |
Number of households with income > $200k:| Orwell: | 4.4% (2,005) |
| New York: | 15.0% (1,162,269) |
Aggregate household income in Orwell in 2022: $34,676,606
Median family income in Orwell in 2022:| Orwell: | $62,501 |
| New York: | $99,066 |
Median non-family income in Orwell in 2022:| Orwell: | $35,191 |
| State: | $50,181 |
Change in median non-family income between 2000 and 2022:| Orwell, New York: | +71.2% |
| New York: | +85.4% |
Median per capita income in Orwell in 2022:| Orwell: | $29,752 |
| State: | $47,421 |
Change in median per capita income between 2000 and 2022:| Orwell, New York: | +95.0% |
| State: | +102.7% |
Income statistics for White residents
Median household income in Orwell, NY in 2022:| Orwell: | $56,989 |
| New York: | $89,408 |
Change in median household income between 2000 and 2022:| Orwell, New York: | +61.7% |
| State: | +85.5% |
Number of households with income < $10k:| Orwell: | 6.3% (2,787) |
| State: | 4.8% (225,550) |
Number of households with income $10k - 20k:| Orwell: | 7.8% (3,446) |
| New York: | 6.1% (289,425) |
Number of households with income $20k - 30k:| Orwell: | 10.1% (4,448) |
| State: | 5.9% (280,254) |
Number of households with income $30k - 40k:| Orwell: | 11.5% (5,065) |
| New York: | 6.1% (288,263) |
Number of households with income $40k - 50k:| Orwell: | 7.8% (3,421) |
| State: | 5.9% (278,079) |
Number of households with income $50k - 60k:| Orwell: | 7.2% (3,167) |
| State: | 5.7% (267,554) |
Number of households with income $60k - 75k:| Orwell: | 10.0% (4,385) |
| State: | 8.4% (398,344) |
Number of households with income $75k - 100k:| Orwell: | 12.1% (5,324) |
| State: | 11.8% (554,841) |
Number of households with income $100k - 125k:| Orwell: | 8.6% (3,806) |
| State: | 10.0% (469,794) |
Number of households with income $125k - 150k:| Orwell: | 7.5% (3,303) |
| State: | 7.6% (360,467) |
Number of households with income $150k - 200k:| Orwell: | 6.5% (2,848) |
| State: | 10.1% (477,078) |
Number of households with income > $200k:| Orwell: | 4.6% (2,011) |
| New York: | 17.6% (829,233) |
Aggregate household income in Orwell in 2022: $34,222,097
Median family income in Orwell in 2022:| Orwell: | $64,324 |
| New York: | $115,170 |
Number of families with income < $10k:| Orwell: | 9.1% (22) |
| New York: | 2.5% (68,851) |
Number of families with income $10k - 20k:| Orwell: | 3.9% (10) |
| New York: | 3.0% (83,127) |
Number of families with income $20k - 30k:| Orwell: | 5.2% (13) |
| New York: | 3.5% (97,578) |
Number of families with income $30k - 40k:| Orwell: | 23.6% (59) |
| State: | 4.1% (114,108) |
Number of families with income $40k - 50k:| Orwell: | 6.4% (16) |
| New York: | 4.7% (130,902) |
Number of families with income $50k - 60k:| Orwell: | 5.2% (13) |
| New York: | 4.9% (135,118) |
Number of families with income $60k - 75k:| Orwell: | 10.9% (27) |
| State: | 7.8% (216,254) |
Number of families with income $75k - 100k:| Orwell: | 11.3% (28) |
| New York: | 12.4% (342,382) |
Number of families with income $100k - 125k:| Orwell: | 13.1% (33) |
| State: | 11.4% (314,917) |
Number of families with income $125k - 150k:| Orwell: | 11.3% (28) |
| State: | 9.4% (260,489) |
Median non-family income in Orwell in 2022:| Orwell: | $35,098 |
| State: | $54,783 |
Change in median non-family income between 2000 and 2022:| Orwell, New York: | +68.5% |
| State: | +87.9% |
Median per capita income in Orwell in 2022:| Orwell: | $30,914 |
| State: | $57,640 |
Change in median per capita income between 2000 and 2022:| Orwell, New York: | +101.3% |
| New York: | +111.6% |
Income statistics for Black or African American residents
Number of households with income < $10k:| Orwell: | 12.0% (78,764) |
| New York: | 12.0% (128,500) |
Number of households with income $10k - 20k:| Orwell: | 10.0% (65,919) |
| New York: | 10.0% (107,541) |
Number of households with income $20k - 30k:| Orwell: | 8.4% (55,284) |
| New York: | 8.4% (90,192) |
Number of households with income $30k - 40k:| Orwell: | 7.4% (48,779) |
| State: | 7.4% (79,579) |
Number of households with income $40k - 50k:| Orwell: | 6.8% (44,433) |
| New York: | 6.8% (72,491) |
Number of households with income $50k - 60k:| Orwell: | 6.7% (43,711) |
| State: | 6.7% (71,309) |
Number of households with income $60k - 75k:| Orwell: | 8.9% (58,261) |
| State: | 8.9% (95,050) |
Number of households with income $75k - 100k:| Orwell: | 11.5% (75,744) |
| State: | 11.5% (123,569) |
Number of households with income $100k - 125k:| Orwell: | 8.1% (53,104) |
| State: | 8.1% (86,632) |
Number of households with income $125k - 150k:| Orwell: | 6.0% (39,712) |
| State: | 6.0% (64,788) |
Number of households with income $150k - 200k:| Orwell: | 7.2% (46,981) |
| State: | 7.2% (76,644) |
Number of households with income > $200k:| Orwell: | 7.0% (46,013) |
| State: | 7.0% (75,062) |
Median per capita income in Orwell in 2022:| Orwell: | $14,153 |
| New York: | $31,947 |
Income statistics for Asian residents
Number of households with income < $10k:| Orwell: | 6.9% (11,253) |
| New York: | 6.9% (42,537) |
Number of households with income $10k - 20k:| Orwell: | 7.3% (11,840) |
| State: | 7.3% (44,745) |
Number of households with income $20k - 30k:| Orwell: | 6.2% (10,132) |
| New York: | 6.2% (38,249) |
Number of households with income $30k - 40k:| Orwell: | 5.5% (8,993) |
| State: | 5.5% (33,993) |
Number of households with income $40k - 50k:| Orwell: | 4.9% (7,890) |
| State: | 4.8% (29,795) |
Number of households with income $50k - 60k:| Orwell: | 5.2% (8,460) |
| New York: | 5.2% (32,100) |
Number of households with income $60k - 75k:| Orwell: | 7.3% (11,799) |
| New York: | 7.3% (44,615) |
Number of households with income $75k - 100k:| Orwell: | 10.9% (17,640) |
| State: | 10.8% (66,687) |
Number of households with income $100k - 125k:| Orwell: | 8.2% (13,265) |
| State: | 8.2% (50,233) |
Number of households with income $125k - 150k:| Orwell: | 7.2% (11,713) |
| New York: | 7.2% (44,299) |
Number of households with income $150k - 200k:| Orwell: | 10.4% (16,862) |
| State: | 10.4% (63,837) |
Number of households with income > $200k:| Orwell: | 20.1% (32,724) |
| State: | 20.1% (123,891) |
Median per capita income in Orwell in 2022:| Orwell: | $7,957 |
| State: | $46,726 |
Income statistics for Hispanic or Latino residents
Number of households with income < $10k:| Orwell: | 10.0% (134,280) |
| State: | 9.9% (127,185) |
Number of households with income $10k - 20k:| Orwell: | 10.7% (144,424) |
| New York: | 10.7% (136,699) |
Number of households with income $20k - 30k:| Orwell: | 8.1% (108,785) |
| State: | 8.1% (102,991) |
Number of households with income $30k - 40k:| Orwell: | 7.8% (105,598) |
| State: | 7.8% (100,149) |
Number of households with income $40k - 50k:| Orwell: | 6.9% (92,470) |
| State: | 6.9% (87,760) |
Number of households with income $50k - 60k:| Orwell: | 6.3% (85,454) |
| New York: | 6.3% (80,968) |
Number of households with income $60k - 75k:| Orwell: | 8.6% (116,633) |
| State: | 8.7% (110,631) |
Number of households with income $75k - 100k:| Orwell: | 11.2% (150,540) |
| State: | 11.2% (142,787) |
Number of households with income $100k - 125k:| Orwell: | 8.2% (110,440) |
| New York: | 8.2% (104,850) |
Number of households with income $125k - 150k:| Orwell: | 6.3% (84,636) |
| New York: | 6.3% (80,274) |
Number of households with income $150k - 200k:| Orwell: | 7.4% (100,181) |
| State: | 7.4% (95,117) |
Number of households with income > $200k:| Orwell: | 8.6% (115,431) |
| State: | 8.6% (109,514) |
Median per capita income in Orwell in 2022:| Orwell: | $29,310 |
| State: | $29,761 |
Change in median per capita income between 2000 and 2022:| Orwell, New York: | +8.6% |
| State: | +132.7% |
Income statistics for American Indian and Alaska Native residents
Median household income in Orwell, NY in 2022:| Orwell: | $50,001 |
| New York: | $63,208 |
Change in median household income between 2000 and 2022:| Orwell, New York: | +90.5% |
| New York: | +110.1% |
Number of households with income < $10k:| Orwell: | 8.6% (1,567) |
| State: | 8.6% (3,559) |
Number of households with income $10k - 20k:| Orwell: | 6.0% (1,089) |
| New York: | 5.9% (2,455) |
Number of households with income $20k - 30k:| Orwell: | 8.2% (1,488) |
| State: | 8.2% (3,393) |
Number of households with income $30k - 40k:| Orwell: | 11.9% (2,167) |
| State: | 11.9% (4,918) |
Number of households with income $40k - 50k:| Orwell: | 6.4% (1,164) |
| New York: | 6.5% (2,682) |
Number of households with income $50k - 60k:| Orwell: | 6.0% (1,095) |
| State: | 6.1% (2,516) |
Number of households with income $60k - 75k:| Orwell: | 9.9% (1,800) |
| State: | 10.0% (4,125) |
Number of households with income $75k - 100k:| Orwell: | 13.4% (2,435) |
| State: | 13.3% (5,517) |
Number of households with income $100k - 125k:| Orwell: | 8.4% (1,520) |
| State: | 8.4% (3,463) |
Number of households with income $125k - 150k:| Orwell: | 7.0% (1,278) |
| State: | 7.0% (2,887) |
Number of households with income $150k - 200k:| Orwell: | 10.0% (1,821) |
| State: | 9.9% (4,106) |
Number of households with income > $200k:| Orwell: | 4.2% (769) |
| State: | 4.2% (1,744) |
Aggregate household income in Orwell in 2022: $131,774
Median per capita income in Orwell in 2022:| Orwell: | $22,260 |
| State: | $25,837 |
Change in median per capita income between 2000 and 2022:| Orwell, New York: | +75.0% |
| State: | +99.6% |
Income statistics for Multirace residents
Median household income in Orwell, NY in 2022:| Orwell: | $3,808 |
| State: | $73,557 |
Change in median household income between 2000 and 2022:| Orwell, New York: | +52.4% |
| State: | +123.9% |
Number of households with income < $10k:| Orwell: | 8.9% (2,206) |
| New York: | 8.9% (57,924) |
Number of households with income $10k - 20k:| Orwell: | 8.7% (2,152) |
| State: | 8.7% (56,590) |
Number of households with income $20k - 30k:| Orwell: | 7.1% (1,759) |
| New York: | 7.1% (46,287) |
Number of households with income $30k - 40k:| Orwell: | 6.9% (1,713) |
| State: | 6.9% (45,132) |
Number of households with income $40k - 50k:| Orwell: | 5.8% (1,437) |
| New York: | 5.8% (37,946) |
Number of households with income $50k - 60k:| Orwell: | 5.6% (1,381) |
| State: | 5.6% (36,410) |
Number of households with income $60k - 75k:| Orwell: | 7.8% (1,926) |
| State: | 7.8% (50,819) |
Number of households with income $75k - 100k:| Orwell: | 11.7% (2,887) |
| State: | 11.7% (76,024) |
Number of households with income $100k - 125k:| Orwell: | 9.3% (2,297) |
| State: | 9.3% (60,635) |
Number of households with income $125k - 150k:| Orwell: | 6.2% (1,539) |
| State: | 6.2% (40,533) |
Number of households with income $150k - 200k:| Orwell: | 8.6% (2,141) |
| State: | 8.6% (56,409) |
Number of households with income > $200k:| Orwell: | 13.4% (3,324) |
| New York: | 13.4% (87,442) |
Median non-family income in Orwell in 2022:| Orwell: | $8,202 |
| State: | $46,403 |
Income statistics for other residents
Number of households with income < $10k:| Orwell: | 10.3% (84,651) |
| State: | 10.3% (69,252) |
Number of households with income $10k - 20k:| Orwell: | 11.0% (90,417) |
| State: | 11.0% (73,890) |
Number of households with income $20k - 30k:| Orwell: | 8.8% (72,374) |
| State: | 8.8% (59,096) |
Number of households with income $30k - 40k:| Orwell: | 8.1% (66,625) |
| State: | 8.1% (54,418) |
Number of households with income $40k - 50k:| Orwell: | 7.3% (59,947) |
| State: | 7.3% (49,042) |
Number of households with income $50k - 60k:| Orwell: | 6.5% (53,835) |
| New York: | 6.5% (43,945) |
Number of households with income $60k - 75k:| Orwell: | 9.5% (78,399) |
| State: | 9.5% (64,087) |
Number of households with income $75k - 100k:| Orwell: | 10.9% (89,319) |
| State: | 10.9% (73,094) |
Number of households with income $100k - 125k:| Orwell: | 7.9% (64,752) |
| State: | 7.9% (53,055) |
Number of households with income $125k - 150k:| Orwell: | 5.9% (48,289) |
| State: | 5.9% (39,446) |
Number of households with income $150k - 200k:| Orwell: | 7.2% (59,283) |
| State: | 7.2% (48,653) |
Number of households with income > $200k:| Orwell: | 6.6% (54,584) |
| New York: | 6.6% (44,703) |
Median per capita income in Orwell in 2022:| Orwell: | $30,289 |
| State: | $26,975 |
Change in median per capita income between 2000 and 2022:| Orwell, New York: | +12.2% |
| State: | +144.6% |