The median household income in Oxly, MO in 2022 was $33,428, which was 93.9% less than the median annual income of $64,811 across the entire state of Missouri. Compared to the median income of $22,761 in 2000 this represents an increase of 31.9%. The per capita income in 2022 was $27,674, which means an increase of 53.4% compared to 2000 when it was $12,889.
Whole page based on the data from 2000 / 2022 when the population of Oxly, Missouri was 200 / 49
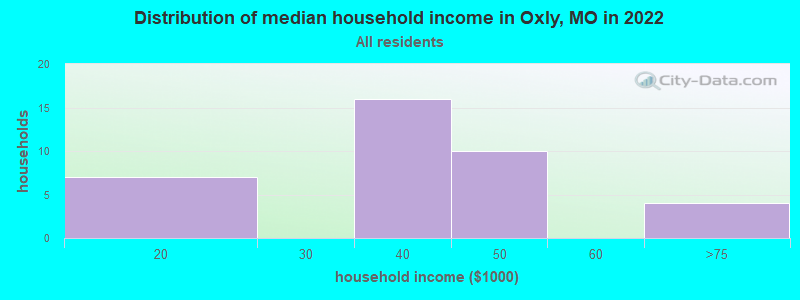
Income statistics for all residents
Median household income in Oxly, MO in 2022:
Oxly:
$33,428
Missouri:
$64,811
Change in median household income between 2000 and 2022:
Oxly, Missouri:
+46.9%
State:
+70.9%
Number of households with income < $10k:
Oxly:
0.0% (0)
State:
5.7% (144,208)
Number of households with income $10k - 20k:
Oxly:
18.9% (7)
State:
8.2% (205,541)
Number of households with income $20k - 30k:
Oxly:
0.0% (0)
State:
7.8% (197,162)
Number of households with income $30k - 40k:
Oxly:
43.2% (16)
State:
8.7% (220,088)
Number of households with income $40k - 50k:
Oxly:
27.0% (10)
State:
8.2% (206,651)
Number of households with income $50k - 60k:
Oxly:
0.0% (0)
State:
7.8% (196,521)
Number of households with income $60k - 75k:
Oxly:
10.8% (4)
State:
10.1% (255,043)
Number of households with income $75k - 100k:
Oxly:
0.0% (0)
State:
13.4% (337,210)
Number of households with income $100k - 125k:
Oxly:
0.0% (0)
State:
9.8% (247,187)
Number of households with income $125k - 150k:
Oxly:
0.0% (0)
State:
6.4% (160,260)
Number of households with income $150k - 200k:
Oxly:
0.0% (0)
Missouri:
6.9% (174,947)
Number of households with income > $200k:
Oxly:
0.0% (0)
Missouri:
7.0% (177,014)
Aggregate household income in Oxly in 2022: $1,294,135
Median non-family income in Oxly in 2022:
Oxly:
$33,534
Missouri:
$38,435
Median per capita income in Oxly in 2022:
Oxly:
$27,675
State:
$36,640
Change in median per capita income between 2000 and 2022:
Oxly, Missouri:
+114.7%
Missouri:
+83.8%
Income statistics for White residents
Median household income in Oxly, MO in 2022:
Oxly:
$33,621
State:
$68,771
Change in median household income between 2000 and 2022:
Oxly, Missouri:
+45.8%
State:
+73.5%
Number of households with income < $10k:
Oxly:
0.0% (0)
State:
4.9% (98,067)
Number of households with income $10k - 20k:
Oxly:
19.4% (7)
State:
7.3% (146,436)
Number of households with income $20k - 30k:
Oxly:
0.0% (0)
Missouri:
7.6% (153,201)
Number of households with income $30k - 40k:
Oxly:
44.4% (16)
State:
8.4% (169,042)
Number of households with income $40k - 50k:
Oxly:
25.0% (9)
State:
8.0% (160,724)
Number of households with income $50k - 60k:
Oxly:
0.0% (0)
State:
7.7% (155,924)
Number of households with income $60k - 75k:
Oxly:
11.1% (4)
State:
10.2% (205,080)
Number of households with income $75k - 100k:
Oxly:
0.0% (0)
State:
14.1% (283,507)
Number of households with income $100k - 125k:
Oxly:
0.0% (0)
Missouri:
10.2% (205,898)
Number of households with income $125k - 150k:
Oxly:
0.0% (0)
Missouri:
6.7% (135,287)
Number of households with income $150k - 200k:
Oxly:
0.0% (0)
State:
7.4% (148,450)
Number of households with income > $200k:
Oxly:
0.0% (0)
Missouri:
7.6% (153,213)
Aggregate household income in Oxly in 2022: $1,265,269
Median non-family income in Oxly in 2022:
Oxly:
$33,512
State:
$40,207
Median per capita income in Oxly in 2022:
Oxly:
$27,716
State:
$39,160
Change in median per capita income between 2000 and 2022:
Oxly, Missouri:
+114.9%
Missouri:
+86.9%
Discuss Oxly, Missouri (MO) on our hugely popular Missouri forum.