The median household income in Payne Springs, TX in 2022 was $46,413, which was 55.7% less than the median annual income of $72,284 across the entire state of Texas. Compared to the median income of $33,269 in 2000 this represents an increase of 28.3%. The per capita income in 2022 was $29,431, which means an increase of 47.5% compared to 2000 when it was $15,451.
Whole page based on the data from 2000 / 2022 when the population of Payne Springs, Texas was 683 / 627
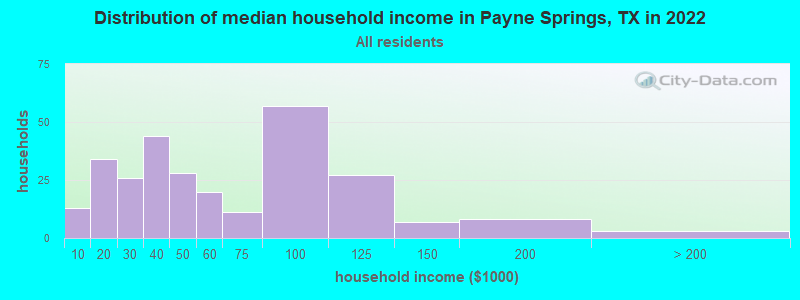
Income statistics for all residents
Median household income in Payne Springs, TX in 2022:
Payne Springs:
$46,414
State:
$72,284
Change in median household income between 2000 and 2022:
Payne Springs, Texas:
+39.5%
State:
+81.0%
Number of households with income < $10k:
Payne Springs:
4.7% (13)
State:
5.5% (611,011)
Number of households with income $10k - 20k:
Payne Springs:
12.2% (34)
Texas:
6.7% (743,157)
Number of households with income $20k - 30k:
Payne Springs:
9.4% (26)
Texas:
7.2% (803,381)
Number of households with income $30k - 40k:
Payne Springs:
15.8% (44)
Texas:
7.8% (866,080)
Number of households with income $40k - 50k:
Payne Springs:
10.1% (28)
Texas:
7.3% (810,440)
Number of households with income $50k - 60k:
Payne Springs:
7.2% (20)
State:
7.2% (799,783)
Number of households with income $60k - 75k:
Payne Springs:
4.0% (11)
Texas:
9.9% (1,095,384)
Number of households with income $75k - 100k:
Payne Springs:
20.5% (57)
State:
12.8% (1,419,057)
Number of households with income $100k - 125k:
Payne Springs:
9.7% (27)
State:
9.5% (1,054,577)
Number of households with income $125k - 150k:
Payne Springs:
2.5% (7)
State:
6.7% (741,518)
Number of households with income $150k - 200k:
Payne Springs:
2.9% (8)
Texas:
8.7% (961,776)
Number of households with income > $200k:
Payne Springs:
1.1% (3)
State:
10.7% (1,181,544)
Aggregate household income in Payne Springs in 2022: $17,459,554
Median family income in Payne Springs in 2022:
Payne Springs:
$57,979
State:
$86,267
Number of families with income < $10k:
Payne Springs:
1.8% (3)
State:
4.0% (297,884)
Number of families with income $10k - 20k:
Payne Springs:
13.1% (23)
State:
4.3% (324,514)
Number of families with income $20k - 30k:
Payne Springs:
2.4% (4)
Texas:
5.8% (430,949)
Number of families with income $30k - 40k:
Payne Springs:
10.7% (19)
State:
6.6% (493,535)
Number of families with income $40k - 50k:
Payne Springs:
13.7% (24)
State:
6.7% (499,663)
Number of families with income $50k - 60k:
Payne Springs:
7.0% (12)
State:
6.6% (492,203)
Number of families with income $60k - 75k:
Payne Springs:
8.9% (16)
State:
9.5% (710,229)
Number of families with income $75k - 100k:
Payne Springs:
22.4% (39)
State:
13.6% (1,015,480)
Number of families with income $100k - 125k:
Payne Springs:
13.0% (23)
State:
10.7% (797,961)
Number of families with income $125k - 150k:
Payne Springs:
3.1% (5)
State:
8.1% (602,985)
Number of families with income $150k - 200k:
Payne Springs:
3.8% (7)
State:
10.7% (804,459)
Median non-family income in Payne Springs in 2022:
Payne Springs:
$38,290
State:
$45,999
Change in median non-family income between 2000 and 2022:
Payne Springs, Texas:
+63.4%
State:
+79.5%
Median per capita income in Payne Springs in 2022:
Payne Springs:
$29,432
Texas:
$38,123
Change in median per capita income between 2000 and 2022:
Payne Springs, Texas:
+90.5%
State:
+94.3%
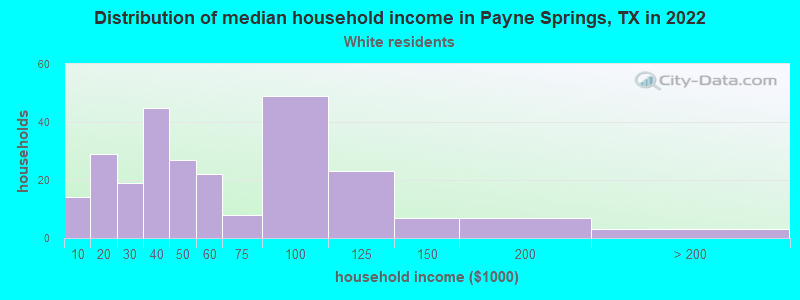
Income statistics for White residents
Median household income in Payne Springs, TX in 2022:
Payne Springs:
$45,120
Texas:
$82,032
Change in median household income between 2000 and 2022:
Payne Springs, Texas:
+35.6%
State:
+91.0%
Number of households with income < $10k:
Payne Springs:
5.5% (14)
State:
4.7% (273,716)
Number of households with income $10k - 20k:
Payne Springs:
11.5% (29)
State:
5.5% (322,702)
Number of households with income $20k - 30k:
Payne Springs:
7.5% (19)
Texas:
6.2% (363,947)
Number of households with income $30k - 40k:
Payne Springs:
17.8% (45)
State:
6.8% (399,275)
Number of households with income $40k - 50k:
Payne Springs:
10.7% (27)
State:
6.5% (383,417)
Number of households with income $50k - 60k:
Payne Springs:
8.7% (22)
State:
6.6% (388,535)
Number of households with income $60k - 75k:
Payne Springs:
3.2% (8)
State:
9.7% (566,295)
Number of households with income $75k - 100k:
Payne Springs:
19.4% (49)
Texas:
13.0% (760,276)
Number of households with income $100k - 125k:
Payne Springs:
9.1% (23)
State:
10.2% (597,596)
Number of households with income $125k - 150k:
Payne Springs:
2.8% (7)
State:
7.4% (436,830)
Number of households with income $150k - 200k:
Payne Springs:
2.8% (7)
Texas:
9.9% (583,067)
Number of households with income > $200k:
Payne Springs:
1.2% (3)
State:
13.5% (792,647)
Aggregate household income in Payne Springs in 2022: $15,946,391
Median family income in Payne Springs in 2022:
Payne Springs:
$54,786
State:
$101,788
Number of families with income < $10k:
Payne Springs:
2.3% (4)
State:
2.8% (108,142)
Number of families with income $10k - 20k:
Payne Springs:
15.5% (24)
State:
2.9% (113,421)
Number of families with income $20k - 30k:
Payne Springs:
2.6% (4)
State:
4.1% (157,688)
Number of families with income $30k - 40k:
Payne Springs:
12.0% (18)
State:
5.2% (198,847)
Number of families with income $40k - 50k:
Payne Springs:
12.3% (19)
State:
5.6% (216,490)
Number of families with income $50k - 60k:
Payne Springs:
8.5% (13)
State:
5.7% (220,689)
Number of families with income $60k - 75k:
Payne Springs:
4.1% (6)
Texas:
9.0% (346,106)
Number of families with income $75k - 100k:
Payne Springs:
19.8% (31)
State:
13.7% (527,363)
Number of families with income $100k - 125k:
Payne Springs:
15.6% (24)
State:
11.6% (448,411)
Number of families with income $125k - 150k:
Payne Springs:
3.3% (5)
State:
9.2% (355,798)
Number of families with income $150k - 200k:
Payne Springs:
4.0% (6)
State:
12.5% (480,185)
Median non-family income in Payne Springs in 2022:
Payne Springs:
$38,026
State:
$50,587
Change in median non-family income between 2000 and 2022:
Payne Springs, Texas:
+62.2%
Texas:
+87.7%
Median per capita income in Payne Springs in 2022:
Payne Springs:
$30,258
State:
$47,740
Change in median per capita income between 2000 and 2022:
Payne Springs, Texas:
+97.4%
Texas:
+114.3%
Income statistics for Asian residents
Median per capita income in Payne Springs in 2022:
Payne Springs:
$19,937
Texas:
$48,626
Income statistics for Hispanic or Latino residents
Aggregate household income in Payne Springs in 2022: $485,677
Median per capita income in Payne Springs in 2022:
Payne Springs:
$22,910
Texas:
$24,862
Income statistics for American Indian and Alaska Native residents
Median per capita income in Payne Springs in 2022:
Payne Springs:
$51,687
State:
$28,166
Change in median per capita income between 2000 and 2022:
Payne Springs, Texas:
+95.5%
Texas:
+77.2%
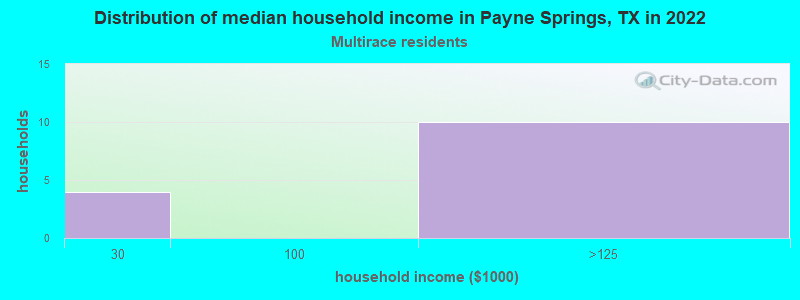
Income statistics for Multirace residents
Number of households with income < $10k:
Payne Springs:
0.0% (0)
State:
5.5% (122,324)
Number of households with income $10k - 20k:
Payne Springs:
0.0% (0)
State:
8.2% (182,232)
Number of households with income $20k - 30k:
Payne Springs:
28.6% (4)
Texas:
8.5% (189,456)
Number of households with income $30k - 40k:
Payne Springs:
0.0% (0)
State:
8.9% (197,499)
Number of households with income $40k - 50k:
Payne Springs:
0.0% (0)
Texas:
8.7% (191,735)
Number of households with income $50k - 60k:
Payne Springs:
0.0% (0)
State:
8.0% (177,535)
Number of households with income $60k - 75k:
Payne Springs:
0.0% (0)
State:
10.5% (232,479)
Number of households with income $75k - 100k:
Payne Springs:
0.0% (0)
Texas:
13.1% (290,448)
Number of households with income $100k - 125k:
Payne Springs:
71.4% (10)
Texas:
8.6% (191,595)
Number of households with income $125k - 150k:
Payne Springs:
0.0% (0)
State:
6.0% (133,361)
Number of households with income $150k - 200k:
Payne Springs:
0.0% (0)
State:
7.2% (159,195)
Number of households with income > $200k:
Payne Springs:
0.0% (0)
State:
6.7% (148,064)
Aggregate household income in Payne Springs in 2022: $6,980,957
Median per capita income in Payne Springs in 2022:
Payne Springs:
$33,792
Texas:
$26,785
Discuss Payne Springs, Texas (TX) on our hugely popular Texas forum.