Peninsula, Washington (WA) income map, earnings map, and wages data
The median household income in Peninsula, WA in 2022 was $57,655, which was 58.4% less than the median annual income of $91,306 across the entire state of Washington. Compared to the median income of $29,438 in 2000 this represents an increase of 48.9%. The per capita income in 2022 was $39,998, which means an increase of 53.6% compared to 2000 when it was $18,540.
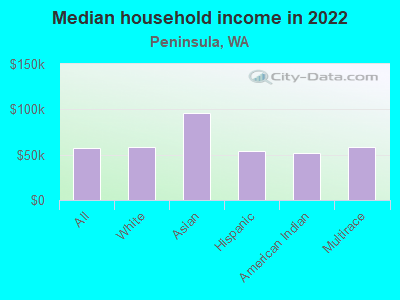
Income statistics for all residents
Median household income in Peninsula, WA in 2022:| Peninsula: | $57,656 |
| State: | $91,306 |
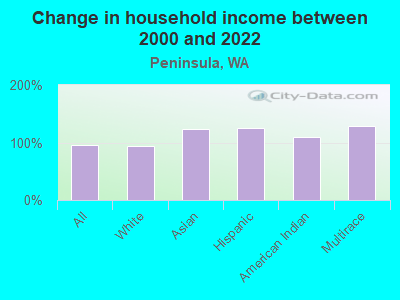
Change in median household income between 2000 and 2022:| Peninsula, Washington: | +95.9% |
| State: | +99.5% |
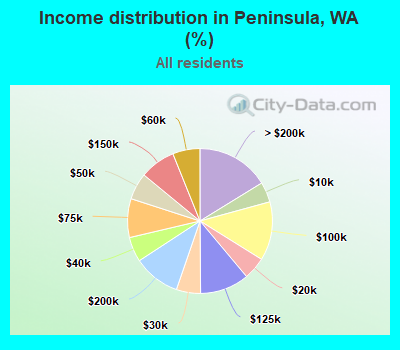
Number of households with income < $10k:| Peninsula: | 4.5% (44,795) |
| State: | 4.5% (139,331) |
Number of households with income $10k - 20k:| Peninsula: | 5.0% (49,682) |
| State: | 5.0% (154,508) |
Number of households with income $20k - 30k:| Peninsula: | 5.4% (53,556) |
| Washington: | 5.4% (166,555) |
Number of households with income $30k - 40k:| Peninsula: | 5.5% (54,765) |
| State: | 5.5% (170,324) |
Number of households with income $40k - 50k:| Peninsula: | 6.0% (59,147) |
| State: | 6.0% (183,941) |
Number of households with income $50k - 60k:| Peninsula: | 6.1% (60,251) |
| Washington: | 6.1% (187,395) |
Number of households with income $60k - 75k:| Peninsula: | 8.7% (85,773) |
| State: | 8.7% (266,771) |
Number of households with income $75k - 100k:| Peninsula: | 13.1% (130,113) |
| Washington: | 13.1% (404,672) |
Number of households with income $100k - 125k:| Peninsula: | 11.0% (108,648) |
| Washington: | 11.0% (337,911) |
Number of households with income $125k - 150k:| Peninsula: | 8.0% (78,754) |
| State: | 8.0% (244,934) |
Number of households with income $150k - 200k:| Peninsula: | 10.5% (104,115) |
| State: | 10.5% (323,812) |
Number of households with income > $200k:| Peninsula: | 16.2% (160,678) |
| State: | 16.2% (499,799) |
Aggregate household income in Peninsula in 2022: $14,660,453,459
Median family income in Peninsula in 2022:| Peninsula: | $75,296 |
| State: | $109,192 |
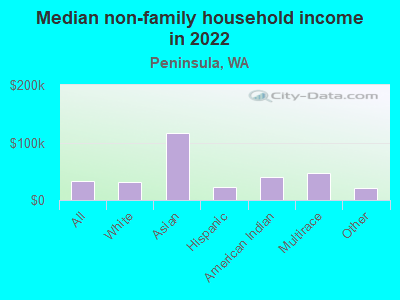
Median non-family income in Peninsula in 2022:| Peninsula: | $32,183 |
| State: | $57,299 |
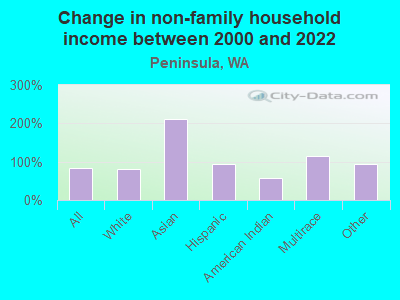
Change in median non-family income between 2000 and 2022:| Peninsula, Washington: | +84.3% |
| Washington: | +94.9% |
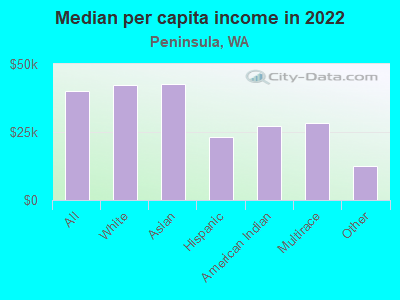
Median per capita income in Peninsula in 2022:| Peninsula: | $39,999 |
| State: | $50,764 |
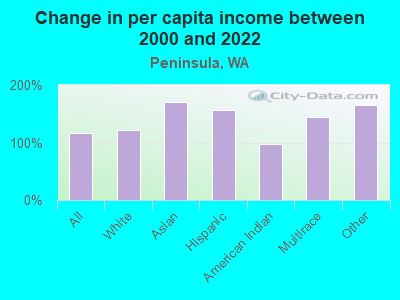
Change in median per capita income between 2000 and 2022:| Peninsula, Washington: | +115.7% |
| State: | +121.0% |
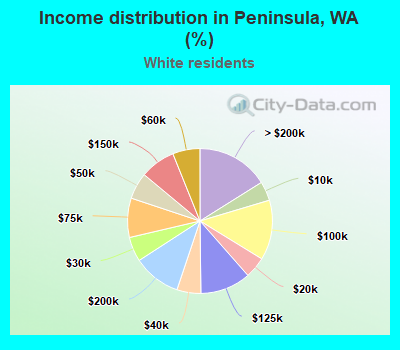
Income statistics for White residents
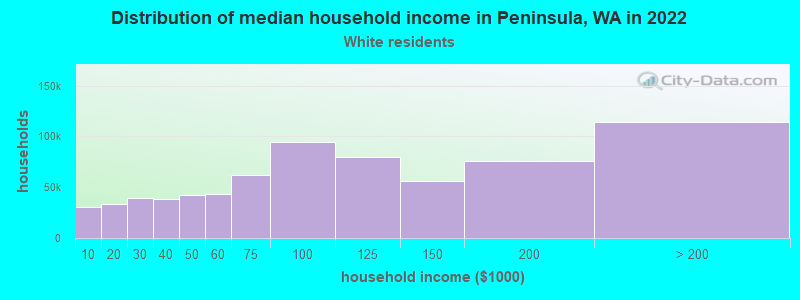
Median household income in Peninsula, WA in 2022:| Peninsula: | $58,026 |
| Washington: | $91,916 |
Change in median household income between 2000 and 2022:| Peninsula, Washington: | +94.3% |
| State: | +95.4% |
Number of households with income < $10k:| Peninsula: | 4.3% (30,409) |
| Washington: | 4.3% (95,850) |
Number of households with income $10k - 20k:| Peninsula: | 4.8% (33,775) |
| Washington: | 4.8% (106,421) |
Number of households with income $20k - 30k:| Peninsula: | 5.5% (38,992) |
| Washington: | 5.5% (122,860) |
Number of households with income $30k - 40k:| Peninsula: | 5.4% (37,961) |
| State: | 5.4% (119,627) |
Number of households with income $40k - 50k:| Peninsula: | 5.9% (41,982) |
| State: | 5.9% (132,276) |
Number of households with income $50k - 60k:| Peninsula: | 6.1% (43,218) |
| Washington: | 6.1% (136,212) |
Number of households with income $60k - 75k:| Peninsula: | 8.8% (62,218) |
| State: | 8.8% (196,086) |
Number of households with income $75k - 100k:| Peninsula: | 13.4% (94,943) |
| State: | 13.4% (299,192) |
Number of households with income $100k - 125k:| Peninsula: | 11.3% (80,033) |
| Washington: | 11.3% (252,209) |
Number of households with income $125k - 150k:| Peninsula: | 7.9% (55,842) |
| State: | 7.9% (175,962) |
Number of households with income $150k - 200k:| Peninsula: | 10.7% (75,896) |
| State: | 10.7% (239,156) |
Number of households with income > $200k:| Peninsula: | 16.1% (114,177) |
| State: | 16.1% (359,917) |
Aggregate household income in Peninsula in 2022: $10,280,249,697
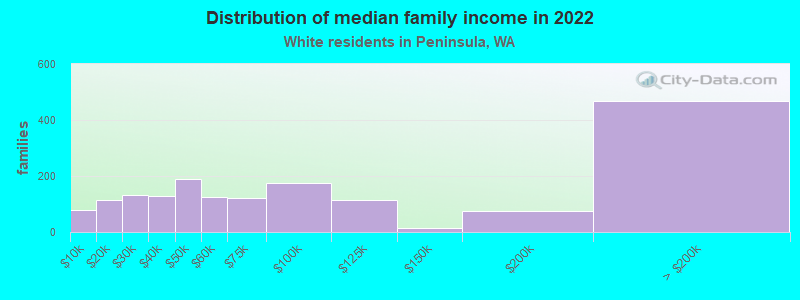
Median family income in Peninsula in 2022:| Peninsula: | $77,845 |
| State: | $112,511 |
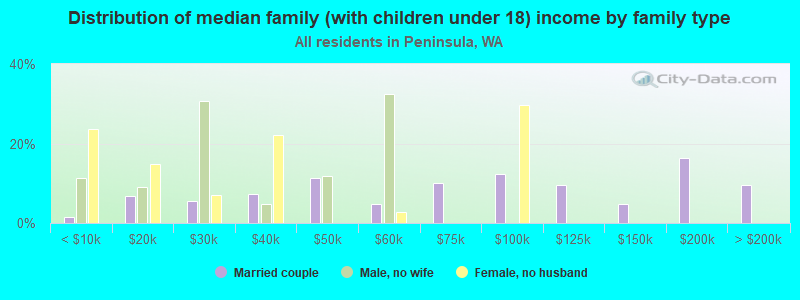
Number of families with income < $10k:| Peninsula: | 4.5% (77) |
| State: | 2.4% (33,676) |
Number of families with income $10k - 20k:| Peninsula: | 6.6% (115) |
| State: | 2.0% (28,228) |
Number of families with income $20k - 30k:| Peninsula: | 7.6% (131) |
| State: | 2.9% (39,288) |
Number of families with income $30k - 40k:| Peninsula: | 7.4% (127) |
| State: | 3.6% (50,190) |
Number of families with income $40k - 50k:| Peninsula: | 11.0% (191) |
| Washington: | 4.6% (63,009) |
Number of families with income $50k - 60k:| Peninsula: | 7.2% (125) |
| Washington: | 5.0% (69,270) |
Number of families with income $60k - 75k:| Peninsula: | 6.9% (120) |
| State: | 8.2% (112,369) |
Number of families with income $75k - 100k:| Peninsula: | 10.2% (176) |
| State: | 14.1% (194,214) |
Number of families with income $100k - 125k:| Peninsula: | 6.6% (114) |
| State: | 13.2% (182,184) |
Number of families with income $125k - 150k:| Peninsula: | 0.8% (13) |
| State: | 9.5% (130,928) |
Number of families with income $150k - 200k:| Peninsula: | 4.3% (75) |
| State: | 13.7% (188,621) |
Number of families with income > $200k:| Peninsula: | 27.0% (468) |
| State: | 20.8% (285,982) |
Median non-family income in Peninsula in 2022:| Peninsula: | $31,752 |
| State: | $56,103 |
Change in median non-family income between 2000 and 2022:| Peninsula, Washington: | +82.0% |
| State: | +87.7% |
Median per capita income in Peninsula in 2022:| Peninsula: | $42,256 |
| State: | $55,212 |
Change in median per capita income between 2000 and 2022:| Peninsula, Washington: | +121.9% |
| State: | +123.8% |
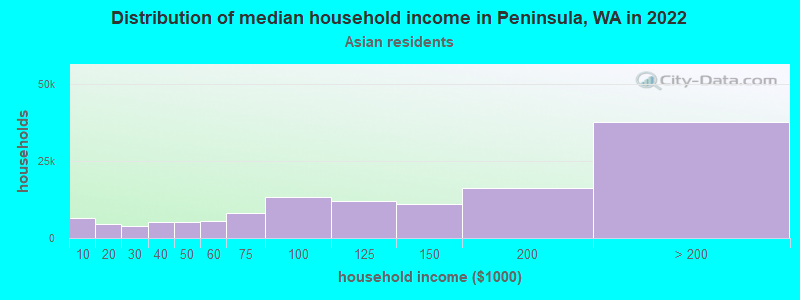
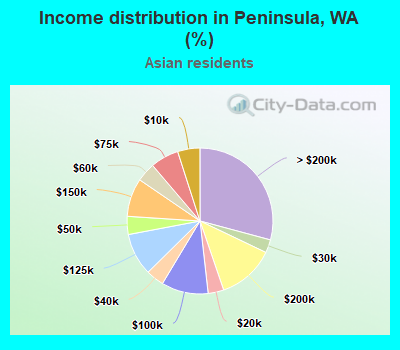
Income statistics for Asian residents
Median household income in Peninsula, WA in 2022:| Peninsula: | $96,025 |
| State: | $125,692 |
Change in median household income between 2000 and 2022:| Peninsula, Washington: | +123.5% |
| State: | +164.5% |
Number of households with income < $10k:| Peninsula: | 4.9% (6,367) |
| State: | 4.9% (14,099) |
Number of households with income $10k - 20k:| Peninsula: | 3.5% (4,468) |
| State: | 3.5% (9,873) |
Number of households with income $20k - 30k:| Peninsula: | 2.9% (3,769) |
| Washington: | 2.9% (8,352) |
Number of households with income $30k - 40k:| Peninsula: | 4.0% (5,162) |
| State: | 4.0% (11,415) |
Number of households with income $40k - 50k:| Peninsula: | 4.0% (5,167) |
| State: | 4.0% (11,421) |
Number of households with income $50k - 60k:| Peninsula: | 4.2% (5,473) |
| State: | 4.2% (12,100) |
Number of households with income $60k - 75k:| Peninsula: | 6.3% (8,095) |
| Washington: | 6.3% (17,903) |
Number of households with income $75k - 100k:| Peninsula: | 10.4% (13,412) |
| Washington: | 10.4% (29,663) |
Number of households with income $100k - 125k:| Peninsula: | 9.4% (12,136) |
| State: | 9.4% (26,839) |
Number of households with income $125k - 150k:| Peninsula: | 8.5% (10,942) |
| Washington: | 8.5% (24,200) |
Number of households with income $150k - 200k:| Peninsula: | 12.6% (16,299) |
| State: | 12.6% (35,976) |
Number of households with income > $200k:| Peninsula: | 29.2% (37,612) |
| State: | 29.2% (83,109) |
Aggregate household income in Peninsula in 2022: $20,182,786
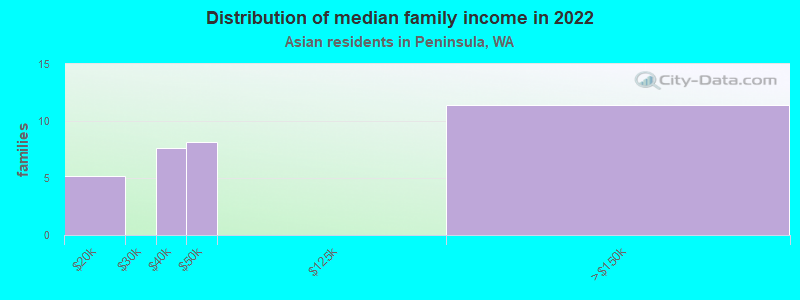
Median family income in Peninsula in 2022:| Peninsula: | $78,880 |
| Washington: | $143,595 |
Number of families with income $10k - 20k:| Peninsula: | 15.9% (5) |
| Washington: | 2.2% (4,150) |
Number of families with income $30k - 40k:| Peninsula: | 23.5% (8) |
| State: | 3.1% (5,734) |
Number of families with income $40k - 50k:| Peninsula: | 25.2% (8) |
| Washington: | 3.6% (6,707) |
Number of families with income $125k - 150k:| Peninsula: | 35.4% (11) |
| Washington: | 8.4% (15,602) |
Median non-family income in Peninsula in 2022:| Peninsula: | $116,646 |
| State: | $84,971 |
Median per capita income in Peninsula in 2022:| Peninsula: | $42,646 |
| Washington: | $67,666 |
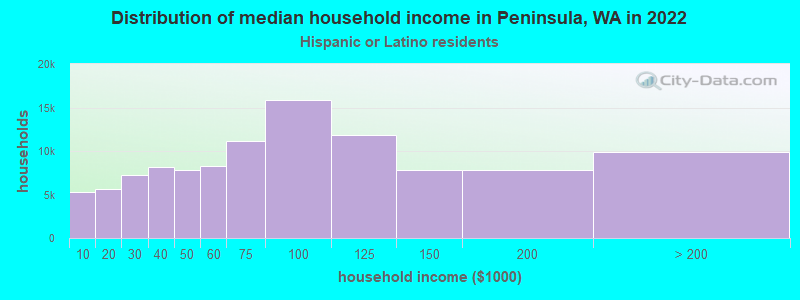
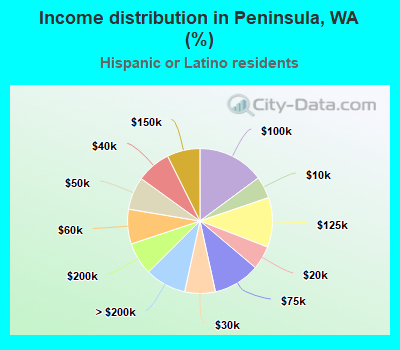
Income statistics for Hispanic or Latino residents
Median household income in Peninsula, WA in 2022:| Peninsula: | $53,705 |
| State: | $74,770 |
Change in median household income between 2000 and 2022:| Peninsula, Washington: | +124.9% |
| Washington: | +128.3% |
Number of households with income < $10k:| Peninsula: | 4.9% (5,232) |
| Washington: | 4.9% (14,456) |
Number of households with income $10k - 20k:| Peninsula: | 5.3% (5,633) |
| Washington: | 5.3% (15,449) |
Number of households with income $20k - 30k:| Peninsula: | 6.8% (7,287) |
| State: | 6.8% (20,016) |
Number of households with income $30k - 40k:| Peninsula: | 7.7% (8,215) |
| State: | 7.7% (22,548) |
Number of households with income $40k - 50k:| Peninsula: | 7.3% (7,833) |
| Washington: | 7.3% (21,450) |
Number of households with income $50k - 60k:| Peninsula: | 7.7% (8,273) |
| Washington: | 7.7% (22,744) |
Number of households with income $60k - 75k:| Peninsula: | 10.4% (11,154) |
| Washington: | 10.5% (30,737) |
Number of households with income $75k - 100k:| Peninsula: | 14.9% (15,901) |
| State: | 14.9% (43,843) |
Number of households with income $100k - 125k:| Peninsula: | 11.1% (11,860) |
| Washington: | 11.1% (32,554) |
Number of households with income $125k - 150k:| Peninsula: | 7.4% (7,856) |
| State: | 7.4% (21,624) |
Number of households with income $150k - 200k:| Peninsula: | 7.3% (7,770) |
| Washington: | 7.3% (21,360) |
Number of households with income > $200k:| Peninsula: | 9.2% (9,837) |
| State: | 9.2% (27,055) |
Aggregate household income in Peninsula in 2022: $23,981,676
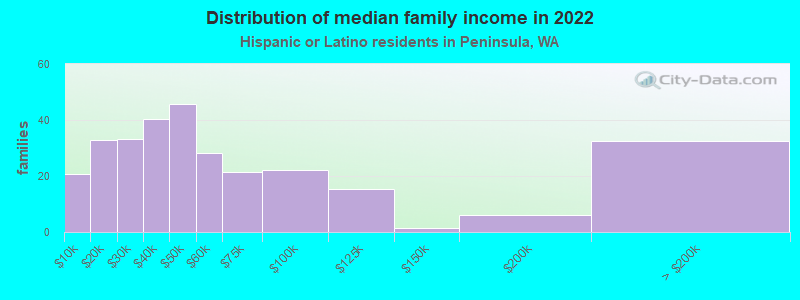
Median family income in Peninsula in 2022:| Peninsula: | $58,610 |
| State: | $76,866 |
Number of families with income < $10k:| Peninsula: | 6.9% (21) |
| State: | 4.4% (9,443) |
Number of families with income $10k - 20k:| Peninsula: | 11.0% (33) |
| State: | 3.5% (7,524) |
Number of families with income $20k - 30k:| Peninsula: | 11.1% (33) |
| State: | 5.6% (12,052) |
Number of families with income $30k - 40k:| Peninsula: | 13.4% (40) |
| Washington: | 8.3% (17,803) |
Number of families with income $40k - 50k:| Peninsula: | 15.3% (46) |
| State: | 7.7% (16,361) |
Number of families with income $50k - 60k:| Peninsula: | 9.4% (28) |
| State: | 7.9% (16,852) |
Number of families with income $60k - 75k:| Peninsula: | 7.2% (21) |
| Washington: | 11.4% (24,342) |
Number of families with income $75k - 100k:| Peninsula: | 7.4% (22) |
| Washington: | 14.4% (30,698) |
Number of families with income $100k - 125k:| Peninsula: | 5.1% (15) |
| State: | 11.4% (24,331) |
Number of families with income $125k - 150k:| Peninsula: | 0.5% (1) |
| Washington: | 7.5% (16,099) |
Number of families with income $150k - 200k:| Peninsula: | 2.0% (6) |
| State: | 8.2% (17,551) |
Number of families with income > $200k:| Peninsula: | 10.8% (33) |
| Washington: | 9.7% (20,653) |
Median non-family income in Peninsula in 2022:| Peninsula: | $22,226 |
| State: | $54,173 |
Change in median non-family income between 2000 and 2022:| Peninsula, Washington: | +93.3% |
| State: | +105.8% |
Median per capita income in Peninsula in 2022:| Peninsula: | $23,194 |
| State: | $28,252 |
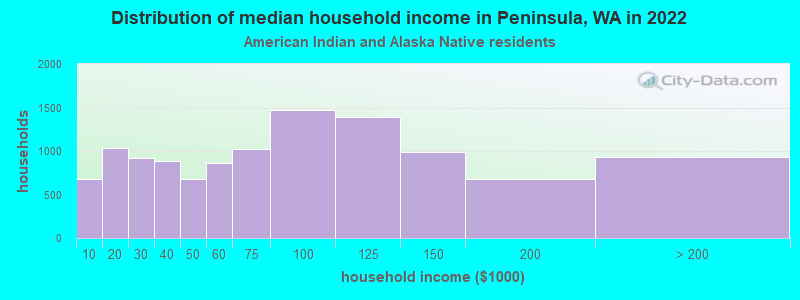
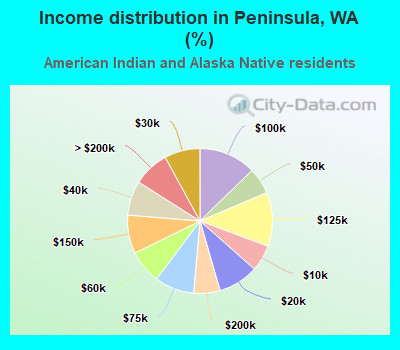
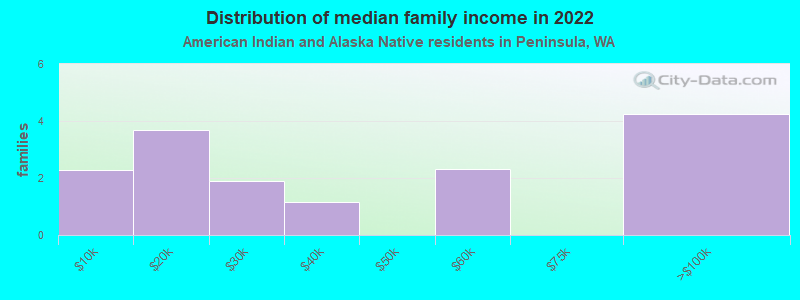
Income statistics for American Indian and Alaska Native residents
Median household income in Peninsula, WA in 2022:| Peninsula: | $52,131 |
| Washington: | $71,255 |
Change in median household income between 2000 and 2022:| Peninsula, Washington: | +108.5% |
| State: | +118.1% |
Number of households with income < $10k:| Peninsula: | 5.9% (679) |
| Washington: | 5.9% (1,768) |
Number of households with income $10k - 20k:| Peninsula: | 9.0% (1,037) |
| State: | 8.9% (2,694) |
Number of households with income $20k - 30k:| Peninsula: | 8.0% (917) |
| Washington: | 8.0% (2,412) |
Number of households with income $30k - 40k:| Peninsula: | 7.7% (889) |
| State: | 7.7% (2,327) |
Number of households with income $40k - 50k:| Peninsula: | 5.9% (680) |
| Washington: | 5.8% (1,755) |
Number of households with income $50k - 60k:| Peninsula: | 7.5% (864) |
| State: | 7.5% (2,259) |
Number of households with income $60k - 75k:| Peninsula: | 8.8% (1,019) |
| Washington: | 8.8% (2,669) |
Number of households with income $75k - 100k:| Peninsula: | 12.7% (1,469) |
| Washington: | 12.8% (3,861) |
Number of households with income $100k - 125k:| Peninsula: | 12.0% (1,386) |
| Washington: | 12.0% (3,618) |
Number of households with income $125k - 150k:| Peninsula: | 8.6% (990) |
| Washington: | 8.6% (2,580) |
Number of households with income $150k - 200k:| Peninsula: | 5.9% (677) |
| Washington: | 5.9% (1,774) |
Number of households with income > $200k:| Peninsula: | 8.0% (927) |
| State: | 8.1% (2,447) |
Aggregate household income in Peninsula in 2022: $2,597,795
Median family income in Peninsula in 2022:| Peninsula: | $38,479 |
| Washington: | $79,010 |
Number of families with income < $10k:| Peninsula: | 14.7% (2) |
| Washington: | 5.2% (1,047) |
Number of families with income $10k - 20k:| Peninsula: | 23.7% (4) |
| Washington: | 5.2% (1,056) |
Number of families with income $20k - 30k:| Peninsula: | 12.1% (2) |
| Washington: | 6.2% (1,258) |
Number of families with income $30k - 40k:| Peninsula: | 7.4% (1) |
| State: | 5.9% (1,190) |
Number of families with income $50k - 60k:| Peninsula: | 14.9% (2) |
| State: | 9.7% (1,973) |
Number of families with income $75k - 100k:| Peninsula: | 27.2% (4) |
| State: | 13.1% (2,669) |
Median non-family income in Peninsula in 2022:| Peninsula: | $40,799 |
| Washington: | $35,591 |
Change in median non-family income between 2000 and 2022:| Peninsula, Washington: | +58.4% |
| Washington: | +61.8% |
Median per capita income in Peninsula in 2022:| Peninsula: | $27,115 |
| Washington: | $27,053 |
Change in median per capita income between 2000 and 2022:| Peninsula, Washington: | +97.1% |
| State: | +98.6% |
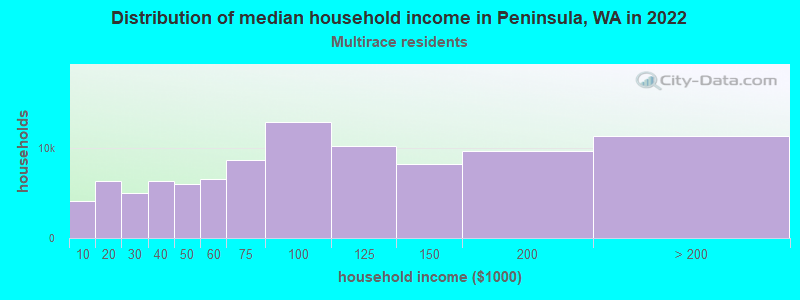
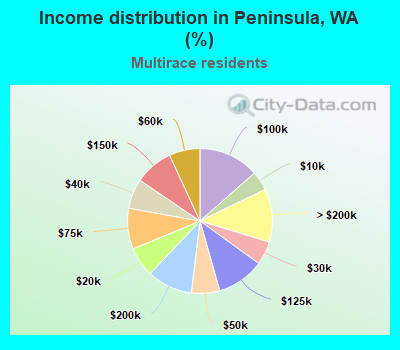
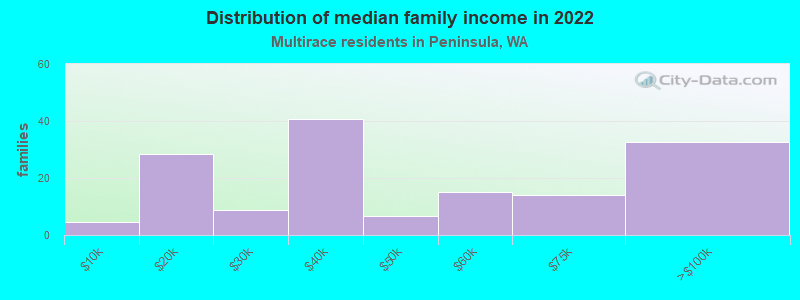
Income statistics for Multirace residents
Median household income in Peninsula, WA in 2022:| Peninsula: | $58,459 |
| Washington: | $84,303 |
Change in median household income between 2000 and 2022:| Peninsula, Washington: | +128.1% |
| State: | +125.7% |
Number of households with income < $10k:| Peninsula: | 4.3% (4,130) |
| Washington: | 4.3% (12,040) |
Number of households with income $10k - 20k:| Peninsula: | 6.6% (6,326) |
| State: | 6.6% (18,437) |
Number of households with income $20k - 30k:| Peninsula: | 5.2% (4,993) |
| State: | 5.2% (14,559) |
Number of households with income $30k - 40k:| Peninsula: | 6.7% (6,343) |
| State: | 6.7% (18,491) |
Number of households with income $40k - 50k:| Peninsula: | 6.3% (5,991) |
| State: | 6.3% (17,459) |
Number of households with income $50k - 60k:| Peninsula: | 6.9% (6,545) |
| State: | 6.9% (19,086) |
Number of households with income $60k - 75k:| Peninsula: | 9.1% (8,684) |
| State: | 9.1% (25,310) |
Number of households with income $75k - 100k:| Peninsula: | 13.5% (12,859) |
| Washington: | 13.5% (37,493) |
Number of households with income $100k - 125k:| Peninsula: | 10.7% (10,159) |
| Washington: | 10.7% (29,626) |
Number of households with income $125k - 150k:| Peninsula: | 8.6% (8,198) |
| Washington: | 8.6% (23,899) |
Number of households with income $150k - 200k:| Peninsula: | 10.2% (9,682) |
| Washington: | 10.2% (28,214) |
Number of households with income > $200k:| Peninsula: | 11.9% (11,300) |
| State: | 11.9% (32,947) |
Aggregate household income in Peninsula in 2022: $34,961,760
Median family income in Peninsula in 2022:| Peninsula: | $67,720 |
| State: | $95,629 |
Number of families with income < $10k:| Peninsula: | 3.0% (5) |
| State: | 3.5% (6,121) |
Number of families with income $10k - 20k:| Peninsula: | 18.9% (29) |
| Washington: | 4.3% (7,519) |
Number of families with income $20k - 30k:| Peninsula: | 5.8% (9) |
| Washington: | 4.4% (7,775) |
Number of families with income $30k - 40k:| Peninsula: | 26.9% (41) |
| Washington: | 5.8% (10,186) |
Number of families with income $40k - 50k:| Peninsula: | 4.5% (7) |
| State: | 5.9% (10,412) |
Number of families with income $50k - 60k:| Peninsula: | 10.0% (15) |
| State: | 5.6% (9,922) |
Number of families with income $60k - 75k:| Peninsula: | 9.2% (14) |
| Washington: | 9.7% (17,113) |
Number of families with income $75k - 100k:| Peninsula: | 21.7% (33) |
| State: | 13.6% (23,984) |
Median non-family income in Peninsula in 2022:| Peninsula: | $46,543 |
| Washington: | $56,573 |
Change in median non-family income between 2000 and 2022:| Peninsula, Washington: | +114.8% |
| State: | +115.0% |
Median per capita income in Peninsula in 2022:| Peninsula: | $28,459 |
| Washington: | $32,496 |
Change in median per capita income between 2000 and 2022:| Peninsula, Washington: | +144.1% |
| State: | +156.8% |
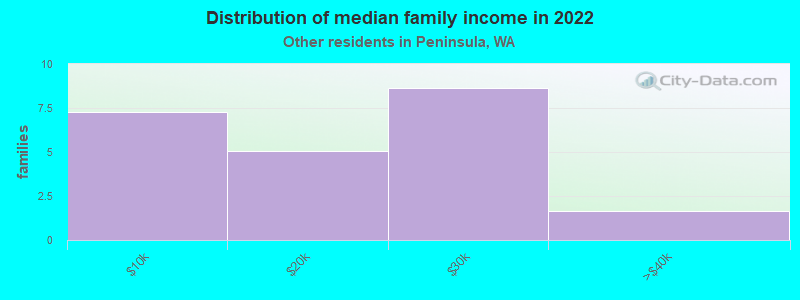
Income statistics for other residents
Number of households with income < $10k:| Peninsula: | 3.1% (1) |
| State: | 5.3% (6,540) |
Number of households with income $10k - 20k:| Peninsula: | 6.2% (2) |
| Washington: | 6.0% (7,385) |
Number of households with income $20k - 30k:| Peninsula: | 9.4% (3) |
| State: | 7.5% (9,289) |
Number of households with income $30k - 40k:| Peninsula: | 9.4% (3) |
| Washington: | 8.9% (11,015) |
Number of households with income $40k - 50k:| Peninsula: | 9.4% (3) |
| Washington: | 7.6% (9,399) |
Number of households with income $50k - 60k:| Peninsula: | 9.4% (3) |
| State: | 7.2% (8,867) |
Number of households with income $60k - 75k:| Peninsula: | 9.4% (3) |
| Washington: | 10.5% (13,032) |
Number of households with income $75k - 100k:| Peninsula: | 12.5% (4) |
| Washington: | 14.6% (18,007) |
Number of households with income $100k - 125k:| Peninsula: | 12.5% (4) |
| State: | 12.2% (15,128) |
Number of households with income $125k - 150k:| Peninsula: | 6.2% (2) |
| State: | 5.6% (6,950) |
Number of households with income $150k - 200k:| Peninsula: | 6.2% (2) |
| State: | 7.1% (8,749) |
Number of households with income > $200k:| Peninsula: | 6.2% (2) |
| State: | 7.5% (9,208) |
Aggregate household income in Peninsula in 2022: $2,859,882
Median family income in Peninsula in 2022:| Peninsula: | $43,868 |
| State: | $72,588 |
Number of families with income < $10k:| Peninsula: | 32.3% (7) |
| State: | 5.5% (5,287) |
Number of families with income $10k - 20k:| Peninsula: | 22.3% (5) |
| State: | 4.0% (3,814) |
Number of families with income $20k - 30k:| Peninsula: | 38.2% (9) |
| State: | 6.6% (6,293) |
Number of families with income $30k - 40k:| Peninsula: | 7.3% (2) |
| State: | 9.2% (8,827) |
Median non-family income in Peninsula in 2022:| Peninsula: | $20,120 |
| State: | $44,777 |
Change in median non-family income between 2000 and 2022:| Peninsula, Washington: | +93.1% |
| State: | +84.2% |
Median per capita income in Peninsula in 2022:| Peninsula: | $12,500 |
| Washington: | $27,542 |