Perth, New York (NY) income map, earnings map, and wages data
The median household income in Perth, NY in 2022 was $72,695, which was 9.4% less than the median annual income of $79,557 across the entire state of New York. Compared to the median income of $39,932 in 2000 this represents an increase of 45.1%. The per capita income in 2022 was $34,377, which means an increase of 50.9% compared to 2000 when it was $16,870.
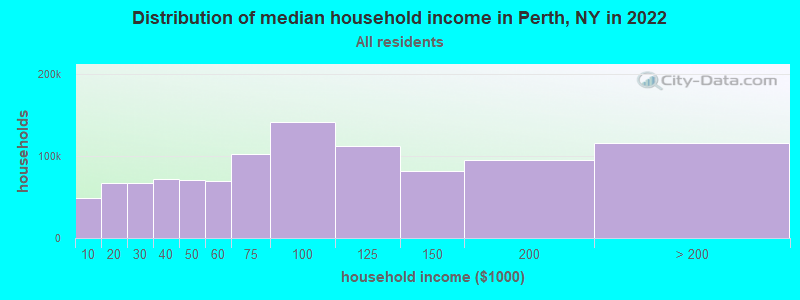
Income statistics for all residents
Median household income in Perth, NY in 2022:| Perth: | $72,695 |
| State: | $79,557 |
Change in median household income between 2000 and 2022:| Perth, New York: | +82.0% |
| State: | +83.3% |
Number of households with income < $10k:| Perth: | 6.8% (242,881) |
| State: | 6.8% (527,598) |
Number of households with income $10k - 20k:| Perth: | 7.4% (264,629) |
| New York: | 7.4% (574,940) |
Number of households with income $20k - 30k:| Perth: | 6.7% (238,272) |
| New York: | 6.7% (517,718) |
Number of households with income $30k - 40k:| Perth: | 6.5% (233,171) |
| New York: | 6.5% (506,674) |
Number of households with income $40k - 50k:| Perth: | 6.1% (216,482) |
| New York: | 6.1% (470,439) |
Number of households with income $50k - 60k:| Perth: | 5.8% (208,933) |
| New York: | 5.8% (454,042) |
Number of households with income $60k - 75k:| Perth: | 8.5% (302,555) |
| State: | 8.5% (657,508) |
Number of households with income $75k - 100k:| Perth: | 11.6% (414,054) |
| New York: | 11.6% (899,824) |
Number of households with income $100k - 125k:| Perth: | 9.3% (333,075) |
| New York: | 9.3% (723,825) |
Number of households with income $125k - 150k:| Perth: | 7.1% (254,213) |
| State: | 7.1% (552,420) |
Number of households with income $150k - 200k:| Perth: | 9.4% (334,613) |
| New York: | 9.4% (727,051) |
Number of households with income > $200k:| Perth: | 15.0% (535,024) |
| State: | 15.0% (1,162,269) |
Aggregate household income in Perth in 2022: $13,000,207,533
Median family income in Perth in 2022:| Perth: | $88,160 |
| State: | $99,066 |
Median non-family income in Perth in 2022:| Perth: | $43,395 |
| State: | $50,181 |
Change in median non-family income between 2000 and 2022:| Perth, New York: | +81.3% |
| State: | +85.4% |
Median per capita income in Perth in 2022:| Perth: | $34,377 |
| State: | $47,421 |
Change in median per capita income between 2000 and 2022:| Perth, New York: | +103.8% |
| New York: | +102.7% |
Income statistics for White residents
Median household income in Perth, NY in 2022:| Perth: | $73,668 |
| New York: | $89,408 |
Change in median household income between 2000 and 2022:| Perth, New York: | +83.3% |
| New York: | +85.5% |
Number of households with income < $10k:| Perth: | 4.8% (93,613) |
| New York: | 4.8% (225,550) |
Number of households with income $10k - 20k:| Perth: | 6.1% (120,614) |
| State: | 6.1% (289,425) |
Number of households with income $20k - 30k:| Perth: | 6.0% (116,991) |
| New York: | 5.9% (280,254) |
Number of households with income $30k - 40k:| Perth: | 6.1% (120,469) |
| State: | 6.1% (288,263) |
Number of households with income $40k - 50k:| Perth: | 5.9% (116,332) |
| State: | 5.9% (278,079) |
Number of households with income $50k - 60k:| Perth: | 5.7% (111,992) |
| State: | 5.7% (267,554) |
Number of households with income $60k - 75k:| Perth: | 8.5% (166,778) |
| State: | 8.4% (398,344) |
Number of households with income $75k - 100k:| Perth: | 11.8% (232,254) |
| State: | 11.8% (554,841) |
Number of households with income $100k - 125k:| Perth: | 10.0% (196,095) |
| State: | 10.0% (469,794) |
Number of households with income $125k - 150k:| Perth: | 7.7% (150,381) |
| State: | 7.6% (360,467) |
Number of households with income $150k - 200k:| Perth: | 10.1% (198,088) |
| New York: | 10.1% (477,078) |
Number of households with income > $200k:| Perth: | 17.4% (341,689) |
| State: | 17.6% (829,233) |
Aggregate household income in Perth in 2022: $8,785,778,251
Median family income in Perth in 2022:| Perth: | $90,413 |
| New York: | $115,170 |
Number of families with income < $10k:| Perth: | 4.5% (25) |
| State: | 2.5% (68,851) |
Number of families with income $10k - 20k:| Perth: | 5.4% (30) |
| New York: | 3.0% (83,127) |
Number of families with income $20k - 30k:| Perth: | 7.7% (44) |
| State: | 3.5% (97,578) |
Number of families with income $30k - 40k:| Perth: | 8.2% (46) |
| State: | 4.1% (114,108) |
Number of families with income $40k - 50k:| Perth: | 10.7% (60) |
| New York: | 4.7% (130,902) |
Number of families with income $50k - 60k:| Perth: | 8.1% (46) |
| New York: | 4.9% (135,118) |
Number of families with income $60k - 75k:| Perth: | 16.6% (93) |
| State: | 7.8% (216,254) |
Number of families with income $75k - 100k:| Perth: | 18.5% (104) |
| State: | 12.4% (342,382) |
Number of families with income $100k - 125k:| Perth: | 17.7% (100) |
| New York: | 11.4% (314,917) |
Number of families with income $125k - 150k:| Perth: | 2.4% (14) |
| State: | 9.4% (260,489) |
Median non-family income in Perth in 2022:| Perth: | $44,017 |
| State: | $54,783 |
Change in median non-family income between 2000 and 2022:| Perth, New York: | +83.9% |
| State: | +87.9% |
Median per capita income in Perth in 2022:| Perth: | $38,337 |
| New York: | $57,640 |
Change in median per capita income between 2000 and 2022:| Perth, New York: | +111.0% |
| State: | +111.6% |
Income statistics for Black or African American residents
Number of households with income < $10k:| Perth: | 12.0% (4,332) |
| New York: | 12.0% (128,500) |
Number of households with income $10k - 20k:| Perth: | 10.0% (3,626) |
| State: | 10.0% (107,541) |
Number of households with income $20k - 30k:| Perth: | 8.4% (3,041) |
| State: | 8.4% (90,192) |
Number of households with income $30k - 40k:| Perth: | 7.4% (2,682) |
| State: | 7.4% (79,579) |
Number of households with income $40k - 50k:| Perth: | 6.8% (2,444) |
| New York: | 6.8% (72,491) |
Number of households with income $50k - 60k:| Perth: | 6.7% (2,404) |
| State: | 6.7% (71,309) |
Number of households with income $60k - 75k:| Perth: | 8.9% (3,204) |
| State: | 8.9% (95,050) |
Number of households with income $75k - 100k:| Perth: | 11.5% (4,166) |
| New York: | 11.5% (123,569) |
Number of households with income $100k - 125k:| Perth: | 8.1% (2,921) |
| New York: | 8.1% (86,632) |
Number of households with income $125k - 150k:| Perth: | 6.0% (2,184) |
| State: | 6.0% (64,788) |
Number of households with income $150k - 200k:| Perth: | 7.2% (2,584) |
| State: | 7.2% (76,644) |
Number of households with income > $200k:| Perth: | 7.0% (2,531) |
| State: | 7.0% (75,062) |
Median per capita income in Perth in 2022:| Perth: | $2,083 |
| State: | $31,947 |
Change in median per capita income between 2000 and 2022:| Perth, New York: | +99.4% |
| New York: | +106.1% |
Income statistics for Asian residents
Number of households with income < $10k:| Perth: | 6.9% (9,034) |
| New York: | 6.9% (42,537) |
Number of households with income $10k - 20k:| Perth: | 7.3% (9,504) |
| State: | 7.3% (44,745) |
Number of households with income $20k - 30k:| Perth: | 6.2% (8,134) |
| New York: | 6.2% (38,249) |
Number of households with income $30k - 40k:| Perth: | 5.5% (7,220) |
| State: | 5.5% (33,993) |
Number of households with income $40k - 50k:| Perth: | 4.9% (6,334) |
| State: | 4.8% (29,795) |
Number of households with income $50k - 60k:| Perth: | 5.2% (6,791) |
| New York: | 5.2% (32,100) |
Number of households with income $60k - 75k:| Perth: | 7.3% (9,472) |
| State: | 7.3% (44,615) |
Number of households with income $75k - 100k:| Perth: | 10.9% (14,161) |
| State: | 10.8% (66,687) |
Number of households with income $100k - 125k:| Perth: | 8.2% (10,649) |
| State: | 8.2% (50,233) |
Number of households with income $125k - 150k:| Perth: | 7.2% (9,403) |
| State: | 7.2% (44,299) |
Number of households with income $150k - 200k:| Perth: | 10.4% (13,536) |
| State: | 10.4% (63,837) |
Number of households with income > $200k:| Perth: | 20.1% (26,269) |
| State: | 20.1% (123,891) |
Median per capita income in Perth in 2022:| Perth: | $19,822 |
| State: | $46,726 |
Change in median per capita income between 2000 and 2022:| Perth, New York: | +126.5% |
| State: | +126.6% |
Income statistics for Hispanic or Latino residents
Median household income in Perth, NY in 2022:| Perth: | $22,113 |
| State: | $60,468 |
Change in median household income between 2000 and 2022:| Perth, New York: | +96.6% |
| State: | +98.3% |
Number of households with income < $10k:| Perth: | 10.0% (23,442) |
| State: | 9.9% (127,185) |
Number of households with income $10k - 20k:| Perth: | 10.7% (25,234) |
| New York: | 10.7% (136,699) |
Number of households with income $20k - 30k:| Perth: | 8.1% (19,002) |
| State: | 8.1% (102,991) |
Number of households with income $30k - 40k:| Perth: | 7.8% (18,405) |
| New York: | 7.8% (100,149) |
Number of households with income $40k - 50k:| Perth: | 6.8% (16,102) |
| State: | 6.9% (87,760) |
Number of households with income $50k - 60k:| Perth: | 6.3% (14,912) |
| New York: | 6.3% (80,968) |
Number of households with income $60k - 75k:| Perth: | 8.6% (20,325) |
| State: | 8.7% (110,631) |
Number of households with income $75k - 100k:| Perth: | 11.2% (26,235) |
| State: | 11.2% (142,787) |
Number of households with income $100k - 125k:| Perth: | 8.2% (19,224) |
| State: | 8.2% (104,850) |
Number of households with income $125k - 150k:| Perth: | 6.3% (14,750) |
| State: | 6.3% (80,274) |
Number of households with income $150k - 200k:| Perth: | 7.4% (17,437) |
| State: | 7.4% (95,117) |
Number of households with income > $200k:| Perth: | 8.6% (20,110) |
| State: | 8.6% (109,514) |
Aggregate household income in Perth in 2022: $2,420,558
Median family income in Perth in 2022:| Perth: | $23,857 |
| New York: | $68,770 |
Number of families with income < $10k:| Perth: | 9.1% (15) |
| State: | 6.9% (58,565) |
Number of families with income $10k - 20k:| Perth: | 10.1% (16) |
| State: | 7.0% (59,058) |
Number of families with income $20k - 30k:| Perth: | 14.1% (23) |
| State: | 8.0% (68,048) |
Number of families with income $30k - 40k:| Perth: | 13.0% (21) |
| State: | 8.4% (70,668) |
Number of families with income $40k - 50k:| Perth: | 13.1% (21) |
| State: | 7.4% (62,941) |
Number of families with income $50k - 60k:| Perth: | 7.8% (13) |
| State: | 6.6% (55,592) |
Number of families with income $60k - 75k:| Perth: | 13.2% (21) |
| New York: | 9.3% (78,564) |
Number of families with income $75k - 100k:| Perth: | 10.9% (18) |
| State: | 12.6% (106,685) |
Number of families with income $100k - 125k:| Perth: | 7.8% (13) |
| State: | 9.4% (79,139) |
Number of families with income $125k - 150k:| Perth: | 0.9% (1) |
| State: | 6.9% (58,255) |
Median per capita income in Perth in 2022:| Perth: | $2,241 |
| State: | $29,761 |
Change in median per capita income between 2000 and 2022:| Perth, New York: | +127.3% |
| State: | +132.7% |
Income statistics for American Indian and Alaska Native residents
Number of households with income < $10k:| Perth: | 8.6% (2,627) |
| New York: | 8.6% (3,559) |
Number of households with income $10k - 20k:| Perth: | 6.0% (1,819) |
| State: | 5.9% (2,455) |
Number of households with income $20k - 30k:| Perth: | 8.2% (2,499) |
| State: | 8.2% (3,393) |
Number of households with income $30k - 40k:| Perth: | 11.9% (3,631) |
| State: | 11.9% (4,918) |
Number of households with income $40k - 50k:| Perth: | 6.4% (1,964) |
| State: | 6.5% (2,682) |
Number of households with income $50k - 60k:| Perth: | 6.0% (1,846) |
| State: | 6.1% (2,516) |
Number of households with income $60k - 75k:| Perth: | 9.9% (3,030) |
| New York: | 10.0% (4,125) |
Number of households with income $75k - 100k:| Perth: | 13.4% (4,078) |
| New York: | 13.3% (5,517) |
Number of households with income $100k - 125k:| Perth: | 8.4% (2,552) |
| State: | 8.4% (3,463) |
Number of households with income $125k - 150k:| Perth: | 7.0% (2,137) |
| New York: | 7.0% (2,887) |
Number of households with income $150k - 200k:| Perth: | 10.0% (3,043) |
| State: | 9.9% (4,106) |
Number of households with income > $200k:| Perth: | 4.2% (1,289) |
| New York: | 4.2% (1,744) |
Median per capita income in Perth in 2022:| Perth: | $33,258 |
| State: | $25,837 |
Change in median per capita income between 2000 and 2022:| Perth, New York: | +75.0% |
| State: | +99.6% |
Income statistics for Multirace residents
Median household income in Perth, NY in 2022:| Perth: | $24,361 |
| State: | $73,557 |
Change in median household income between 2000 and 2022:| Perth, New York: | +116.5% |
| New York: | +123.9% |
Number of households with income < $10k:| Perth: | 8.9% (9,930) |
| State: | 8.9% (57,924) |
Number of households with income $10k - 20k:| Perth: | 8.7% (9,685) |
| State: | 8.7% (56,590) |
Number of households with income $20k - 30k:| Perth: | 7.1% (7,917) |
| New York: | 7.1% (46,287) |
Number of households with income $30k - 40k:| Perth: | 6.9% (7,710) |
| State: | 6.9% (45,132) |
Number of households with income $40k - 50k:| Perth: | 5.8% (6,470) |
| State: | 5.8% (37,946) |
Number of households with income $50k - 60k:| Perth: | 5.6% (6,217) |
| State: | 5.6% (36,410) |
Number of households with income $60k - 75k:| Perth: | 7.8% (8,672) |
| State: | 7.8% (50,819) |
Number of households with income $75k - 100k:| Perth: | 11.7% (12,995) |
| State: | 11.7% (76,024) |
Number of households with income $100k - 125k:| Perth: | 9.3% (10,341) |
| State: | 9.3% (60,635) |
Number of households with income $125k - 150k:| Perth: | 6.2% (6,929) |
| State: | 6.2% (40,533) |
Number of households with income $150k - 200k:| Perth: | 8.6% (9,638) |
| State: | 8.6% (56,409) |
Number of households with income > $200k:| Perth: | 13.4% (14,963) |
| State: | 13.4% (87,442) |
Aggregate household income in Perth in 2022: $1,911,930
Median family income in Perth in 2022:| Perth: | $26,278 |
| New York: | $85,788 |
Number of families with income $10k - 20k:| Perth: | 100.0% (13) |
| State: | 5.6% (22,512) |
Median per capita income in Perth in 2022:| Perth: | $14,781 |
| State: | $36,931 |