The median household income in Pine Grove Mills, PA in 2022 was $138,627, which was 48.2% greater than the median annual income of $71,798 across the entire state of Pennsylvania. Compared to the median income of $47,321 in 2000 this represents an increase of 65.9%. The per capita income in 2022 was $52,739, which means an increase of 56.7% compared to 2000 when it was $22,822.
Whole page based on the data from 2000 / 2022 when the population of Pine Grove Mills, Pennsylvania was 1,141 / 1,506
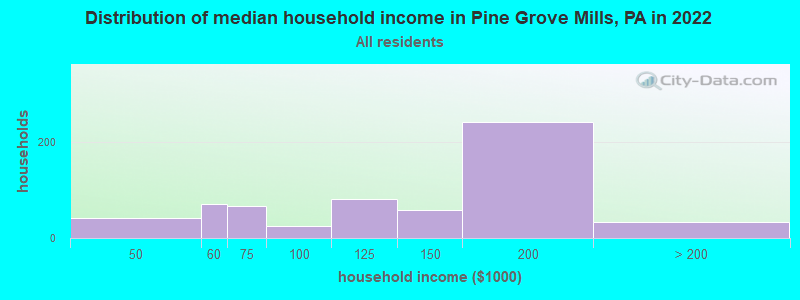
Income statistics for all residents
Median household income in Pine Grove Mills, PA in 2022:
Pine Grove Mills:
$138,627
State:
$71,798
Number of households with income < $10k:
Pine Grove Mills:
0.0% (0)
State:
5.5% (291,562)
Number of households with income $10k - 20k:
Pine Grove Mills:
0.0% (0)
State:
7.3% (384,726)
Number of households with income $20k - 30k:
Pine Grove Mills:
0.0% (0)
State:
7.4% (389,464)
Number of households with income $30k - 40k:
Pine Grove Mills:
0.0% (0)
Pennsylvania:
7.6% (402,138)
Number of households with income $40k - 50k:
Pine Grove Mills:
6.6% (41)
State:
7.3% (387,945)
Number of households with income $50k - 60k:
Pine Grove Mills:
11.5% (71)
State:
7.0% (372,468)
Number of households with income $60k - 75k:
Pine Grove Mills:
10.7% (66)
Pennsylvania:
9.9% (524,786)
Number of households with income $75k - 100k:
Pine Grove Mills:
3.9% (24)
State:
12.6% (666,253)
Number of households with income $100k - 125k:
Pine Grove Mills:
13.2% (82)
State:
9.9% (526,402)
Number of households with income $125k - 150k:
Pine Grove Mills:
9.5% (59)
State:
6.9% (362,702)
Number of households with income $150k - 200k:
Pine Grove Mills:
39.1% (242)
State:
8.3% (440,827)
Number of households with income > $200k:
Pine Grove Mills:
5.5% (34)
Pennsylvania:
10.3% (544,792)
Aggregate household income in Pine Grove Mills in 2022: $76,189,373
Median family income in Pine Grove Mills in 2022:
Pine Grove Mills:
$116,031
State:
$93,029
Number of families with income $40k - 50k:
Pine Grove Mills:
8.6% (35)
State:
6.4% (211,380)
Number of families with income $50k - 60k:
Pine Grove Mills:
10.9% (44)
Pennsylvania:
6.4% (209,910)
Number of families with income $60k - 75k:
Pine Grove Mills:
14.5% (58)
State:
9.7% (318,991)
Number of families with income $100k - 125k:
Pine Grove Mills:
22.8% (92)
State:
12.2% (400,961)
Number of families with income $125k - 150k:
Pine Grove Mills:
13.3% (54)
State:
8.8% (288,471)
Number of families with income $150k - 200k:
Pine Grove Mills:
21.9% (88)
State:
11.2% (367,642)
Number of families with income > $200k:
Pine Grove Mills:
7.9% (32)
State:
14.3% (470,863)
Median income for 2 person families:
Pine Grove Mills:
$117,891
Pennsylvania:
$78,349
Median income for families with 0 earners:
Pine Grove Mills:
$0
State:
$48,949
Median income for families with 1 earner:
Pine Grove Mills:
$0
State:
$64,277
Median income for families with 2 earners:
Pine Grove Mills:
$140,360
State:
$118,220
Median income for families with 3+ earners:
Pine Grove Mills:
$0
State:
$150,374
Median non-family income in Pine Grove Mills in 2022:
Pine Grove Mills:
$159,514
State:
$42,203
Median per capita income in Pine Grove Mills in 2022:
Pine Grove Mills:
$52,740
State:
$41,489
Change in median per capita income between 2000 and 2022:
Pine Grove Mills, Pennsylvania:
+131.1%
State:
+98.7%
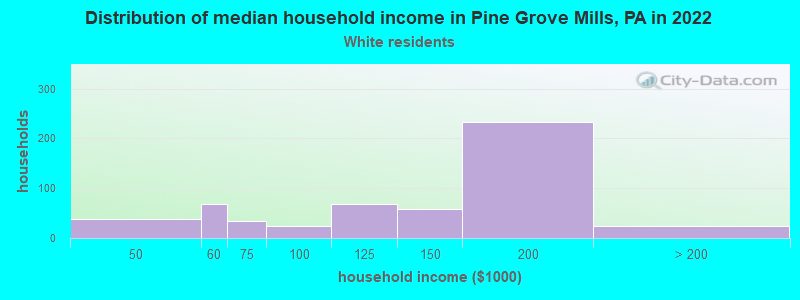
Income statistics for White residents
Median household income in Pine Grove Mills, PA in 2022:
Pine Grove Mills:
$136,854
State:
$76,765
Number of households with income < $10k:
Pine Grove Mills:
0.0% (0)
State:
4.3% (179,792)
Number of households with income $10k - 20k:
Pine Grove Mills:
0.0% (0)
State:
6.5% (268,738)
Number of households with income $20k - 30k:
Pine Grove Mills:
0.0% (0)
State:
7.0% (288,138)
Number of households with income $30k - 40k:
Pine Grove Mills:
0.0% (0)
State:
7.2% (300,208)
Number of households with income $40k - 50k:
Pine Grove Mills:
7.1% (39)
Pennsylvania:
7.2% (298,756)
Number of households with income $50k - 60k:
Pine Grove Mills:
12.5% (69)
State:
6.8% (283,251)
Number of households with income $60k - 75k:
Pine Grove Mills:
6.2% (34)
Pennsylvania:
9.9% (408,159)
Number of households with income $75k - 100k:
Pine Grove Mills:
4.4% (24)
State:
13.2% (547,809)
Number of households with income $100k - 125k:
Pine Grove Mills:
12.5% (69)
State:
10.5% (436,652)
Number of households with income $125k - 150k:
Pine Grove Mills:
10.5% (58)
State:
7.3% (304,132)
Number of households with income $150k - 200k:
Pine Grove Mills:
42.3% (233)
State:
9.0% (374,658)
Number of households with income > $200k:
Pine Grove Mills:
4.5% (25)
Pennsylvania:
10.9% (452,618)
Aggregate household income in Pine Grove Mills in 2022: $71,149,882
Median family income in Pine Grove Mills in 2022:
Pine Grove Mills:
$119,005
State:
$99,396
Number of families with income $40k - 50k:
Pine Grove Mills:
10.0% (35)
State:
6.0% (154,327)
Number of families with income $50k - 60k:
Pine Grove Mills:
11.7% (41)
State:
6.1% (157,983)
Number of families with income $60k - 75k:
Pine Grove Mills:
8.7% (30)
Pennsylvania:
9.6% (249,292)
Number of families with income $100k - 125k:
Pine Grove Mills:
22.4% (78)
Pennsylvania:
12.9% (333,626)
Number of families with income $125k - 150k:
Pine Grove Mills:
15.3% (53)
Pennsylvania:
9.4% (243,915)
Number of families with income $150k - 200k:
Pine Grove Mills:
25.0% (86)
State:
12.2% (314,926)
Number of families with income > $200k:
Pine Grove Mills:
6.8% (23)
Pennsylvania:
15.1% (390,885)
Median non-family income in Pine Grove Mills in 2022:
Pine Grove Mills:
$155,754
State:
$44,251
Median per capita income in Pine Grove Mills in 2022:
Pine Grove Mills:
$56,048
State:
$45,306
Change in median per capita income between 2000 and 2022:
Pine Grove Mills, Pennsylvania:
+142.3%
Pennsylvania:
+105.4%
Income statistics for Asian residents
Median per capita income in Pine Grove Mills in 2022:
Pine Grove Mills:
$19,487
State:
$48,341
Change in median per capita income between 2000 and 2022:
Pine Grove Mills, Pennsylvania:
+77.2%
Pennsylvania:
+140.6%
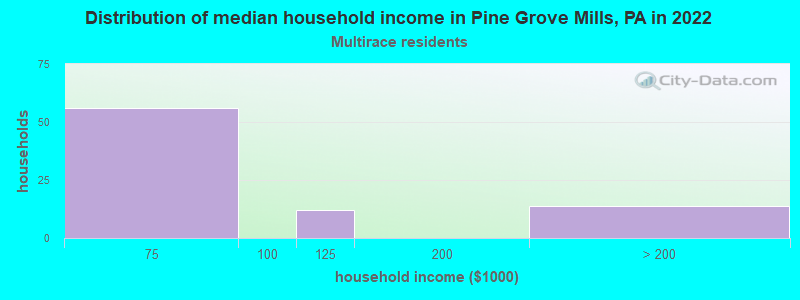
Income statistics for Multirace residents
Median household income in Pine Grove Mills, PA in 2022:
Pine Grove Mills:
$78,487
Pennsylvania:
$61,450
Number of households with income < $10k:
Pine Grove Mills:
0.0% (0)
State:
7.8% (21,911)
Number of households with income $10k - 20k:
Pine Grove Mills:
0.0% (0)
State:
8.2% (22,847)
Number of households with income $20k - 30k:
Pine Grove Mills:
0.0% (0)
State:
8.7% (24,252)
Number of households with income $30k - 40k:
Pine Grove Mills:
0.0% (0)
State:
7.3% (20,502)
Number of households with income $40k - 50k:
Pine Grove Mills:
0.0% (0)
State:
7.7% (21,525)
Number of households with income $50k - 60k:
Pine Grove Mills:
0.0% (0)
Pennsylvania:
8.6% (24,174)
Number of households with income $60k - 75k:
Pine Grove Mills:
68.3% (56)
Pennsylvania:
11.9% (33,350)
Number of households with income $75k - 100k:
Pine Grove Mills:
0.0% (0)
State:
11.5% (32,274)
Number of households with income $100k - 125k:
Pine Grove Mills:
14.6% (12)
State:
8.3% (23,361)
Number of households with income $125k - 150k:
Pine Grove Mills:
0.0% (0)
State:
5.3% (14,784)
Number of households with income $150k - 200k:
Pine Grove Mills:
0.0% (0)
State:
6.9% (19,314)
Number of households with income > $200k:
Pine Grove Mills:
17.1% (14)
State:
7.8% (21,759)
Aggregate household income in Pine Grove Mills in 2022: $6,057,491
Median family income in Pine Grove Mills in 2022:
Pine Grove Mills:
$73,609
State:
$70,158
Number of families with income $60k - 75k:
Pine Grove Mills:
67.3% (52)
State:
11.0% (19,259)
Number of families with income $100k - 125k:
Pine Grove Mills:
14.7% (11)
State:
9.5% (16,618)
Number of families with income > $200k:
Pine Grove Mills:
18.0% (14)
State:
10.1% (17,694)
Median per capita income in Pine Grove Mills in 2022:
Pine Grove Mills:
$24,173
State:
$27,581
Discuss Pine Grove Mills, Pennsylvania (PA) on our hugely popular Pennsylvania forum.