Priest Point, Washington (WA) income map, earnings map, and wages data
The median household income in Priest Point, WA in 2022 was $100,161, which was 8.8% greater than the median annual income of $91,306 across the entire state of Washington. Compared to the median income of $52,344 in 2000 this represents an increase of 47.7%. The per capita income in 2022 was $57,705, which means an increase of 54.4% compared to 2000 when it was $26,322.
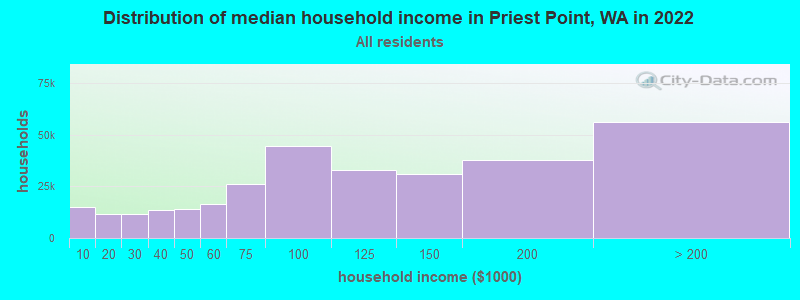
Income statistics for all residents
Median household income in Priest Point, WA in 2022:| Priest Point: | $100,162 |
| State: | $91,306 |
Change in median household income between 2000 and 2022:| Priest Point, Washington: | +91.4% |
| State: | +99.5% |
Number of households with income < $10k:| Priest Point: | 4.8% (14,839) |
| State: | 4.5% (139,331) |
Number of households with income $10k - 20k:| Priest Point: | 3.8% (11,835) |
| State: | 5.0% (154,508) |
Number of households with income $20k - 30k:| Priest Point: | 3.7% (11,487) |
| State: | 5.4% (166,555) |
Number of households with income $30k - 40k:| Priest Point: | 4.3% (13,413) |
| State: | 5.5% (170,324) |
Number of households with income $40k - 50k:| Priest Point: | 4.5% (14,062) |
| State: | 6.0% (183,941) |
Number of households with income $50k - 60k:| Priest Point: | 5.3% (16,475) |
| Washington: | 6.1% (187,395) |
Number of households with income $60k - 75k:| Priest Point: | 8.5% (26,347) |
| State: | 8.7% (266,771) |
Number of households with income $75k - 100k:| Priest Point: | 14.3% (44,443) |
| Washington: | 13.1% (404,672) |
Number of households with income $100k - 125k:| Priest Point: | 10.6% (32,785) |
| State: | 11.0% (337,911) |
Number of households with income $125k - 150k:| Priest Point: | 9.9% (30,792) |
| State: | 8.0% (244,934) |
Number of households with income $150k - 200k:| Priest Point: | 12.2% (37,947) |
| State: | 10.5% (323,812) |
Number of households with income > $200k:| Priest Point: | 18.1% (56,216) |
| State: | 16.2% (499,799) |
Aggregate household income in Priest Point in 2022: $388,967,675
Median family income in Priest Point in 2022:| Priest Point: | $119,379 |
| State: | $109,192 |
Median non-family income in Priest Point in 2022:| Priest Point: | $60,117 |
| Washington: | $57,299 |
Change in median non-family income between 2000 and 2022:| Priest Point, Washington: | +89.1% |
| Washington: | +94.9% |
Median per capita income in Priest Point in 2022:| Priest Point: | $57,706 |
| State: | $50,764 |
Change in median per capita income between 2000 and 2022:| Priest Point, Washington: | +119.2% |
| State: | +121.0% |
Income statistics for White residents
Median household income in Priest Point, WA in 2022:| Priest Point: | $93,790 |
| State: | $91,916 |
Change in median household income between 2000 and 2022:| Priest Point, Washington: | +86.4% |
| Washington: | +95.4% |
Number of households with income < $10k:| Priest Point: | 4.4% (9,410) |
| Washington: | 4.3% (95,850) |
Number of households with income $10k - 20k:| Priest Point: | 3.9% (8,392) |
| State: | 4.8% (106,421) |
Number of households with income $20k - 30k:| Priest Point: | 3.9% (8,438) |
| State: | 5.5% (122,860) |
Number of households with income $30k - 40k:| Priest Point: | 4.2% (9,061) |
| State: | 5.4% (119,627) |
Number of households with income $40k - 50k:| Priest Point: | 4.4% (9,396) |
| State: | 5.9% (132,276) |
Number of households with income $50k - 60k:| Priest Point: | 5.9% (12,509) |
| State: | 6.1% (136,212) |
Number of households with income $60k - 75k:| Priest Point: | 8.3% (17,699) |
| State: | 8.8% (196,086) |
Number of households with income $75k - 100k:| Priest Point: | 14.9% (31,919) |
| State: | 13.4% (299,192) |
Number of households with income $100k - 125k:| Priest Point: | 10.8% (23,004) |
| Washington: | 11.3% (252,209) |
Number of households with income $125k - 150k:| Priest Point: | 9.6% (20,618) |
| State: | 7.9% (175,962) |
Number of households with income $150k - 200k:| Priest Point: | 12.3% (26,361) |
| State: | 10.7% (239,156) |
Number of households with income > $200k:| Priest Point: | 17.3% (36,993) |
| Washington: | 16.1% (359,917) |
Aggregate household income in Priest Point in 2022: $252,316,021
Median family income in Priest Point in 2022:| Priest Point: | $120,089 |
| State: | $112,511 |
Number of families with income < $10k:| Priest Point: | 2.0% (5) |
| Washington: | 2.4% (33,676) |
Number of families with income $10k - 20k:| Priest Point: | 2.2% (6) |
| Washington: | 2.0% (28,228) |
Number of families with income $20k - 30k:| Priest Point: | 2.1% (5) |
| Washington: | 2.9% (39,288) |
Number of families with income $30k - 40k:| Priest Point: | 2.9% (7) |
| Washington: | 3.6% (50,190) |
Number of families with income $40k - 50k:| Priest Point: | 2.1% (5) |
| State: | 4.6% (63,009) |
Number of families with income $50k - 60k:| Priest Point: | 2.8% (7) |
| State: | 5.0% (69,270) |
Number of families with income $60k - 75k:| Priest Point: | 5.0% (12) |
| State: | 8.2% (112,369) |
Number of families with income $75k - 100k:| Priest Point: | 10.4% (26) |
| State: | 14.1% (194,214) |
Number of families with income $100k - 125k:| Priest Point: | 11.7% (29) |
| Washington: | 13.2% (182,184) |
Number of families with income $125k - 150k:| Priest Point: | 10.2% (25) |
| Washington: | 9.5% (130,928) |
Number of families with income $150k - 200k:| Priest Point: | 2.6% (6) |
| Washington: | 13.7% (188,621) |
Number of families with income > $200k:| Priest Point: | 46.1% (115) |
| State: | 20.8% (285,982) |
Median non-family income in Priest Point in 2022:| Priest Point: | $57,544 |
| State: | $56,103 |
Change in median non-family income between 2000 and 2022:| Priest Point, Washington: | +87.4% |
| State: | +87.7% |
Median per capita income in Priest Point in 2022:| Priest Point: | $66,465 |
| State: | $55,212 |
Change in median per capita income between 2000 and 2022:| Priest Point, Washington: | +128.1% |
| Washington: | +123.8% |
Income statistics for Black or African American residents
Median household income in Priest Point, WA in 2022:| Priest Point: | $165,589 |
| Washington: | $68,202 |
Change in median household income between 2000 and 2022:| Priest Point, Washington: | +93.7% |
| State: | +89.9% |
Number of households with income < $10k:| Priest Point: | 12.9% (2,499) |
| State: | 7.2% (8,014) |
Number of households with income $10k - 20k:| Priest Point: | 4.5% (863) |
| Washington: | 8.0% (8,904) |
Number of households with income $20k - 30k:| Priest Point: | 4.9% (946) |
| State: | 7.4% (8,207) |
Number of households with income $30k - 40k:| Priest Point: | 5.8% (1,121) |
| Washington: | 5.6% (6,220) |
Number of households with income $40k - 50k:| Priest Point: | 7.3% (1,404) |
| Washington: | 9.5% (10,585) |
Number of households with income $50k - 60k:| Priest Point: | 2.5% (475) |
| Washington: | 7.3% (8,078) |
Number of households with income $60k - 75k:| Priest Point: | 3.3% (642) |
| Washington: | 8.7% (9,704) |
Number of households with income $75k - 100k:| Priest Point: | 13.5% (2,607) |
| State: | 12.9% (14,315) |
Number of households with income $100k - 125k:| Priest Point: | 6.0% (1,155) |
| State: | 7.7% (8,592) |
Number of households with income $125k - 150k:| Priest Point: | 18.0% (3,478) |
| Washington: | 8.9% (9,840) |
Number of households with income $150k - 200k:| Priest Point: | 10.1% (1,944) |
| State: | 7.6% (8,434) |
Number of households with income > $200k:| Priest Point: | 11.3% (2,187) |
| State: | 9.1% (10,075) |
Aggregate household income in Priest Point in 2022: $1,076,032
Median non-family income in Priest Point in 2022:| Priest Point: | $143,472 |
| Washington: | $49,169 |
Change in median non-family income between 2000 and 2022:| Priest Point, Washington: | +67.8% |
| State: | +87.7% |
Median per capita income in Priest Point in 2022:| Priest Point: | $56,995 |
| Washington: | $38,209 |
Income statistics for Asian residents
Median household income in Priest Point, WA in 2022:| Priest Point: | $94,937 |
| State: | $125,692 |
Change in median household income between 2000 and 2022:| Priest Point, Washington: | +145.0% |
| State: | +164.5% |
Number of households with income < $10k:| Priest Point: | 5.1% (1,348) |
| State: | 4.9% (14,099) |
Number of households with income $10k - 20k:| Priest Point: | 1.7% (459) |
| State: | 3.5% (9,873) |
Number of households with income $20k - 30k:| Priest Point: | 2.3% (607) |
| Washington: | 2.9% (8,352) |
Number of households with income $30k - 40k:| Priest Point: | 3.6% (968) |
| State: | 4.0% (11,415) |
Number of households with income $40k - 50k:| Priest Point: | 3.3% (892) |
| State: | 4.0% (11,421) |
Number of households with income $50k - 60k:| Priest Point: | 2.1% (563) |
| Washington: | 4.2% (12,100) |
Number of households with income $60k - 75k:| Priest Point: | 7.5% (2,008) |
| State: | 6.3% (17,903) |
Number of households with income $75k - 100k:| Priest Point: | 12.7% (3,374) |
| Washington: | 10.4% (29,663) |
Number of households with income $100k - 125k:| Priest Point: | 9.1% (2,415) |
| Washington: | 9.4% (26,839) |
Number of households with income $125k - 150k:| Priest Point: | 8.3% (2,199) |
| Washington: | 8.5% (24,200) |
Number of households with income $150k - 200k:| Priest Point: | 13.4% (3,580) |
| State: | 12.6% (35,976) |
Number of households with income > $200k:| Priest Point: | 30.9% (8,227) |
| State: | 29.2% (83,109) |
Aggregate household income in Priest Point in 2022: $1,685,708
Median family income in Priest Point in 2022:| Priest Point: | $26,284 |
| Washington: | $143,595 |
Median per capita income in Priest Point in 2022:| Priest Point: | $27,605 |
| State: | $67,666 |
Income statistics for Hispanic or Latino residents
Median household income in Priest Point, WA in 2022:| Priest Point: | $44,714 |
| State: | $74,770 |
Change in median household income between 2000 and 2022:| Priest Point, Washington: | +74.5% |
| Washington: | +128.3% |
Number of households with income < $10k:| Priest Point: | 6.4% (806) |
| State: | 4.9% (14,456) |
Number of households with income $10k - 20k:| Priest Point: | 2.3% (295) |
| Washington: | 5.3% (15,449) |
Number of households with income $20k - 30k:| Priest Point: | 4.9% (617) |
| Washington: | 6.8% (20,016) |
Number of households with income $30k - 40k:| Priest Point: | 4.6% (581) |
| Washington: | 7.7% (22,548) |
Number of households with income $40k - 50k:| Priest Point: | 6.1% (772) |
| State: | 7.3% (21,450) |
Number of households with income $50k - 60k:| Priest Point: | 7.0% (888) |
| State: | 7.7% (22,744) |
Number of households with income $60k - 75k:| Priest Point: | 14.1% (1,787) |
| State: | 10.5% (30,737) |
Number of households with income $75k - 100k:| Priest Point: | 17.7% (2,249) |
| State: | 14.9% (43,843) |
Number of households with income $100k - 125k:| Priest Point: | 8.3% (1,049) |
| State: | 11.1% (32,554) |
Number of households with income $125k - 150k:| Priest Point: | 9.5% (1,206) |
| Washington: | 7.4% (21,624) |
Number of households with income $150k - 200k:| Priest Point: | 8.1% (1,027) |
| Washington: | 7.3% (21,360) |
Number of households with income > $200k:| Priest Point: | 11.1% (1,401) |
| State: | 9.2% (27,055) |
Aggregate household income in Priest Point in 2022: $1,903,564
Median family income in Priest Point in 2022:| Priest Point: | $87,279 |
| State: | $76,866 |
Number of families with income < $10k:| Priest Point: | 8.1% (2) |
| Washington: | 4.4% (9,443) |
Number of families with income $10k - 20k:| Priest Point: | 1.8% (0) |
| Washington: | 3.5% (7,524) |
Number of families with income $20k - 30k:| Priest Point: | 2.9% (1) |
| State: | 5.6% (12,052) |
Number of families with income $30k - 40k:| Priest Point: | 2.9% (1) |
| State: | 8.3% (17,803) |
Number of families with income $40k - 50k:| Priest Point: | 6.2% (2) |
| State: | 7.7% (16,361) |
Number of families with income $50k - 60k:| Priest Point: | 6.1% (2) |
| Washington: | 7.9% (16,852) |
Number of families with income $60k - 75k:| Priest Point: | 12.4% (3) |
| State: | 11.4% (24,342) |
Number of families with income $75k - 100k:| Priest Point: | 13.5% (4) |
| State: | 14.4% (30,698) |
Number of families with income $100k - 125k:| Priest Point: | 9.1% (2) |
| State: | 11.4% (24,331) |
Number of families with income $125k - 150k:| Priest Point: | 7.9% (2) |
| State: | 7.5% (16,099) |
Number of families with income $150k - 200k:| Priest Point: | 1.6% (0) |
| Washington: | 8.2% (17,551) |
Number of families with income > $200k:| Priest Point: | 27.6% (7) |
| State: | 9.7% (20,653) |
Median non-family income in Priest Point in 2022:| Priest Point: | $47,229 |
| State: | $54,173 |
Change in median non-family income between 2000 and 2022:| Priest Point, Washington: | +122.3% |
| Washington: | +105.8% |
Median per capita income in Priest Point in 2022:| Priest Point: | $35,875 |
| State: | $28,252 |
Change in median per capita income between 2000 and 2022:| Priest Point, Washington: | +89.2% |
| State: | +150.2% |
Income statistics for American Indian and Alaska Native residents
Median household income in Priest Point, WA in 2022:| Priest Point: | $213,967 |
| State: | $71,255 |
Number of households with income < $10k:| Priest Point: | 5.9% (1,608) |
| State: | 5.9% (1,768) |
Number of households with income $10k - 20k:| Priest Point: | 9.0% (2,455) |
| State: | 8.9% (2,694) |
Number of households with income $20k - 30k:| Priest Point: | 8.0% (2,171) |
| State: | 8.0% (2,412) |
Number of households with income $30k - 40k:| Priest Point: | 7.7% (2,104) |
| State: | 7.7% (2,327) |
Number of households with income $40k - 50k:| Priest Point: | 5.9% (1,607) |
| State: | 5.8% (1,755) |
Number of households with income $50k - 60k:| Priest Point: | 7.5% (2,045) |
| State: | 7.5% (2,259) |
Number of households with income $60k - 75k:| Priest Point: | 8.8% (2,412) |
| State: | 8.8% (2,669) |
Number of households with income $75k - 100k:| Priest Point: | 12.7% (3,477) |
| State: | 12.8% (3,861) |
Number of households with income $100k - 125k:| Priest Point: | 12.0% (3,281) |
| State: | 12.0% (3,618) |
Number of households with income $125k - 150k:| Priest Point: | 8.6% (2,343) |
| State: | 8.6% (2,580) |
Number of households with income $150k - 200k:| Priest Point: | 5.9% (1,602) |
| State: | 5.9% (1,774) |
Number of households with income > $200k:| Priest Point: | 8.0% (2,194) |
| Washington: | 8.1% (2,447) |
Aggregate household income in Priest Point in 2022: $1,837,568
Median family income in Priest Point in 2022:| Priest Point: | $134,915 |
| State: | $79,010 |
Number of families with income $10k - 20k:| Priest Point: | 9.8% (1) |
| State: | 5.2% (1,056) |
Number of families with income $50k - 60k:| Priest Point: | 39.7% (6) |
| Washington: | 9.7% (1,973) |
Number of families with income $60k - 75k:| Priest Point: | 31.1% (5) |
| Washington: | 10.5% (2,124) |
Number of families with income $75k - 100k:| Priest Point: | 19.4% (3) |
| State: | 13.1% (2,669) |
Median per capita income in Priest Point in 2022:| Priest Point: | $28,526 |
| State: | $27,053 |
Change in median per capita income between 2000 and 2022:| Priest Point, Washington: | +85.4% |
| State: | +98.6% |
Income statistics for Multirace residents
Median household income in Priest Point, WA in 2022:| Priest Point: | $123,873 |
| State: | $84,303 |
Change in median household income between 2000 and 2022:| Priest Point, Washington: | +103.5% |
| State: | +125.7% |
Number of households with income < $10k:| Priest Point: | 2.9% (843) |
| Washington: | 4.3% (12,040) |
Number of households with income $10k - 20k:| Priest Point: | 5.9% (1,736) |
| State: | 6.6% (18,437) |
Number of households with income $20k - 30k:| Priest Point: | 2.4% (710) |
| Washington: | 5.2% (14,559) |
Number of households with income $30k - 40k:| Priest Point: | 5.3% (1,560) |
| State: | 6.7% (18,491) |
Number of households with income $40k - 50k:| Priest Point: | 4.2% (1,239) |
| Washington: | 6.3% (17,459) |
Number of households with income $50k - 60k:| Priest Point: | 4.5% (1,339) |
| State: | 6.9% (19,086) |
Number of households with income $60k - 75k:| Priest Point: | 12.2% (3,583) |
| State: | 9.1% (25,310) |
Number of households with income $75k - 100k:| Priest Point: | 11.1% (3,253) |
| State: | 13.5% (37,493) |
Number of households with income $100k - 125k:| Priest Point: | 13.4% (3,954) |
| State: | 10.7% (29,626) |
Number of households with income $125k - 150k:| Priest Point: | 11.9% (3,502) |
| State: | 8.6% (23,899) |
Number of households with income $150k - 200k:| Priest Point: | 13.1% (3,852) |
| State: | 10.2% (28,214) |
Number of households with income > $200k:| Priest Point: | 13.1% (3,858) |
| State: | 11.9% (32,947) |
Aggregate household income in Priest Point in 2022: $6,591,515
Median family income in Priest Point in 2022:| Priest Point: | $141,492 |
| State: | $95,629 |
Number of families with income $10k - 20k:| Priest Point: | 22.3% (6) |
| State: | 4.3% (7,519) |
Number of families with income $20k - 30k:| Priest Point: | 2.4% (1) |
| State: | 4.4% (7,775) |
Number of families with income $60k - 75k:| Priest Point: | 75.3% (21) |
| State: | 9.7% (17,113) |
Median non-family income in Priest Point in 2022:| Priest Point: | $139,762 |
| State: | $56,573 |
Change in median non-family income between 2000 and 2022:| Priest Point, Washington: | +128.2% |
| Washington: | +115.0% |
Median per capita income in Priest Point in 2022:| Priest Point: | $26,607 |
| State: | $32,496 |
Change in median per capita income between 2000 and 2022:| Priest Point, Washington: | +128.0% |
| Washington: | +156.8% |