The median household income in Pullman, WA in 2022 was $41,929, which was 117.8% less than the median annual income of $91,306 across the entire state of Washington. Compared to the median income of $20,652 in 2000 this represents an increase of 50.7%. The per capita income in 2022 was $28,602, which means an increase of 53.0% compared to 2000 when it was $13,448.
Whole page based on the data from 2000 / 2022 when the population of Pullman, Washington was 24,675 / 32,376
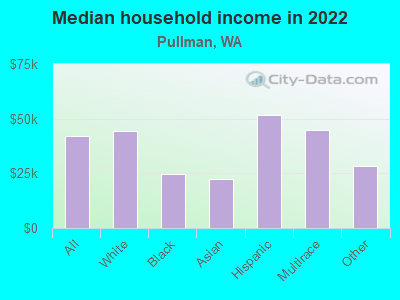
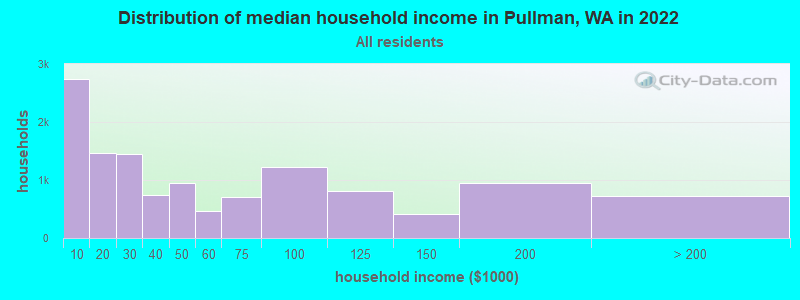
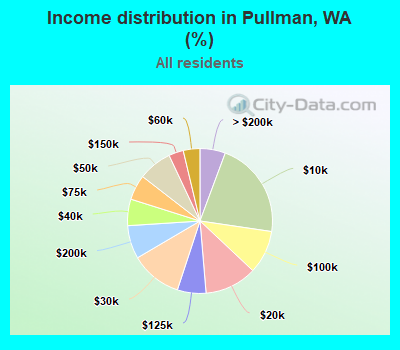
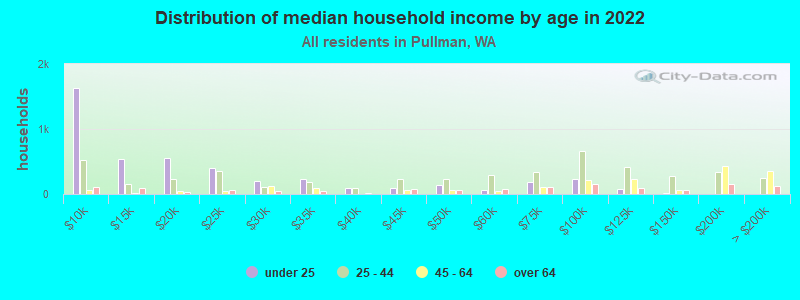
Income statistics for all residents
Median household income in Pullman, WA in 2022:
Pullman:
$41,929
State:
$91,306
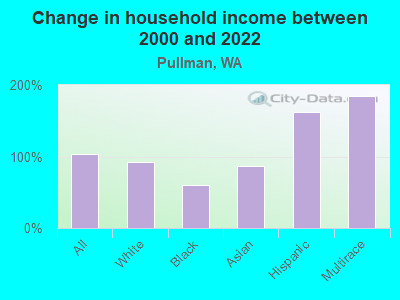
Change in median household income between 2000 and 2022:
Pullman, Washington:
+103.0%
State:
+99.5%
Number of households with income < $10k:
Pullman:
21.7% (2,738)
Washington:
4.5% (139,331)
Number of households with income $10k - 20k:
Pullman:
11.6% (1,472)
Washington:
5.0% (154,508)
Number of households with income $20k - 30k:
Pullman:
11.5% (1,450)
State:
5.4% (166,555)
Number of households with income $30k - 40k:
Pullman:
5.9% (745)
Washington:
5.5% (170,324)
Number of households with income $40k - 50k:
Pullman:
7.5% (950)
State:
6.0% (183,941)
Number of households with income $50k - 60k:
Pullman:
3.7% (470)
State:
6.1% (187,395)
Number of households with income $60k - 75k:
Pullman:
5.6% (711)
Washington:
8.7% (266,771)
Number of households with income $75k - 100k:
Pullman:
9.7% (1,223)
Washington:
13.1% (404,672)
Number of households with income $100k - 125k:
Pullman:
6.4% (809)
Washington:
11.0% (337,911)
Number of households with income $125k - 150k:
Pullman:
3.3% (413)
State:
8.0% (244,934)
Number of households with income $150k - 200k:
Pullman:
7.4% (941)
State:
10.5% (323,812)
Number of households with income > $200k:
Pullman:
5.7% (717)
State:
16.2% (499,799)
Aggregate household income in Pullman in 2022: $881,030,196
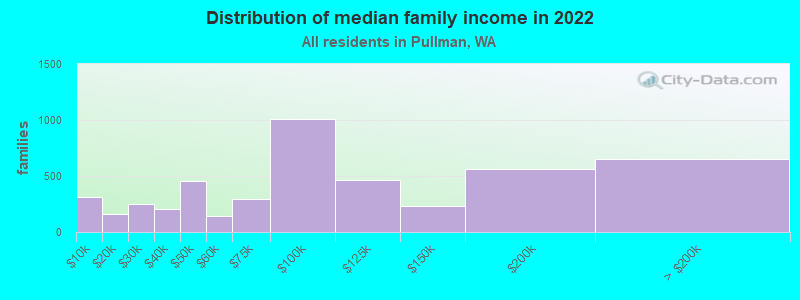
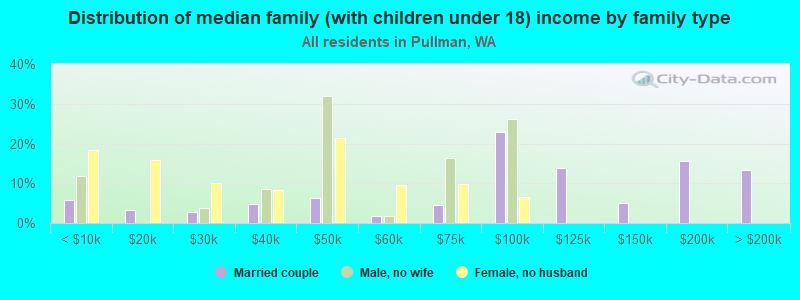
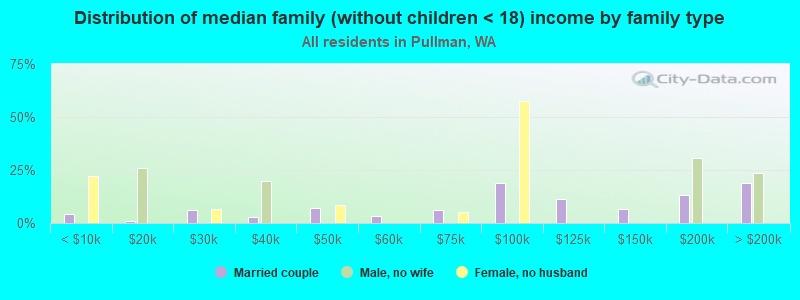
Median family income in Pullman in 2022:
Pullman:
$89,037
State:
$109,192
Number of families with income < $10k:
Pullman:
6.7% (316)
Washington:
2.9% (55,953)
Number of families with income $10k - 20k:
Pullman:
3.3% (157)
State:
2.6% (50,138)
Number of families with income $20k - 30k:
Pullman:
5.2% (246)
State:
3.2% (61,974)
Number of families with income $30k - 40k:
Pullman:
4.3% (201)
Washington:
4.1% (80,240)
Number of families with income $40k - 50k:
Pullman:
9.6% (452)
Washington:
4.9% (94,310)
Number of families with income $50k - 60k:
Pullman:
3.0% (142)
State:
5.3% (101,674)
Number of families with income $60k - 75k:
Pullman:
6.2% (293)
State:
8.2% (158,348)
Number of families with income $75k - 100k:
Pullman:
21.3% (1,006)
Washington:
13.8% (267,812)
Number of families with income $100k - 125k:
Pullman:
9.9% (468)
State:
12.4% (240,213)
Number of families with income $125k - 150k:
Pullman:
4.9% (231)
State:
9.3% (180,011)
Number of families with income $150k - 200k:
Pullman:
11.9% (563)
State:
13.0% (250,874)
Number of families with income > $200k:
Pullman:
13.7% (649)
State:
20.4% (393,898)
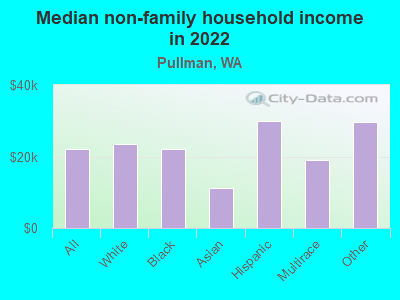
Median non-family income in Pullman in 2022:
Pullman:
$22,062
State:
$57,299
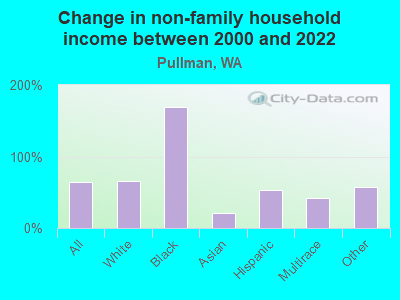
Change in median non-family income between 2000 and 2022:
Pullman, Washington:
+64.2%
Washington:
+94.9%
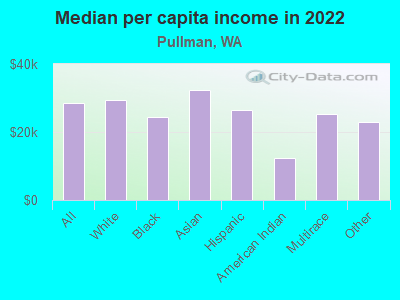
Median per capita income in Pullman in 2022:
Pullman:
$28,602
State:
$50,764
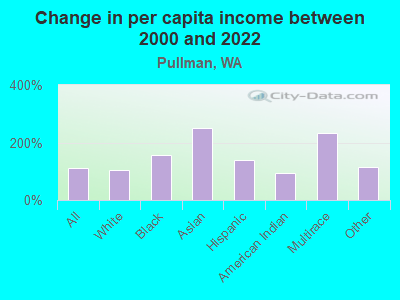
Change in median per capita income between 2000 and 2022:
Pullman, Washington:
+112.7%
State:
+121.0%
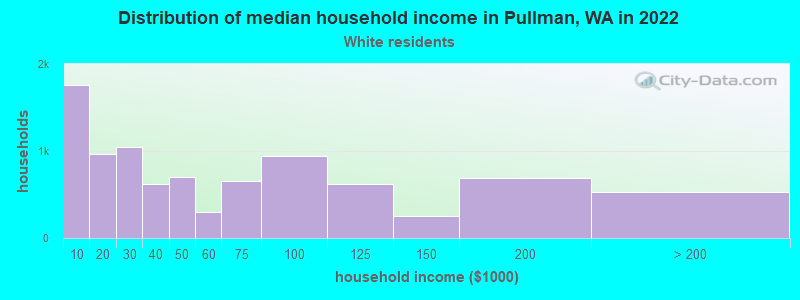
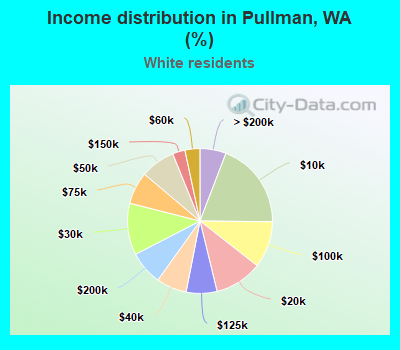
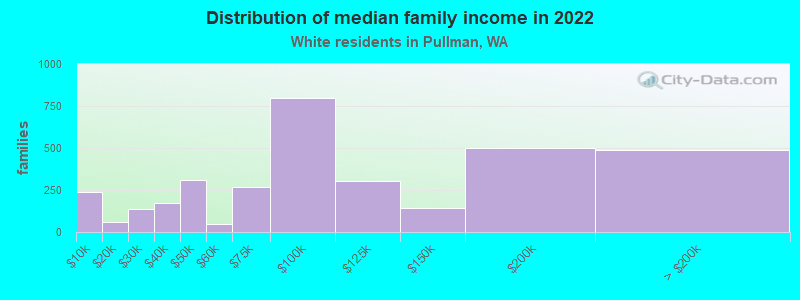
Income statistics for White residents
Median household income in Pullman, WA in 2022:
Pullman:
$44,189
Washington:
$91,916
Change in median household income between 2000 and 2022:
Pullman, Washington:
+92.9%
State:
+95.4%
Number of households with income < $10k:
Pullman:
19.3% (1,759)
Washington:
4.3% (95,850)
Number of households with income $10k - 20k:
Pullman:
10.6% (968)
State:
4.8% (106,421)
Number of households with income $20k - 30k:
Pullman:
11.5% (1,049)
State:
5.5% (122,860)
Number of households with income $30k - 40k:
Pullman:
6.8% (617)
State:
5.4% (119,627)
Number of households with income $40k - 50k:
Pullman:
7.7% (701)
State:
5.9% (132,276)
Number of households with income $50k - 60k:
Pullman:
3.3% (303)
Washington:
6.1% (136,212)
Number of households with income $60k - 75k:
Pullman:
7.2% (657)
State:
8.8% (196,086)
Number of households with income $75k - 100k:
Pullman:
10.4% (946)
State:
13.4% (299,192)
Number of households with income $100k - 125k:
Pullman:
6.9% (625)
State:
11.3% (252,209)
Number of households with income $125k - 150k:
Pullman:
2.8% (254)
State:
7.9% (175,962)
Number of households with income $150k - 200k:
Pullman:
7.5% (686)
Washington:
10.7% (239,156)
Number of households with income > $200k:
Pullman:
5.8% (531)
Washington:
16.1% (359,917)
Aggregate household income in Pullman in 2022: $650,714,351
Median family income in Pullman in 2022:
Pullman:
$90,042
Washington:
$112,511
Number of families with income < $10k:
Pullman:
6.9% (240)
Washington:
2.4% (33,676)
Number of families with income $10k - 20k:
Pullman:
1.7% (58)
Washington:
2.0% (28,228)
Number of families with income $20k - 30k:
Pullman:
3.9% (137)
Washington:
2.9% (39,288)
Number of families with income $30k - 40k:
Pullman:
5.0% (174)
State:
3.6% (50,190)
Number of families with income $40k - 50k:
Pullman:
9.0% (312)
State:
4.6% (63,009)
Number of families with income $50k - 60k:
Pullman:
1.4% (48)
State:
5.0% (69,270)
Number of families with income $60k - 75k:
Pullman:
7.7% (268)
State:
8.2% (112,369)
Number of families with income $75k - 100k:
Pullman:
23.0% (797)
State:
14.1% (194,214)
Number of families with income $100k - 125k:
Pullman:
8.7% (301)
Washington:
13.2% (182,184)
Number of families with income $125k - 150k:
Pullman:
4.0% (140)
State:
9.5% (130,928)
Number of families with income $150k - 200k:
Pullman:
14.4% (500)
State:
13.7% (188,621)
Number of families with income > $200k:
Pullman:
14.2% (491)
State:
20.8% (285,982)
Median non-family income in Pullman in 2022:
Pullman:
$23,619
State:
$56,103
Change in median non-family income between 2000 and 2022:
Pullman, Washington:
+66.1%
State:
+87.7%
Median per capita income in Pullman in 2022:
Pullman:
$29,484
State:
$55,212
Change in median per capita income between 2000 and 2022:
Pullman, Washington:
+105.8%
State:
+123.8%
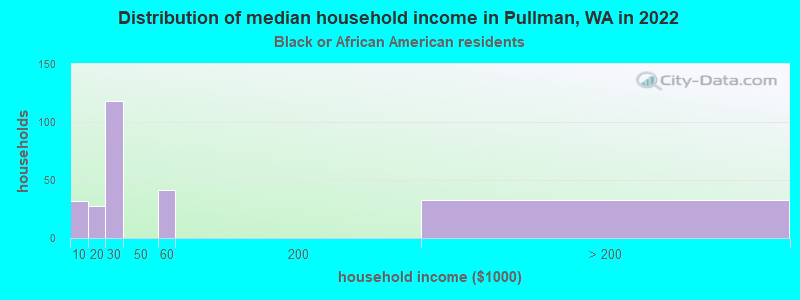
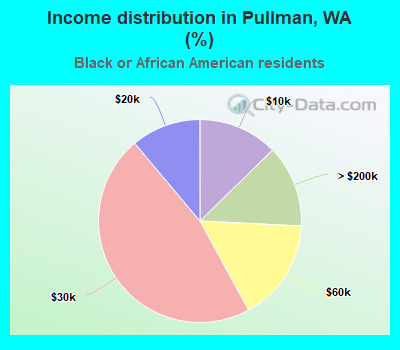
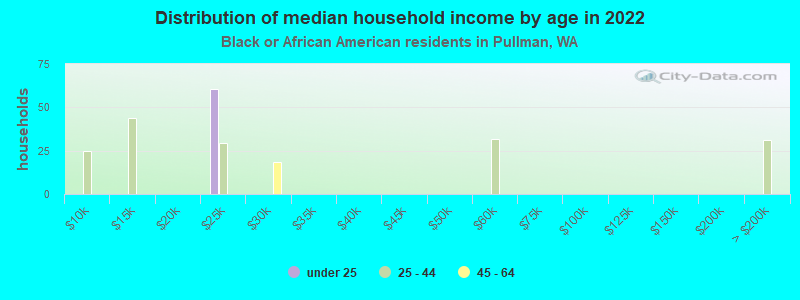
Income statistics for Black or African American residents
Median household income in Pullman, WA in 2022:
Pullman:
$24,870
State:
$68,202
Change in median household income between 2000 and 2022:
Pullman, Washington:
+60.1%
Washington:
+89.9%
Number of households with income < $10k:
Pullman:
12.7% (32)
State:
7.2% (8,014)
Number of households with income $10k - 20k:
Pullman:
11.1% (28)
State:
8.0% (8,904)
Number of households with income $20k - 30k:
Pullman:
46.8% (118)
Washington:
7.4% (8,207)
Number of households with income $30k - 40k:
Pullman:
0.0% (0)
State:
5.6% (6,220)
Number of households with income $40k - 50k:
Pullman:
0.0% (0)
State:
9.5% (10,585)
Number of households with income $50k - 60k:
Pullman:
16.3% (41)
State:
7.3% (8,078)
Number of households with income $60k - 75k:
Pullman:
0.0% (0)
Washington:
8.7% (9,704)
Number of households with income $75k - 100k:
Pullman:
0.0% (0)
State:
12.9% (14,315)
Number of households with income $100k - 125k:
Pullman:
0.0% (0)
State:
7.7% (8,592)
Number of households with income $125k - 150k:
Pullman:
0.0% (0)
State:
8.9% (9,840)
Number of households with income $150k - 200k:
Pullman:
0.0% (0)
Washington:
7.6% (8,434)
Number of households with income > $200k:
Pullman:
13.1% (33)
State:
9.1% (10,075)
Aggregate household income in Pullman in 2022: $15,854,706
Median non-family income in Pullman in 2022:
Pullman:
$22,146
Washington:
$49,169
Median per capita income in Pullman in 2022:
Pullman:
$24,367
State:
$38,209
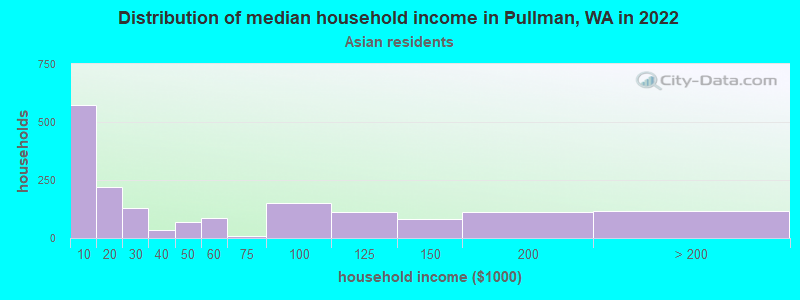
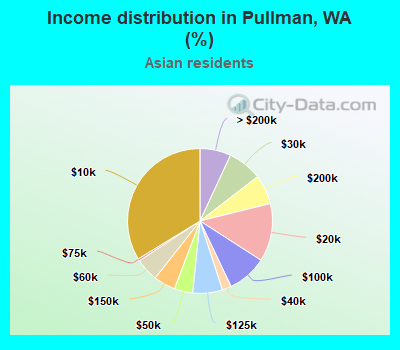
Income statistics for Asian residents
Median household income in Pullman, WA in 2022:
Pullman:
$22,198
Washington:
$125,692
Change in median household income between 2000 and 2022:
Pullman, Washington:
+86.6%
Washington:
+164.5%
Number of households with income < $10k:
Pullman:
33.7% (575)
State:
4.9% (14,099)
Number of households with income $10k - 20k:
Pullman:
13.0% (221)
State:
3.5% (9,873)
Number of households with income $20k - 30k:
Pullman:
7.6% (130)
State:
2.9% (8,352)
Number of households with income $30k - 40k:
Pullman:
2.1% (35)
State:
4.0% (11,415)
Number of households with income $40k - 50k:
Pullman:
4.1% (70)
State:
4.0% (11,421)
Number of households with income $50k - 60k:
Pullman:
5.2% (88)
State:
4.2% (12,100)
Number of households with income $60k - 75k:
Pullman:
0.5% (8)
State:
6.3% (17,903)
Number of households with income $75k - 100k:
Pullman:
8.9% (151)
Washington:
10.4% (29,663)
Number of households with income $100k - 125k:
Pullman:
6.6% (113)
State:
9.4% (26,839)
Number of households with income $125k - 150k:
Pullman:
4.9% (83)
Washington:
8.5% (24,200)
Number of households with income $150k - 200k:
Pullman:
6.6% (112)
Washington:
12.6% (35,976)
Number of households with income > $200k:
Pullman:
6.9% (118)
State:
29.2% (83,109)
Aggregate household income in Pullman in 2022: $117,961,231
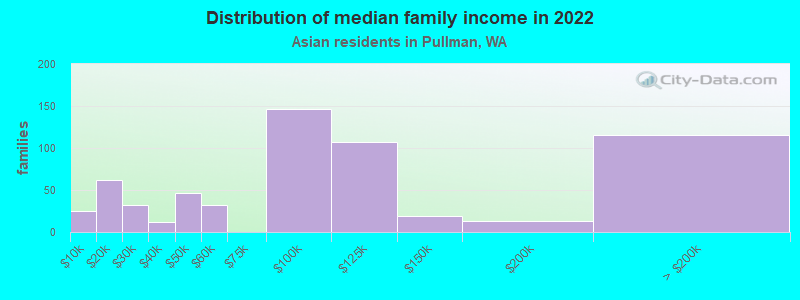
Median family income in Pullman in 2022:
Pullman:
$80,259
State:
$143,595
Number of families with income < $10k:
Pullman:
4.1% (25)
State:
2.9% (5,479)
Number of families with income $10k - 20k:
Pullman:
10.2% (62)
Washington:
2.2% (4,150)
Number of families with income $20k - 30k:
Pullman:
5.3% (32)
Washington:
1.9% (3,558)
Number of families with income $30k - 40k:
Pullman:
1.9% (12)
State:
3.1% (5,734)
Number of families with income $40k - 50k:
Pullman:
7.5% (46)
State:
3.6% (6,707)
Number of families with income $50k - 60k:
Pullman:
5.3% (32)
Washington:
4.1% (7,663)
Number of families with income $75k - 100k:
Pullman:
24.1% (147)
State:
11.7% (21,919)
Number of families with income $100k - 125k:
Pullman:
17.5% (107)
Washington:
9.3% (17,280)
Number of families with income $125k - 150k:
Pullman:
3.1% (19)
Washington:
8.4% (15,602)
Number of families with income $150k - 200k:
Pullman:
2.1% (13)
State:
13.3% (24,789)
Number of families with income > $200k:
Pullman:
18.8% (115)
Washington:
34.4% (64,250)
Median non-family income in Pullman in 2022:
Pullman:
$11,326
State:
$84,971
Change in median non-family income between 2000 and 2022:
Pullman, Washington:
+21.1%
Washington:
+211.1%
Median per capita income in Pullman in 2022:
Pullman:
$32,419
State:
$67,666
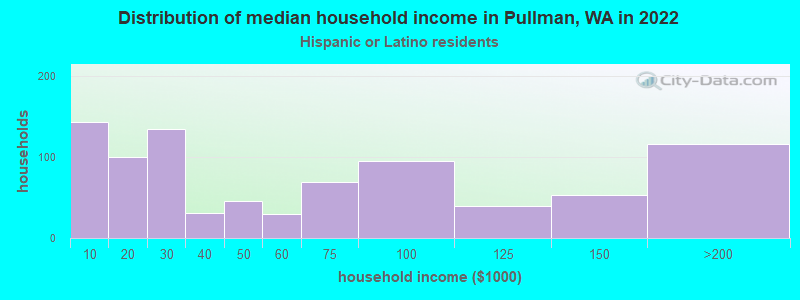
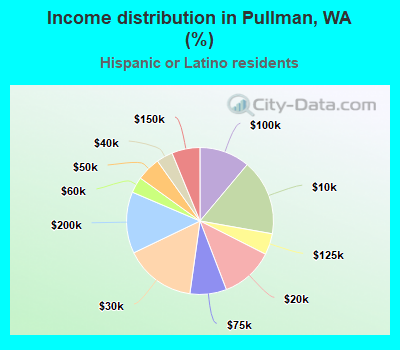
Income statistics for Hispanic or Latino residents
Median household income in Pullman, WA in 2022:
Pullman:
$51,903
State:
$74,770
Number of households with income < $10k:
Pullman:
16.7% (143)
State:
4.9% (14,456)
Number of households with income $10k - 20k:
Pullman:
11.7% (100)
Washington:
5.3% (15,449)
Number of households with income $20k - 30k:
Pullman:
15.7% (134)
State:
6.8% (20,016)
Number of households with income $30k - 40k:
Pullman:
3.6% (31)
State:
7.7% (22,548)
Number of households with income $40k - 50k:
Pullman:
5.3% (45)
Washington:
7.3% (21,450)
Number of households with income $50k - 60k:
Pullman:
3.5% (30)
State:
7.7% (22,744)
Number of households with income $60k - 75k:
Pullman:
8.1% (69)
State:
10.5% (30,737)
Number of households with income $75k - 100k:
Pullman:
11.1% (95)
State:
14.9% (43,843)
Number of households with income $100k - 125k:
Pullman:
4.7% (40)
State:
11.1% (32,554)
Number of households with income $125k - 150k:
Pullman:
6.2% (53)
State:
7.4% (21,624)
Number of households with income $150k - 200k:
Pullman:
13.6% (116)
State:
7.3% (21,360)
Number of households with income > $200k:
Pullman:
0.0% (0)
Washington:
9.2% (27,055)
Aggregate household income in Pullman in 2022: $58,443,096
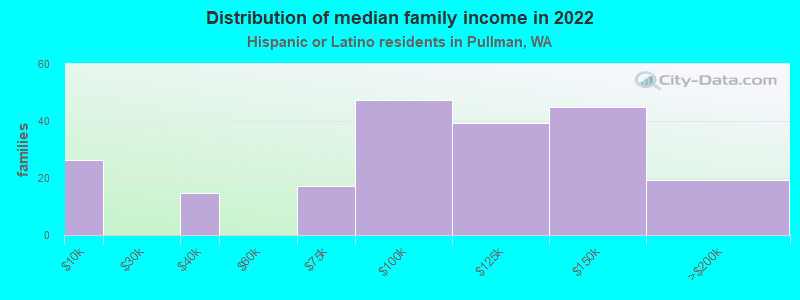
Median family income in Pullman in 2022:
Pullman:
$106,549
State:
$76,866
Number of families with income < $10k:
Pullman:
12.6% (26)
Washington:
4.4% (9,443)
Number of families with income $30k - 40k:
Pullman:
7.0% (15)
Washington:
8.3% (17,803)
Number of families with income $60k - 75k:
Pullman:
8.2% (17)
Washington:
11.4% (24,342)
Number of families with income $75k - 100k:
Pullman:
22.7% (47)
State:
14.4% (30,698)
Number of families with income $100k - 125k:
Pullman:
18.7% (39)
Washington:
11.4% (24,331)
Number of families with income $125k - 150k:
Pullman:
21.5% (45)
Washington:
7.5% (16,099)
Number of families with income $150k - 200k:
Pullman:
9.3% (19)
Washington:
8.2% (17,551)
Median non-family income in Pullman in 2022:
Pullman:
$29,934
Washington:
$54,173
Change in median non-family income between 2000 and 2022:
Pullman, Washington:
+53.4%
State:
+105.8%
Median per capita income in Pullman in 2022:
Pullman:
$26,417
State:
$28,252
Change in median per capita income between 2000 and 2022:
Pullman, Washington:
+140.1%
Washington:
+150.2%
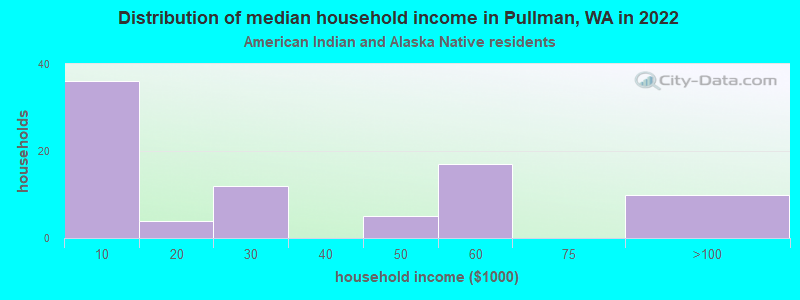
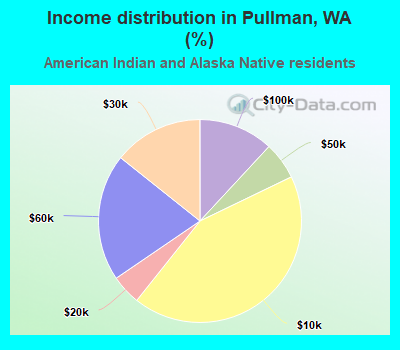
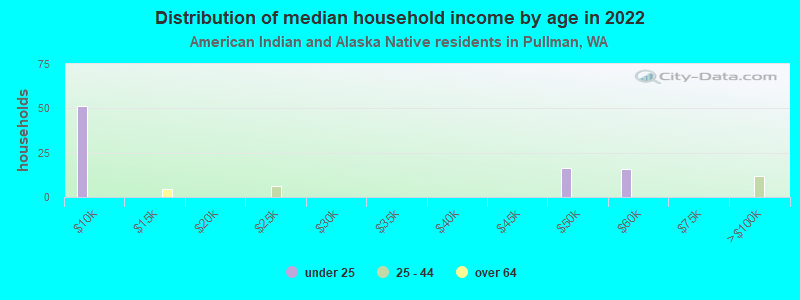
Income statistics for American Indian and Alaska Native residents
Number of households with income < $10k:
Pullman:
42.9% (36)
State:
5.9% (1,768)
Number of households with income $10k - 20k:
Pullman:
4.8% (4)
State:
8.9% (2,694)
Number of households with income $20k - 30k:
Pullman:
14.3% (12)
State:
8.0% (2,412)
Number of households with income $30k - 40k:
Pullman:
0.0% (0)
Washington:
7.7% (2,327)
Number of households with income $40k - 50k:
Pullman:
6.0% (5)
State:
5.8% (1,755)
Number of households with income $50k - 60k:
Pullman:
20.2% (17)
Washington:
7.5% (2,259)
Number of households with income $60k - 75k:
Pullman:
0.0% (0)
State:
8.8% (2,669)
Number of households with income $75k - 100k:
Pullman:
11.9% (10)
State:
12.8% (3,861)
Number of households with income $100k - 125k:
Pullman:
0.0% (0)
Washington:
12.0% (3,618)
Number of households with income $125k - 150k:
Pullman:
0.0% (0)
State:
8.6% (2,580)
Number of households with income $150k - 200k:
Pullman:
0.0% (0)
State:
5.9% (1,774)
Number of households with income > $200k:
Pullman:
0.0% (0)
State:
8.1% (2,447)
Aggregate household income in Pullman in 2022: $3,034,427
Median per capita income in Pullman in 2022:
Pullman:
$12,453
Washington:
$27,053
Change in median per capita income between 2000 and 2022:
Pullman, Washington:
+93.2%
State:
+98.6%
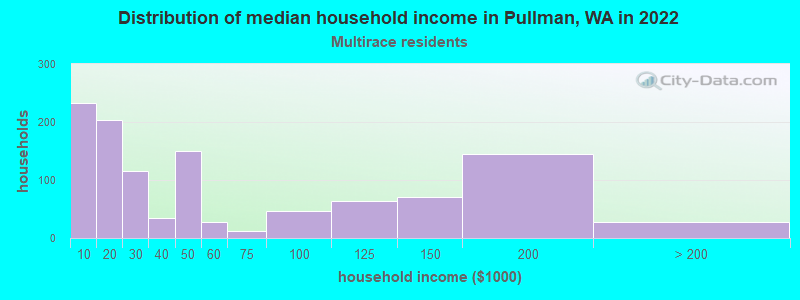
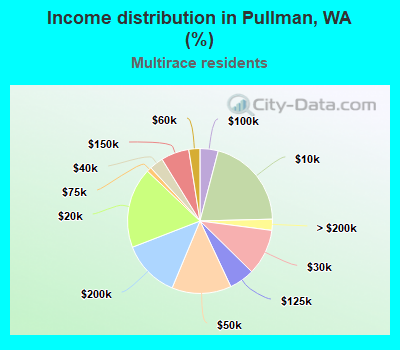
Income statistics for Multirace residents
Median household income in Pullman, WA in 2022:
Pullman:
$44,771
State:
$84,303
Number of households with income < $10k:
Pullman:
20.5% (232)
Washington:
4.3% (12,040)
Number of households with income $10k - 20k:
Pullman:
18.0% (203)
State:
6.6% (18,437)
Number of households with income $20k - 30k:
Pullman:
10.3% (116)
State:
5.2% (14,559)
Number of households with income $30k - 40k:
Pullman:
3.1% (35)
State:
6.7% (18,491)
Number of households with income $40k - 50k:
Pullman:
13.3% (150)
State:
6.3% (17,459)
Number of households with income $50k - 60k:
Pullman:
2.5% (28)
State:
6.9% (19,086)
Number of households with income $60k - 75k:
Pullman:
1.1% (12)
State:
9.1% (25,310)
Number of households with income $75k - 100k:
Pullman:
4.1% (46)
State:
13.5% (37,493)
Number of households with income $100k - 125k:
Pullman:
5.7% (64)
Washington:
10.7% (29,626)
Number of households with income $125k - 150k:
Pullman:
6.3% (71)
State:
8.6% (23,899)
Number of households with income $150k - 200k:
Pullman:
12.8% (145)
State:
10.2% (28,214)
Number of households with income > $200k:
Pullman:
2.5% (28)
State:
11.9% (32,947)
Aggregate household income in Pullman in 2022: $78,395,862
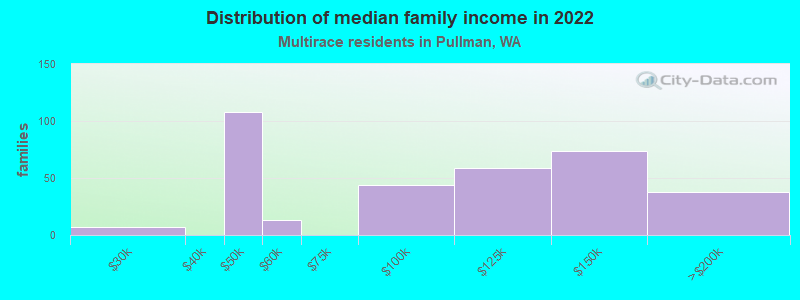
Median family income in Pullman in 2022:
Pullman:
$93,657
Washington:
$95,629
Number of families with income $20k - 30k:
Pullman:
2.1% (7)
State:
4.4% (7,775)
Number of families with income $40k - 50k:
Pullman:
31.5% (108)
State:
5.9% (10,412)
Number of families with income $50k - 60k:
Pullman:
3.8% (13)
Washington:
5.6% (9,922)
Number of families with income $75k - 100k:
Pullman:
12.9% (44)
State:
13.6% (23,984)
Number of families with income $100k - 125k:
Pullman:
17.2% (59)
State:
10.4% (18,288)
Number of families with income $125k - 150k:
Pullman:
21.5% (74)
Washington:
10.5% (18,481)
Number of families with income $150k - 200k:
Pullman:
11.0% (38)
State:
11.9% (20,852)
Median non-family income in Pullman in 2022:
Pullman:
$19,114
State:
$56,573
Change in median non-family income between 2000 and 2022:
Pullman, Washington:
+42.2%
Washington:
+115.0%
Median per capita income in Pullman in 2022:
Pullman:
$25,358
State:
$32,496
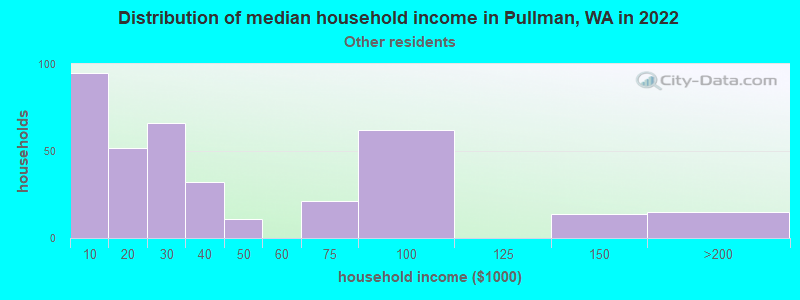
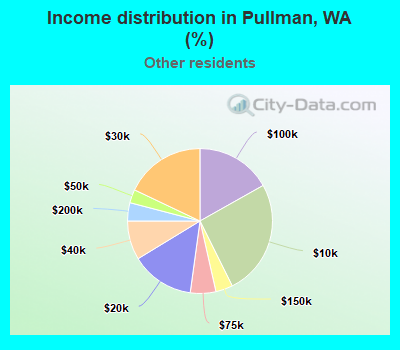
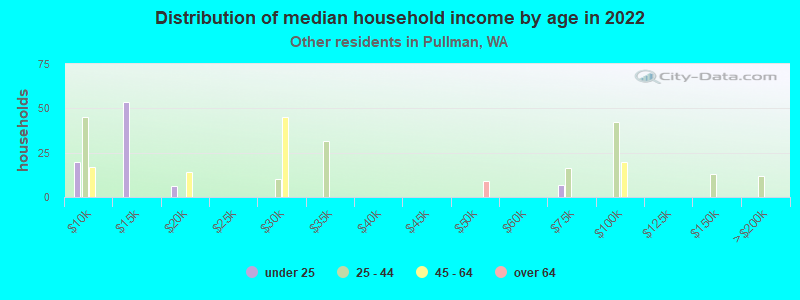
Income statistics for other residents
Median household income in Pullman, WA in 2022:
Pullman:
$28,499
State:
$69,545
Number of households with income < $10k:
Pullman:
25.8% (95)
State:
5.3% (6,540)
Number of households with income $10k - 20k:
Pullman:
14.1% (52)
Washington:
6.0% (7,385)
Number of households with income $20k - 30k:
Pullman:
17.9% (66)
State:
7.5% (9,289)
Number of households with income $30k - 40k:
Pullman:
8.7% (32)
State:
8.9% (11,015)
Number of households with income $40k - 50k:
Pullman:
3.0% (11)
State:
7.6% (9,399)
Number of households with income $50k - 60k:
Pullman:
0.0% (0)
State:
7.2% (8,867)
Number of households with income $60k - 75k:
Pullman:
5.7% (21)
Washington:
10.5% (13,032)
Number of households with income $75k - 100k:
Pullman:
16.8% (62)
Washington:
14.6% (18,007)
Number of households with income $100k - 125k:
Pullman:
0.0% (0)
Washington:
12.2% (15,128)
Number of households with income $125k - 150k:
Pullman:
3.8% (14)
Washington:
5.6% (6,950)
Number of households with income $150k - 200k:
Pullman:
4.1% (15)
State:
7.1% (8,749)
Number of households with income > $200k:
Pullman:
0.0% (0)
State:
7.5% (9,208)
Aggregate household income in Pullman in 2022: $16,012,568
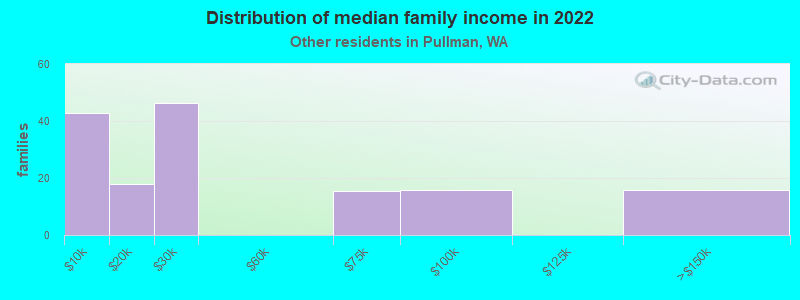
Median family income in Pullman in 2022:
Pullman:
$28,385
State:
$72,588
Number of families with income < $10k:
Pullman:
27.7% (43)
Washington:
5.5% (5,287)
Number of families with income $10k - 20k:
Pullman:
11.6% (18)
State:
4.0% (3,814)
Number of families with income $20k - 30k:
Pullman:
30.1% (46)
Washington:
6.6% (6,293)
Number of families with income $60k - 75k:
Pullman:
10.1% (16)
State:
10.3% (9,864)
Number of families with income $75k - 100k:
Pullman:
10.2% (16)
State:
14.5% (13,800)
Number of families with income $125k - 150k:
Pullman:
10.2% (16)
State:
6.0% (5,679)
Median non-family income in Pullman in 2022:
Pullman:
$29,715
State:
$44,777
Change in median non-family income between 2000 and 2022:
Pullman, Washington:
+58.5%
State:
+84.2%
Median per capita income in Pullman in 2022:
Pullman:
$22,959
State:
$27,542
Change in median per capita income between 2000 and 2022:
Pullman, Washington:
+115.7%
Washington:
+167.8%
Discuss Pullman, Washington (WA) on our hugely popular Washington forum.