The median household income in Raymore, MO in 2022 was $89,662, which was 27.7% greater than the median annual income of $64,811 across the entire state of Missouri. Compared to the median income of $56,007 in 2000 this represents an increase of 37.5%. The per capita income in 2022 was $39,021, which means an increase of 42.3% compared to 2000 when it was $22,496.
Whole page based on the data from 2000 / 2022 when the population of Raymore, Missouri was 11,146 / 23,702
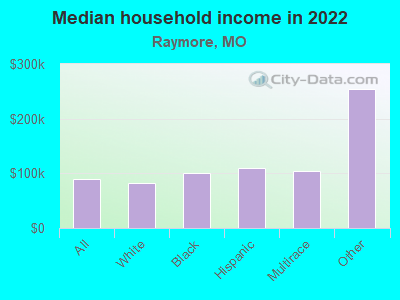
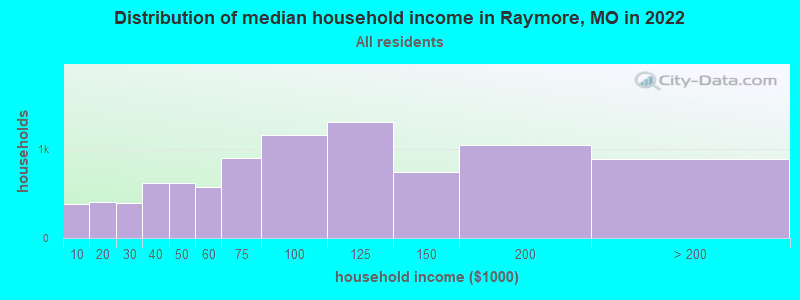
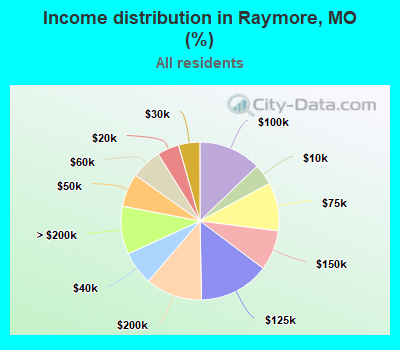
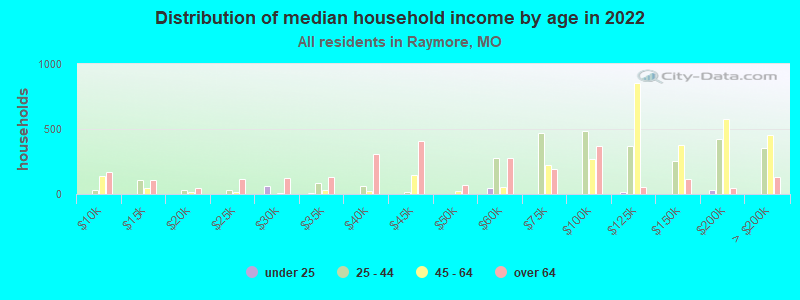
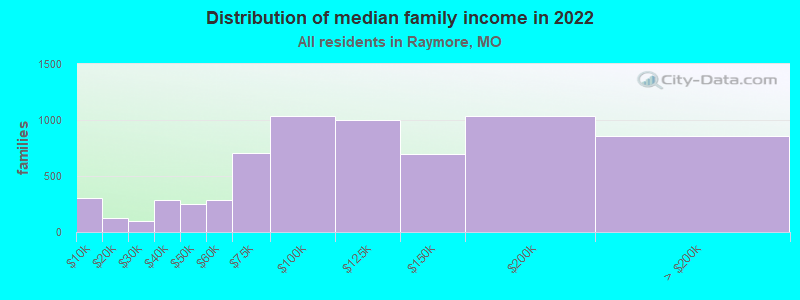
Income statistics for all residents
Median household income in Raymore, MO in 2022:
Raymore:
$89,663
State:
$64,811
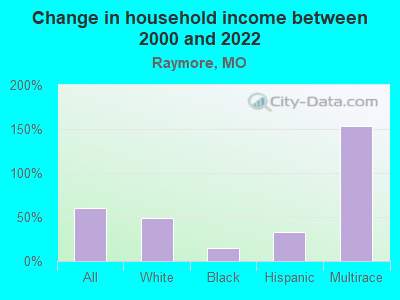
Change in median household income between 2000 and 2022:
Raymore, Missouri:
+60.1%
State:
+70.9%
Number of households with income < $10k:
Raymore:
4.3% (386)
State:
5.7% (144,208)
Number of households with income $10k - 20k:
Raymore:
4.5% (405)
State:
8.2% (205,541)
Number of households with income $20k - 30k:
Raymore:
4.4% (394)
State:
7.8% (197,162)
Number of households with income $30k - 40k:
Raymore:
6.9% (622)
Missouri:
8.7% (220,088)
Number of households with income $40k - 50k:
Raymore:
6.8% (613)
Missouri:
8.2% (206,651)
Number of households with income $50k - 60k:
Raymore:
6.3% (567)
State:
7.8% (196,521)
Number of households with income $60k - 75k:
Raymore:
9.9% (894)
State:
10.1% (255,043)
Number of households with income $75k - 100k:
Raymore:
12.8% (1,156)
State:
13.4% (337,210)
Number of households with income $100k - 125k:
Raymore:
14.4% (1,301)
State:
9.8% (247,187)
Number of households with income $125k - 150k:
Raymore:
8.2% (741)
Missouri:
6.4% (160,260)
Number of households with income $150k - 200k:
Raymore:
11.6% (1,044)
State:
6.9% (174,947)
Number of households with income > $200k:
Raymore:
9.9% (888)
Missouri:
7.0% (177,014)
Aggregate household income in Raymore in 2022: $934,092,043
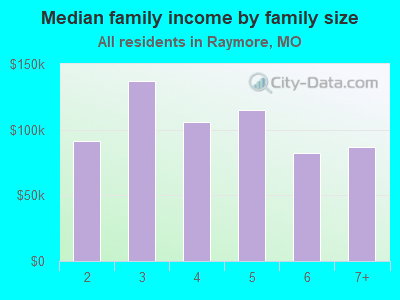
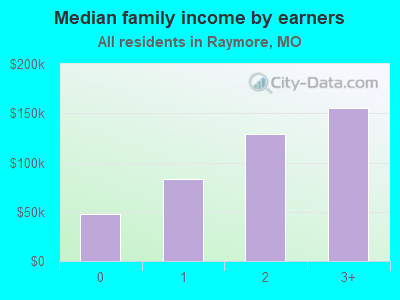
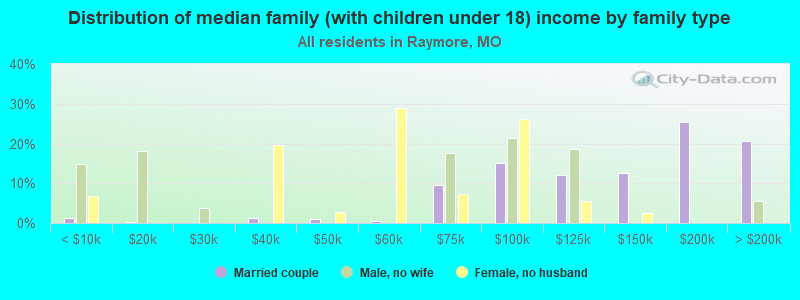
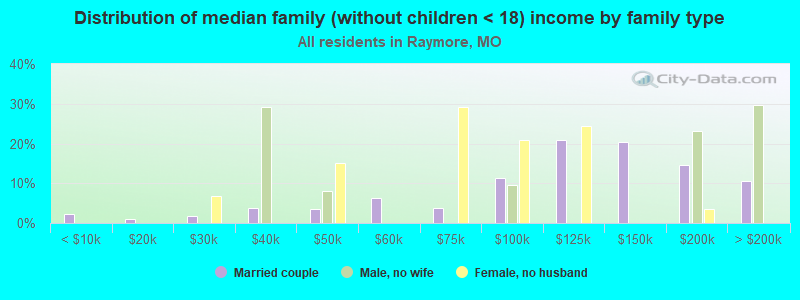
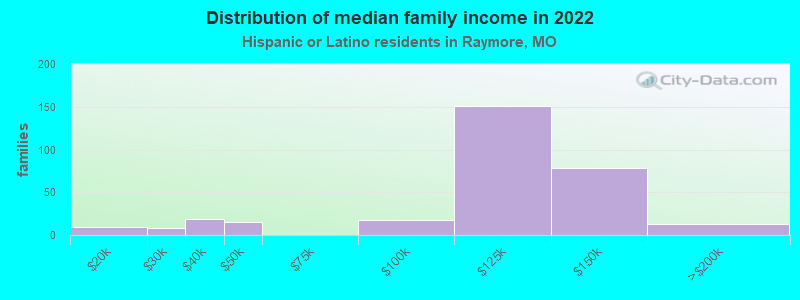
Median family income in Raymore in 2022:
Raymore:
$104,716
Missouri:
$83,420
Number of families with income < $10k:
Raymore:
4.5% (301)
State:
3.2% (49,878)
Number of families with income $10k - 20k:
Raymore:
1.8% (123)
Missouri:
3.9% (61,082)
Number of families with income $20k - 30k:
Raymore:
1.5% (98)
Missouri:
5.4% (84,243)
Number of families with income $30k - 40k:
Raymore:
4.3% (286)
Missouri:
6.7% (104,645)
Number of families with income $40k - 50k:
Raymore:
3.7% (248)
State:
7.2% (113,014)
Number of families with income $50k - 60k:
Raymore:
4.3% (289)
State:
7.4% (116,279)
Number of families with income $60k - 75k:
Raymore:
10.6% (707)
State:
10.5% (165,163)
Number of families with income $75k - 100k:
Raymore:
15.5% (1,039)
Missouri:
15.5% (243,177)
Number of families with income $100k - 125k:
Raymore:
15.0% (1,004)
State:
12.3% (192,410)
Number of families with income $125k - 150k:
Raymore:
10.4% (697)
Missouri:
8.5% (133,872)
Number of families with income $150k - 200k:
Raymore:
15.5% (1,033)
State:
9.7% (152,662)
Number of families with income > $200k:
Raymore:
12.8% (858)
State:
9.8% (153,310)
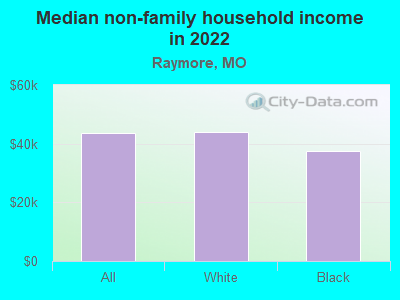
Median non-family income in Raymore in 2022:
Raymore:
$43,526
Missouri:
$38,435
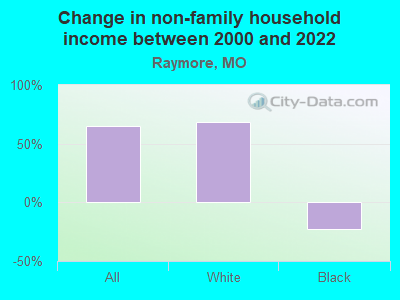
Change in median non-family income between 2000 and 2022:
Raymore, Missouri:
+65.2%
Missouri:
+72.4%
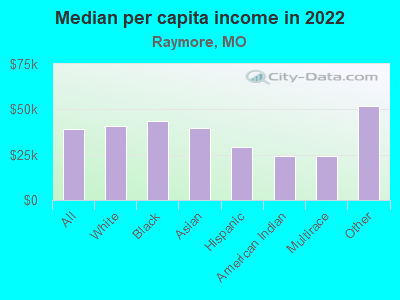
Median per capita income in Raymore in 2022:
Raymore:
$39,021
State:
$36,640
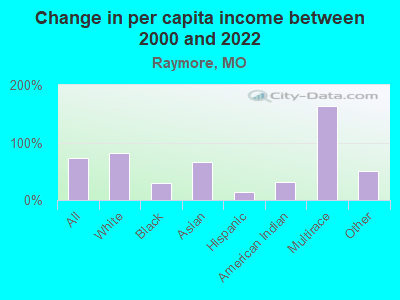
Change in median per capita income between 2000 and 2022:
Raymore, Missouri:
+73.5%
Missouri:
+83.8%
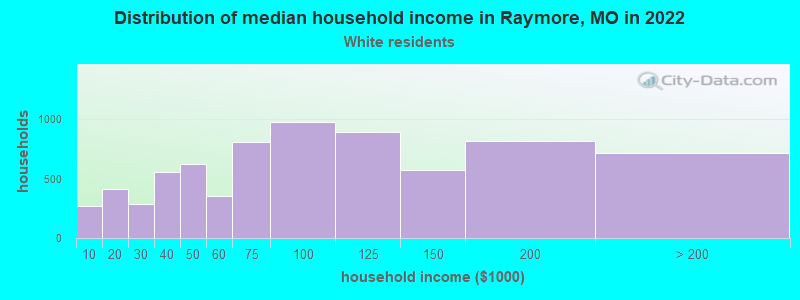
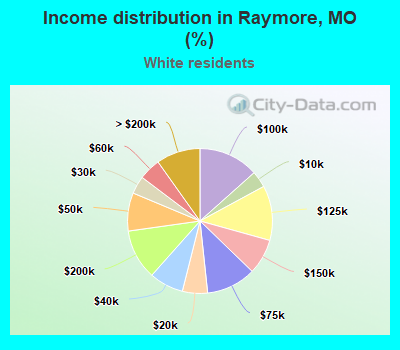
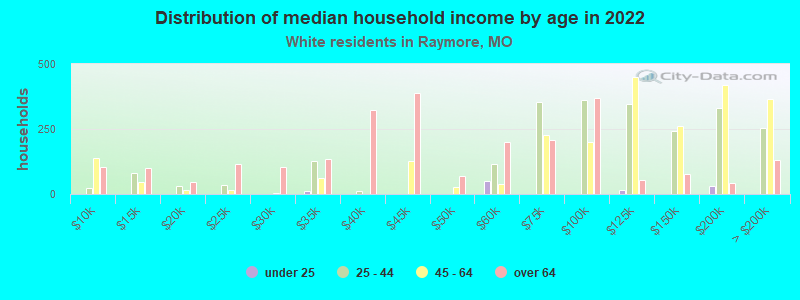
Income statistics for White residents
Median household income in Raymore, MO in 2022:
Raymore:
$82,922
State:
$68,771
Change in median household income between 2000 and 2022:
Raymore, Missouri:
+49.2%
State:
+73.5%
Number of households with income < $10k:
Raymore:
3.7% (268)
State:
4.9% (98,067)
Number of households with income $10k - 20k:
Raymore:
5.6% (409)
State:
7.3% (146,436)
Number of households with income $20k - 30k:
Raymore:
4.0% (290)
State:
7.6% (153,201)
Number of households with income $30k - 40k:
Raymore:
7.6% (555)
State:
8.4% (169,042)
Number of households with income $40k - 50k:
Raymore:
8.5% (620)
State:
8.0% (160,724)
Number of households with income $50k - 60k:
Raymore:
4.9% (355)
Missouri:
7.7% (155,924)
Number of households with income $60k - 75k:
Raymore:
11.1% (806)
State:
10.2% (205,080)
Number of households with income $75k - 100k:
Raymore:
13.4% (976)
Missouri:
14.1% (283,507)
Number of households with income $100k - 125k:
Raymore:
12.2% (890)
State:
10.2% (205,898)
Number of households with income $125k - 150k:
Raymore:
7.9% (575)
State:
6.7% (135,287)
Number of households with income $150k - 200k:
Raymore:
11.2% (816)
Missouri:
7.4% (148,450)
Number of households with income > $200k:
Raymore:
9.8% (715)
State:
7.6% (153,213)
Aggregate household income in Raymore in 2022: $744,978,227
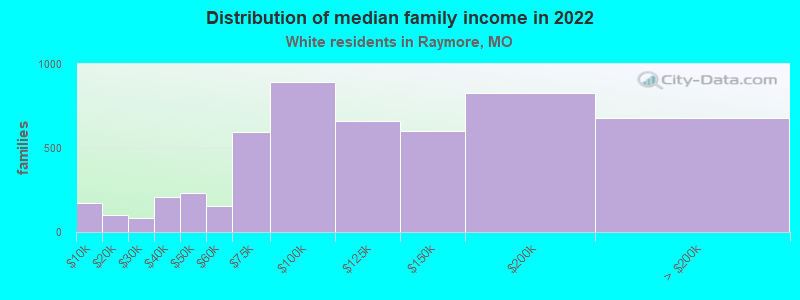
Median family income in Raymore in 2022:
Raymore:
$107,149
Missouri:
$87,438
Number of families with income < $10k:
Raymore:
3.3% (175)
Missouri:
2.5% (31,792)
Number of families with income $10k - 20k:
Raymore:
1.9% (100)
State:
3.3% (41,944)
Number of families with income $20k - 30k:
Raymore:
1.6% (84)
State:
5.0% (63,337)
Number of families with income $30k - 40k:
Raymore:
4.0% (206)
State:
6.2% (78,970)
Number of families with income $40k - 50k:
Raymore:
4.5% (235)
State:
6.8% (86,154)
Number of families with income $50k - 60k:
Raymore:
2.9% (153)
Missouri:
7.3% (92,637)
Number of families with income $60k - 75k:
Raymore:
11.4% (595)
Missouri:
10.4% (131,937)
Number of families with income $75k - 100k:
Raymore:
17.2% (894)
State:
16.2% (206,529)
Number of families with income $100k - 125k:
Raymore:
12.7% (662)
State:
12.9% (164,015)
Number of families with income $125k - 150k:
Raymore:
11.6% (602)
State:
8.9% (113,643)
Number of families with income $150k - 200k:
Raymore:
15.9% (827)
State:
10.1% (129,106)
Number of families with income > $200k:
Raymore:
13.0% (676)
State:
10.4% (132,544)
Median non-family income in Raymore in 2022:
Raymore:
$43,824
State:
$40,207
Change in median non-family income between 2000 and 2022:
Raymore, Missouri:
+68.5%
State:
+75.5%
Median per capita income in Raymore in 2022:
Raymore:
$40,970
State:
$39,160
Change in median per capita income between 2000 and 2022:
Raymore, Missouri:
+81.5%
State:
+86.9%
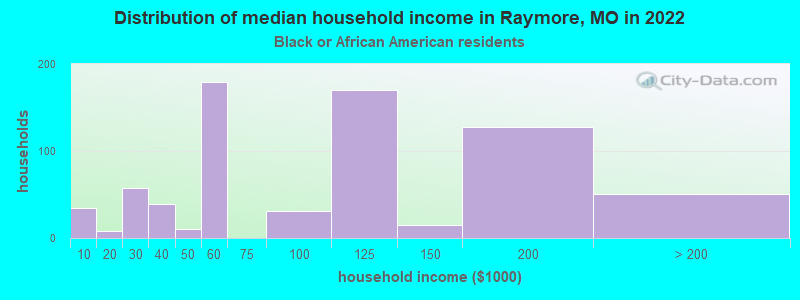
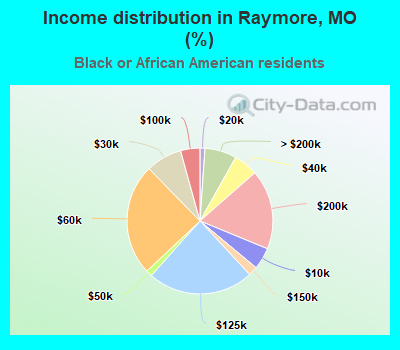
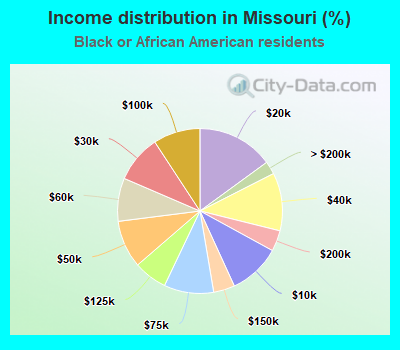
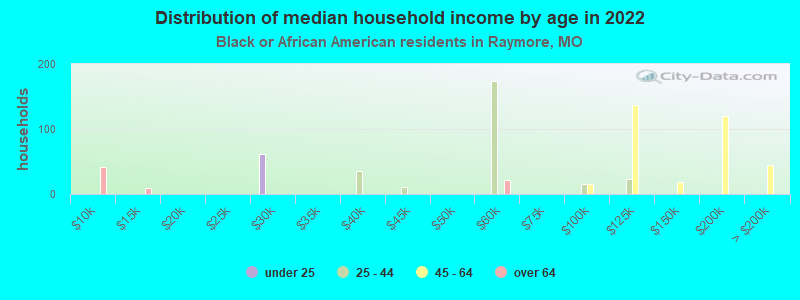
Income statistics for Black or African American residents
Median household income in Raymore, MO in 2022:
Raymore:
$100,679
State:
$44,631
Change in median household income between 2000 and 2022:
Raymore, Missouri:
+15.3%
State:
+63.7%
Number of households with income < $10k:
Raymore:
4.8% (35)
Missouri:
10.2% (27,862)
Number of households with income $10k - 20k:
Raymore:
1.1% (8)
Missouri:
15.0% (40,902)
Number of households with income $20k - 30k:
Raymore:
8.0% (58)
Missouri:
9.3% (25,464)
Number of households with income $30k - 40k:
Raymore:
5.4% (39)
State:
11.4% (31,039)
Number of households with income $40k - 50k:
Raymore:
1.4% (10)
Missouri:
9.4% (25,559)
Number of households with income $50k - 60k:
Raymore:
24.7% (179)
State:
8.5% (23,091)
Number of households with income $60k - 75k:
Raymore:
0.0% (0)
State:
9.7% (26,618)
Number of households with income $75k - 100k:
Raymore:
4.3% (31)
State:
9.2% (25,189)
Number of households with income $100k - 125k:
Raymore:
23.5% (170)
State:
6.6% (17,927)
Number of households with income $125k - 150k:
Raymore:
2.1% (15)
Missouri:
4.2% (11,418)
Number of households with income $150k - 200k:
Raymore:
17.7% (128)
State:
4.1% (11,192)
Number of households with income > $200k:
Raymore:
7.0% (51)
State:
2.5% (6,954)
Aggregate household income in Raymore in 2022: $104,237,493
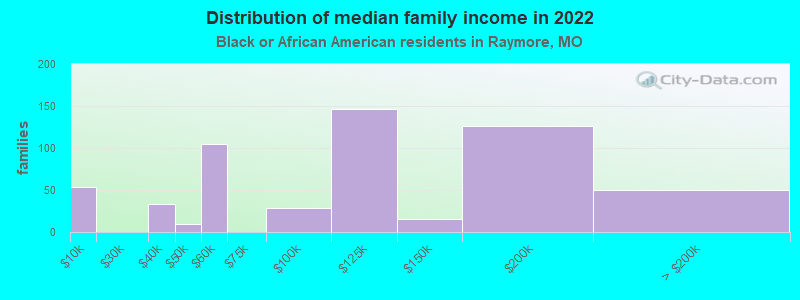
Median family income in Raymore in 2022:
Raymore:
$106,652
State:
$56,934
Number of families with income < $10k:
Raymore:
9.5% (54)
State:
7.6% (11,240)
Number of families with income $30k - 40k:
Raymore:
5.8% (33)
State:
9.9% (14,714)
Number of families with income $40k - 50k:
Raymore:
1.6% (9)
Missouri:
10.2% (15,092)
Number of families with income $50k - 60k:
Raymore:
18.4% (105)
Missouri:
8.5% (12,605)
Number of families with income $75k - 100k:
Raymore:
5.1% (29)
State:
10.8% (16,010)
Number of families with income $100k - 125k:
Raymore:
25.7% (147)
Missouri:
7.8% (11,503)
Number of families with income $125k - 150k:
Raymore:
2.8% (16)
State:
6.4% (9,541)
Number of families with income $150k - 200k:
Raymore:
22.1% (126)
State:
7.0% (10,445)
Number of families with income > $200k:
Raymore:
8.8% (50)
Missouri:
3.7% (5,444)
Median non-family income in Raymore in 2022:
Raymore:
$37,346
State:
$31,068
Change in median non-family income between 2000 and 2022:: -23.1%
Raymore, Missouri:
-23.1%
State:
+66.9%
Median per capita income in Raymore in 2022:
Raymore:
$43,380
State:
$26,193
Change in median per capita income between 2000 and 2022:
Raymore, Missouri:
+29.9%
State:
+86.8%
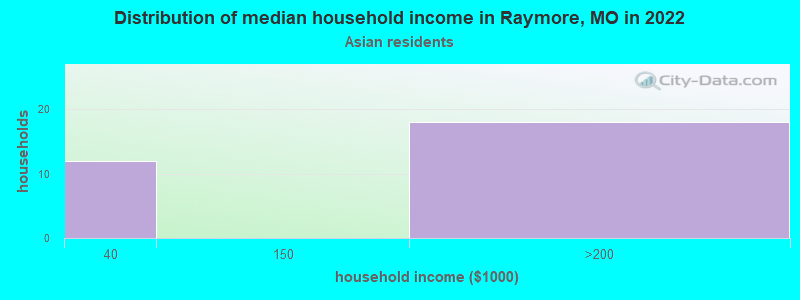
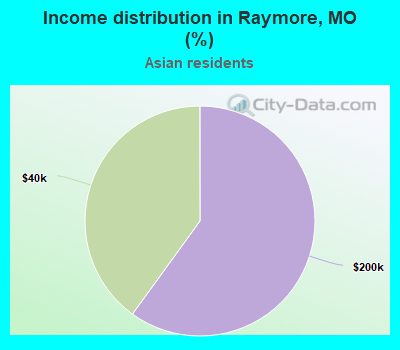
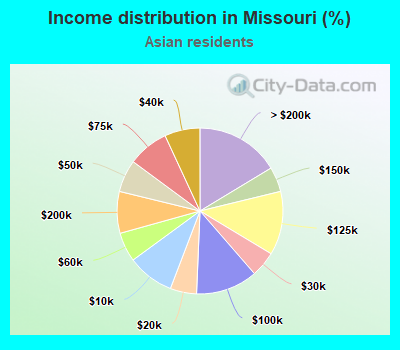
Income statistics for Asian residents
Number of households with income < $10k:
Raymore:
0.0% (0)
State:
9.1% (4,564)
Number of households with income $10k - 20k:
Raymore:
0.0% (0)
State:
5.2% (2,574)
Number of households with income $20k - 30k:
Raymore:
0.0% (0)
State:
5.0% (2,496)
Number of households with income $30k - 40k:
Raymore:
40.0% (12)
State:
6.9% (3,450)
Number of households with income $40k - 50k:
Raymore:
0.0% (0)
State:
6.3% (3,160)
Number of households with income $50k - 60k:
Raymore:
0.0% (0)
State:
5.7% (2,867)
Number of households with income $60k - 75k:
Raymore:
0.0% (0)
State:
8.0% (3,980)
Number of households with income $75k - 100k:
Raymore:
0.0% (0)
Missouri:
12.0% (6,018)
Number of households with income $100k - 125k:
Raymore:
0.0% (0)
State:
12.4% (6,211)
Number of households with income $125k - 150k:
Raymore:
0.0% (0)
State:
4.8% (2,423)
Number of households with income $150k - 200k:
Raymore:
60.0% (18)
State:
8.1% (4,062)
Number of households with income > $200k:
Raymore:
0.0% (0)
State:
16.4% (8,175)
Aggregate household income in Raymore in 2022: $13,316,941
Median per capita income in Raymore in 2022:
Raymore:
$39,528
State:
$46,567
Change in median per capita income between 2000 and 2022:
Raymore, Missouri:
+65.7%
Missouri:
+118.7%
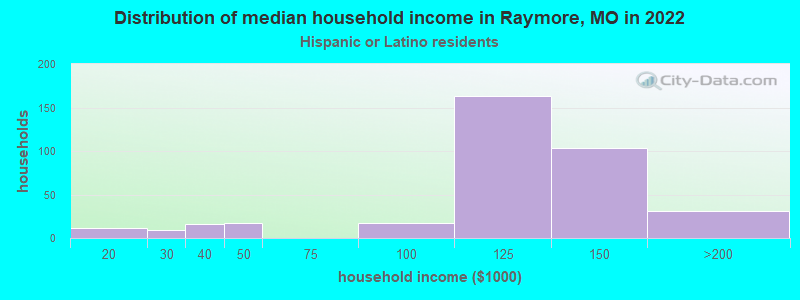
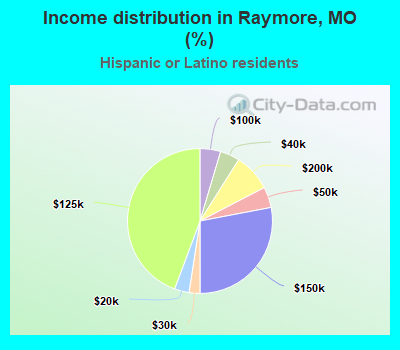
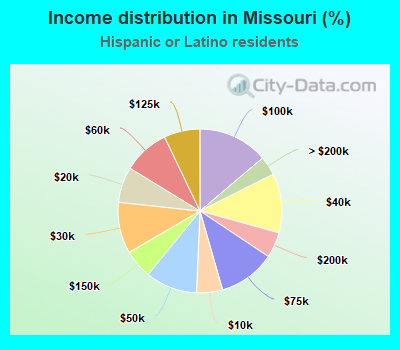
Income statistics for Hispanic or Latino residents
Median household income in Raymore, MO in 2022:
Raymore:
$108,964
Missouri:
$56,460
Change in median household income between 2000 and 2022:
Raymore, Missouri:
+32.9%
Missouri:
+70.1%
Number of households with income < $10k:
Raymore:
0.0% (0)
Missouri:
5.1% (4,373)
Number of households with income $10k - 20k:
Raymore:
3.3% (12)
State:
7.0% (6,006)
Number of households with income $20k - 30k:
Raymore:
2.4% (9)
Missouri:
10.1% (8,643)
Number of households with income $30k - 40k:
Raymore:
4.3% (16)
State:
11.7% (9,989)
Number of households with income $40k - 50k:
Raymore:
4.6% (17)
Missouri:
10.2% (8,742)
Number of households with income $50k - 60k:
Raymore:
0.0% (0)
Missouri:
9.2% (7,818)
Number of households with income $60k - 75k:
Raymore:
0.0% (0)
State:
11.2% (9,570)
Number of households with income $75k - 100k:
Raymore:
4.6% (17)
State:
13.8% (11,820)
Number of households with income $100k - 125k:
Raymore:
44.3% (163)
State:
7.1% (6,070)
Number of households with income $125k - 150k:
Raymore:
28.0% (103)
State:
5.7% (4,859)
Number of households with income $150k - 200k:
Raymore:
8.4% (31)
State:
5.1% (4,323)
Number of households with income > $200k:
Raymore:
0.0% (0)
State:
3.8% (3,228)
Aggregate household income in Raymore in 2022: $52,883,894
Median family income in Raymore in 2022:
Raymore:
$99,681
State:
$63,314
Number of families with income $10k - 20k:
Raymore:
2.9% (9)
State:
5.4% (3,049)
Number of families with income $20k - 30k:
Raymore:
2.7% (8)
State:
9.6% (5,396)
Number of families with income $30k - 40k:
Raymore:
6.1% (19)
State:
9.7% (5,440)
Number of families with income $40k - 50k:
Raymore:
5.0% (15)
State:
8.9% (4,992)
Number of families with income $75k - 100k:
Raymore:
5.8% (18)
State:
15.4% (8,626)
Number of families with income $100k - 125k:
Raymore:
48.3% (151)
Missouri:
7.7% (4,334)
Number of families with income $125k - 150k:
Raymore:
25.0% (78)
State:
6.4% (3,573)
Number of families with income $150k - 200k:
Raymore:
4.2% (13)
Missouri:
6.2% (3,499)
Median per capita income in Raymore in 2022:
Raymore:
$29,324
State:
$23,656
Change in median per capita income between 2000 and 2022:
Raymore, Missouri:
+13.9%
Missouri:
+81.3%
Income statistics for American Indian and Alaska Native residents
Aggregate household income in Raymore in 2022: $5,212,911
Median per capita income in Raymore in 2022:
Raymore:
$24,323
Missouri:
$31,281
Change in median per capita income between 2000 and 2022:
Raymore, Missouri:
+30.5%
State:
+116.2%
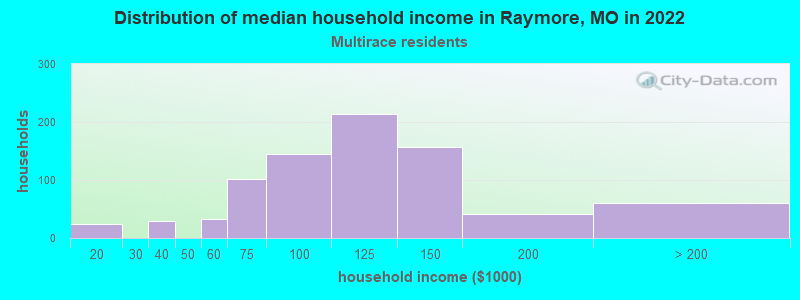
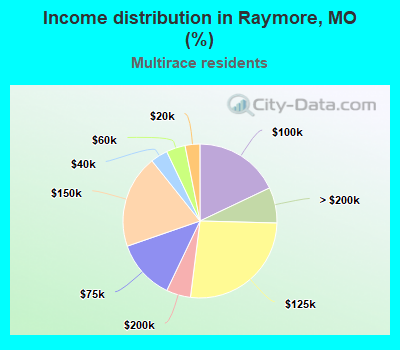
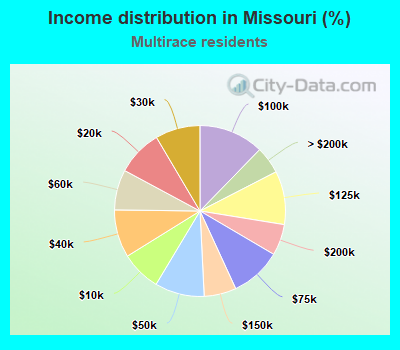
Income statistics for Multirace residents
Median household income in Raymore, MO in 2022:
Raymore:
$105,099
State:
$58,716
Number of households with income < $10k:
Raymore:
0.0% (0)
State:
7.6% (10,901)
Number of households with income $10k - 20k:
Raymore:
3.1% (25)
State:
8.7% (12,480)
Number of households with income $20k - 30k:
Raymore:
0.0% (0)
State:
8.5% (12,233)
Number of households with income $30k - 40k:
Raymore:
3.6% (29)
State:
9.1% (13,060)
Number of households with income $40k - 50k:
Raymore:
0.0% (0)
State:
9.4% (13,506)
Number of households with income $50k - 60k:
Raymore:
4.0% (32)
State:
7.6% (11,002)
Number of households with income $60k - 75k:
Raymore:
12.6% (101)
Missouri:
9.7% (13,948)
Number of households with income $75k - 100k:
Raymore:
18.0% (144)
Missouri:
12.3% (17,702)
Number of households with income $100k - 125k:
Raymore:
26.6% (213)
Missouri:
10.1% (14,590)
Number of households with income $125k - 150k:
Raymore:
19.6% (157)
State:
6.1% (8,758)
Number of households with income $150k - 200k:
Raymore:
5.1% (41)
State:
5.9% (8,516)
Number of households with income > $200k:
Raymore:
7.5% (60)
State:
5.2% (7,429)
Aggregate household income in Raymore in 2022: $83,301,263
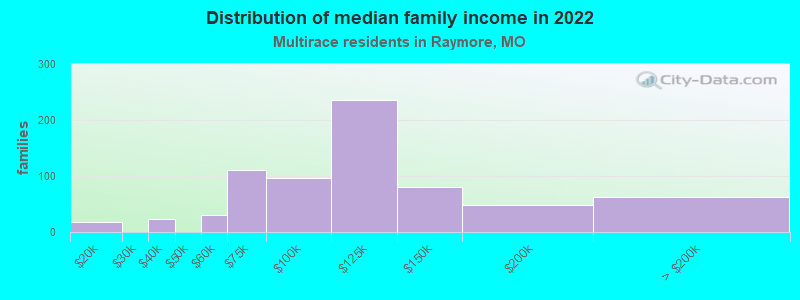
Median family income in Raymore in 2022:
Raymore:
$82,211
State:
$72,493
Number of families with income $10k - 20k:
Raymore:
2.6% (18)
Missouri:
3.6% (3,230)
Number of families with income $30k - 40k:
Raymore:
3.4% (24)
State:
7.8% (6,951)
Number of families with income $50k - 60k:
Raymore:
4.4% (31)
State:
7.5% (6,678)
Number of families with income $60k - 75k:
Raymore:
15.6% (111)
State:
10.3% (9,162)
Number of families with income $75k - 100k:
Raymore:
13.7% (97)
State:
13.8% (12,321)
Number of families with income $100k - 125k:
Raymore:
33.2% (235)
Missouri:
11.8% (10,531)
Number of families with income $125k - 150k:
Raymore:
11.5% (81)
State:
7.4% (6,624)
Number of families with income $150k - 200k:
Raymore:
6.8% (48)
State:
8.4% (7,491)
Number of families with income > $200k:
Raymore:
8.9% (63)
Missouri:
7.5% (6,732)
Median per capita income in Raymore in 2022:
Raymore:
$24,193
State:
$25,564
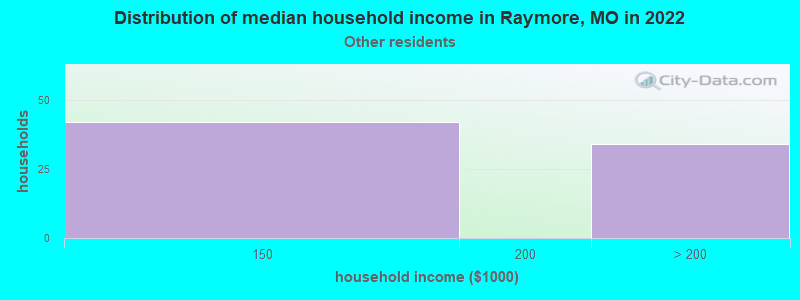
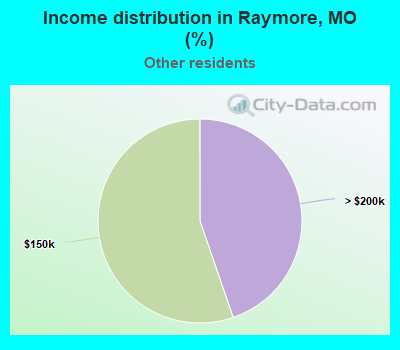
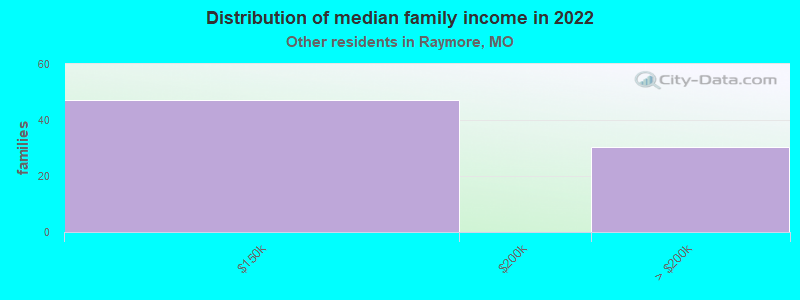
Income statistics for other residents
Median household income in Raymore, MO in 2022:
Raymore:
$255,174
State:
$58,488
Number of households with income < $10k:
Raymore:
0.0% (0)
Missouri:
6.5% (2,051)
Number of households with income $10k - 20k:
Raymore:
0.0% (0)
State:
8.0% (2,525)
Number of households with income $20k - 30k:
Raymore:
0.0% (0)
State:
9.9% (3,128)
Number of households with income $30k - 40k:
Raymore:
0.0% (0)
State:
9.7% (3,040)
Number of households with income $40k - 50k:
Raymore:
0.0% (0)
State:
7.9% (2,476)
Number of households with income $50k - 60k:
Raymore:
0.0% (0)
State:
10.1% (3,183)
Number of households with income $60k - 75k:
Raymore:
0.0% (0)
State:
13.8% (4,353)
Number of households with income $75k - 100k:
Raymore:
0.0% (0)
State:
11.9% (3,760)
Number of households with income $100k - 125k:
Raymore:
0.0% (0)
State:
5.0% (1,588)
Number of households with income $125k - 150k:
Raymore:
55.3% (42)
State:
6.6% (2,070)
Number of households with income $150k - 200k:
Raymore:
0.0% (0)
Missouri:
7.1% (2,231)
Number of households with income > $200k:
Raymore:
44.7% (34)
State:
3.5% (1,093)
Aggregate household income in Raymore in 2022: $11,237,345
Median family income in Raymore in 2022:
Raymore:
$256,470
Missouri:
$61,985
Number of families with income $125k - 150k:
Raymore:
60.8% (47)
State:
8.4% (1,844)
Number of families with income > $200k:
Raymore:
39.2% (30)
State:
4.2% (913)
Median per capita income in Raymore in 2022:
Raymore:
$51,646
State:
$24,560
Change in median per capita income between 2000 and 2022:
Raymore, Missouri:
+50.3%
State:
+115.4%
Discuss Raymore, Missouri (MO) on our hugely popular Missouri forum.