Red Lick, Kentucky (KY) income map, earnings map, and wages data
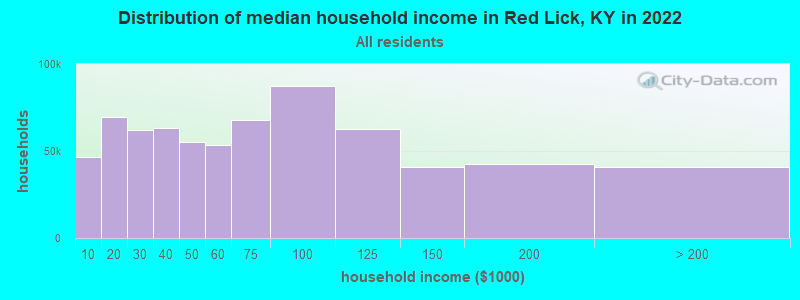
The median household income in Red Lick, KY in 2022 was $45,176, which was 31.4% less than the median annual income of $59,341 across the entire state of Kentucky. Compared to the median income of $25,602 in 2000 this represents an increase of 43.3%. The per capita income in 2022 was $22,909, which means an increase of 47.0% compared to 2000 when it was $12,148.
Income statistics for all residents
Median household income in Red Lick, KY in 2022:| Red Lick: | $45,177 |
| Kentucky: | $59,341 |
Change in median household income between 2000 and 2022:| Red Lick, Kentucky: | +76.5% |
| Kentucky: | +76.2% |
Number of households with income < $10k:| Red Lick: | 6.8% (46,814) |
| Kentucky: | 6.8% (123,697) |
Number of households with income $10k - 20k:| Red Lick: | 10.0% (69,537) |
| State: | 10.0% (182,645) |
Number of households with income $20k - 30k:| Red Lick: | 9.0% (62,216) |
| State: | 9.0% (164,092) |
Number of households with income $30k - 40k:| Red Lick: | 9.1% (62,986) |
| Kentucky: | 9.1% (165,607) |
Number of households with income $40k - 50k:| Red Lick: | 8.0% (55,159) |
| Kentucky: | 8.0% (146,315) |
Number of households with income $50k - 60k:| Red Lick: | 7.7% (53,461) |
| State: | 7.7% (140,671) |
Number of households with income $60k - 75k:| Red Lick: | 9.8% (67,952) |
| Kentucky: | 9.8% (180,002) |
Number of households with income $75k - 100k:| Red Lick: | 12.6% (87,340) |
| State: | 12.6% (230,239) |
Number of households with income $100k - 125k:| Red Lick: | 9.0% (62,366) |
| State: | 9.0% (164,398) |
Number of households with income $125k - 150k:| Red Lick: | 5.9% (41,015) |
| State: | 5.9% (108,602) |
Number of households with income $150k - 200k:| Red Lick: | 6.1% (42,491) |
| State: | 6.2% (112,813) |
Number of households with income > $200k:| Red Lick: | 5.9% (41,014) |
| State: | 6.0% (109,599) |
Aggregate household income in Red Lick in 2022: $2,369,435,552
Median family income in Red Lick in 2022:| Red Lick: | $56,722 |
| State: | $76,119 |
Median non-family income in Red Lick in 2022:| Red Lick: | $20,872 |
| State: | $33,993 |
Change in median non-family income between 2000 and 2022:| Red Lick, Kentucky: | +80.5% |
| State: | +79.2% |
Median per capita income in Red Lick in 2022:| Red Lick: | $22,910 |
| State: | $33,980 |
Change in median per capita income between 2000 and 2022:| Red Lick, Kentucky: | +88.6% |
| State: | +87.8% |
Income statistics for White residents
Median household income in Red Lick, KY in 2022:| Red Lick: | $45,285 |
| State: | $60,987 |
Change in median household income between 2000 and 2022:| Red Lick, Kentucky: | +76.6% |
| State: | +76.2% |
Number of households with income < $10k:| Red Lick: | 6.2% (36,166) |
| Kentucky: | 6.2% (96,690) |
Number of households with income $10k - 20k:| Red Lick: | 9.8% (56,798) |
| State: | 9.7% (151,125) |
Number of households with income $20k - 30k:| Red Lick: | 9.0% (52,130) |
| Kentucky: | 8.9% (139,532) |
Number of households with income $30k - 40k:| Red Lick: | 9.1% (53,223) |
| State: | 9.1% (142,284) |
Number of households with income $40k - 50k:| Red Lick: | 7.7% (44,849) |
| State: | 7.7% (121,151) |
Number of households with income $50k - 60k:| Red Lick: | 7.7% (44,860) |
| State: | 7.7% (119,790) |
Number of households with income $60k - 75k:| Red Lick: | 9.8% (57,116) |
| Kentucky: | 9.9% (154,174) |
Number of households with income $75k - 100k:| Red Lick: | 12.8% (74,422) |
| Kentucky: | 12.8% (199,740) |
Number of households with income $100k - 125k:| Red Lick: | 9.4% (54,412) |
| State: | 9.4% (146,284) |
Number of households with income $125k - 150k:| Red Lick: | 6.0% (34,866) |
| State: | 6.0% (94,180) |
Number of households with income $150k - 200k:| Red Lick: | 6.4% (37,117) |
| Kentucky: | 6.4% (100,702) |
Number of households with income > $200k:| Red Lick: | 6.2% (35,922) |
| State: | 6.3% (98,502) |
Aggregate household income in Red Lick in 2022: $2,053,331,029
Median family income in Red Lick in 2022:| Red Lick: | $57,252 |
| State: | $78,353 |
Number of families with income < $10k:| Red Lick: | 12.5% (146) |
| State: | 3.7% (37,075) |
Number of families with income $10k - 20k:| Red Lick: | 7.3% (86) |
| Kentucky: | 4.9% (49,864) |
Number of families with income $20k - 30k:| Red Lick: | 11.3% (133) |
| Kentucky: | 6.4% (64,043) |
Number of families with income $30k - 40k:| Red Lick: | 13.6% (159) |
| State: | 8.0% (81,080) |
Number of families with income $40k - 50k:| Red Lick: | 5.4% (64) |
| State: | 6.9% (69,099) |
Number of families with income $50k - 60k:| Red Lick: | 9.6% (113) |
| State: | 7.2% (72,955) |
Number of families with income $60k - 75k:| Red Lick: | 10.4% (122) |
| State: | 10.4% (104,587) |
Number of families with income $75k - 100k:| Red Lick: | 13.7% (161) |
| State: | 15.0% (151,545) |
Number of families with income $100k - 125k:| Red Lick: | 9.2% (108) |
| State: | 11.9% (120,340) |
Number of families with income $125k - 150k:| Red Lick: | 6.9% (81) |
| Kentucky: | 8.1% (81,620) |
Median non-family income in Red Lick in 2022:| Red Lick: | $21,335 |
| State: | $34,415 |
Change in median non-family income between 2000 and 2022:| Red Lick, Kentucky: | +79.7% |
| State: | +78.3% |
Median per capita income in Red Lick in 2022:| Red Lick: | $23,216 |
| State: | $35,352 |
Change in median per capita income between 2000 and 2022:| Red Lick, Kentucky: | +90.9% |
| State: | +90.2% |
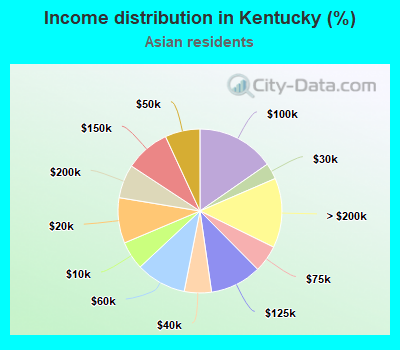
Income statistics for Asian residents
Median household income in Red Lick, KY in 2022:| Red Lick: | $5,058 |
| Kentucky: | $84,447 |
Change in median household income between 2000 and 2022:| Red Lick, Kentucky: | +102.4% |
| Kentucky: | +82.7% |
Number of households with income < $10k:| Red Lick: | 5.6% (67) |
| Kentucky: | 5.6% (1,233) |
Number of households with income $10k - 20k:| Red Lick: | 9.0% (107) |
| State: | 9.0% (1,974) |
Number of households with income $20k - 30k:| Red Lick: | 3.2% (38) |
| Kentucky: | 3.2% (700) |
Number of households with income $30k - 40k:| Red Lick: | 5.4% (64) |
| Kentucky: | 5.4% (1,181) |
Number of households with income $40k - 50k:| Red Lick: | 6.9% (82) |
| State: | 6.9% (1,517) |
Number of households with income $50k - 60k:| Red Lick: | 9.9% (118) |
| State: | 9.9% (2,187) |
Number of households with income $60k - 75k:| Red Lick: | 5.3% (63) |
| State: | 5.3% (1,173) |
Number of households with income $75k - 100k:| Red Lick: | 15.4% (183) |
| State: | 15.3% (3,377) |
Number of households with income $100k - 125k:| Red Lick: | 10.2% (121) |
| Kentucky: | 10.1% (2,234) |
Number of households with income $125k - 150k:| Red Lick: | 8.8% (105) |
| State: | 8.9% (1,949) |
Number of households with income $150k - 200k:| Red Lick: | 6.6% (79) |
| Kentucky: | 6.6% (1,463) |
Number of households with income > $200k:| Red Lick: | 13.8% (164) |
| State: | 13.8% (3,028) |
Aggregate household income in Red Lick in 2022: $30,117
Median non-family income in Red Lick in 2022:| Red Lick: | $5,014 |
| Kentucky: | $44,541 |
Change in median non-family income between 2000 and 2022:| Red Lick, Kentucky: | +100.6% |
| Kentucky: | +83.8% |
Median per capita income in Red Lick in 2022:| Red Lick: | $1,679 |
| Kentucky: | $42,939 |
Change in median per capita income between 2000 and 2022:| Red Lick, Kentucky: | +67.9% |
| State: | +76.3% |
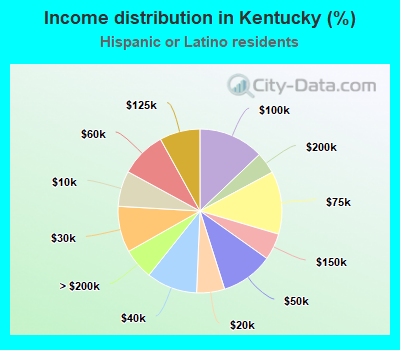
Income statistics for Hispanic or Latino residents
Median household income in Red Lick, KY in 2022:| Red Lick: | $92,240 |
| State: | $57,971 |
Change in median household income between 2000 and 2022:| Red Lick, Kentucky: | +117.8% |
| State: | +96.2% |
Number of households with income < $10k:| Red Lick: | 7.0% (2,560) |
| State: | 7.0% (3,568) |
Number of households with income $10k - 20k:| Red Lick: | 5.5% (2,003) |
| State: | 5.5% (2,811) |
Number of households with income $20k - 30k:| Red Lick: | 9.1% (3,304) |
| State: | 9.1% (4,637) |
Number of households with income $30k - 40k:| Red Lick: | 10.1% (3,665) |
| State: | 10.0% (5,109) |
Number of households with income $40k - 50k:| Red Lick: | 10.3% (3,734) |
| State: | 10.3% (5,241) |
Number of households with income $50k - 60k:| Red Lick: | 9.0% (3,279) |
| State: | 9.1% (4,609) |
Number of households with income $60k - 75k:| Red Lick: | 12.4% (4,498) |
| Kentucky: | 12.4% (6,299) |
Number of households with income $75k - 100k:| Red Lick: | 13.0% (4,730) |
| Kentucky: | 12.9% (6,562) |
Number of households with income $100k - 125k:| Red Lick: | 8.0% (2,914) |
| State: | 8.0% (4,066) |
Number of households with income $125k - 150k:| Red Lick: | 5.3% (1,930) |
| Kentucky: | 5.3% (2,685) |
Number of households with income $150k - 200k:| Red Lick: | 4.3% (1,555) |
| State: | 4.3% (2,173) |
Number of households with income > $200k:| Red Lick: | 6.1% (2,207) |
| Kentucky: | 6.1% (3,099) |
Aggregate household income in Red Lick in 2022: $4,641,869
Median family income in Red Lick in 2022:| Red Lick: | $86,140 |
| Kentucky: | $58,603 |
Number of families with income < $10k:| Red Lick: | 17.5% (9) |
| State: | 5.3% (1,907) |
Number of families with income $10k - 20k:| Red Lick: | 9.9% (5) |
| State: | 6.4% (2,298) |
Number of families with income $20k - 30k:| Red Lick: | 15.3% (8) |
| State: | 9.4% (3,414) |
Number of families with income $30k - 40k:| Red Lick: | 17.0% (8) |
| Kentucky: | 11.1% (4,022) |
Number of families with income $40k - 50k:| Red Lick: | 7.0% (3) |
| Kentucky: | 11.2% (4,054) |
Number of families with income $50k - 60k:| Red Lick: | 7.4% (4) |
| State: | 7.2% (2,594) |
Number of families with income $60k - 75k:| Red Lick: | 8.0% (4) |
| State: | 10.1% (3,652) |
Number of families with income $75k - 100k:| Red Lick: | 9.4% (5) |
| Kentucky: | 13.4% (4,856) |
Number of families with income $100k - 125k:| Red Lick: | 4.5% (2) |
| State: | 8.0% (2,906) |
Number of families with income $125k - 150k:| Red Lick: | 3.9% (2) |
| Kentucky: | 6.1% (2,200) |
Median per capita income in Red Lick in 2022:| Red Lick: | $50,756 |
| Kentucky: | $24,650 |
Change in median per capita income between 2000 and 2022:| Red Lick, Kentucky: | +106.9% |
| State: | +106.1% |
Income statistics for American Indian and Alaska Native residents
Number of households with income < $10k:| Red Lick: | 8.4% (267,245) |
| State: | 10.0% (217) |
Number of households with income $10k - 20k:| Red Lick: | 9.4% (298,240) |
| State: | 17.7% (385) |
Number of households with income $20k - 30k:| Red Lick: | 8.5% (269,761) |
| State: | 12.8% (279) |
Number of households with income $30k - 40k:| Red Lick: | 9.1% (289,016) |
| State: | 10.8% (234) |
Number of households with income $40k - 50k:| Red Lick: | 8.3% (265,104) |
| State: | 10.2% (221) |
Number of households with income $50k - 60k:| Red Lick: | 7.8% (249,972) |
| State: | 7.7% (167) |
Number of households with income $60k - 75k:| Red Lick: | 9.8% (311,579) |
| State: | 11.1% (241) |
Number of households with income $75k - 100k:| Red Lick: | 12.6% (402,198) |
| State: | 5.8% (126) |
Number of households with income $100k - 125k:| Red Lick: | 9.4% (300,764) |
| Kentucky: | 5.3% (116) |
Number of households with income $125k - 150k:| Red Lick: | 5.6% (180,066) |
| Kentucky: | 4.7% (102) |
Number of households with income $150k - 200k:| Red Lick: | 6.0% (189,824) |
| State: | 1.5% (33) |
Number of households with income > $200k:| Red Lick: | 5.2% (164,303) |
| State: | 2.4% (52) |
Median per capita income in Red Lick in 2022:| Red Lick: | $51,451 |
| State: | $18,045 |
Change in median per capita income between 2000 and 2022:| Red Lick, Kentucky: | +29.9% |
| Kentucky: | +26.9% |
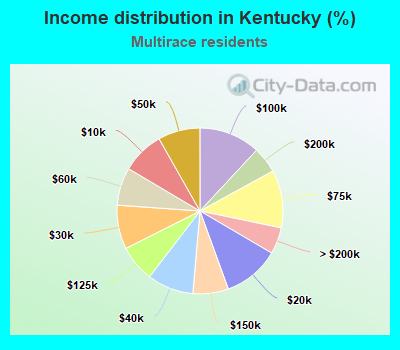
Income statistics for Multirace residents
Median household income in Red Lick, KY in 2022:| Red Lick: | $112,165 |
| State: | $56,359 |
Change in median household income between 2000 and 2022:| Red Lick, Kentucky: | +108.7% |
| State: | +107.8% |
Number of households with income < $10k:| Red Lick: | 8.2% (6,623) |
| State: | 8.3% (6,780) |
Number of households with income $10k - 20k:| Red Lick: | 11.1% (8,913) |
| State: | 11.0% (9,005) |
Number of households with income $20k - 30k:| Red Lick: | 8.5% (6,812) |
| State: | 8.6% (7,004) |
Number of households with income $30k - 40k:| Red Lick: | 9.1% (7,313) |
| State: | 9.0% (7,406) |
Number of households with income $40k - 50k:| Red Lick: | 8.2% (6,580) |
| State: | 8.2% (6,707) |
Number of households with income $50k - 60k:| Red Lick: | 7.4% (5,916) |
| State: | 7.4% (6,048) |
Number of households with income $60k - 75k:| Red Lick: | 11.2% (9,030) |
| State: | 11.2% (9,202) |
Number of households with income $75k - 100k:| Red Lick: | 11.9% (9,570) |
| State: | 11.9% (9,767) |
Number of households with income $100k - 125k:| Red Lick: | 7.2% (5,779) |
| State: | 7.1% (5,846) |
Number of households with income $125k - 150k:| Red Lick: | 6.9% (5,558) |
| Kentucky: | 6.9% (5,667) |
Number of households with income $150k - 200k:| Red Lick: | 5.1% (4,094) |
| State: | 5.1% (4,171) |
Number of households with income > $200k:| Red Lick: | 5.1% (4,136) |
| State: | 5.2% (4,241) |
Aggregate household income in Red Lick in 2022: $4,459,097
Median family income in Red Lick in 2022:| Red Lick: | $113,242 |
| State: | $67,296 |
Number of families with income $50k - 60k:| Red Lick: | 100.0% (35) |
| State: | 7.3% (3,995) |
Median per capita income in Red Lick in 2022:| Red Lick: | $18,419 |
| Kentucky: | $25,670 |
Change in median per capita income between 2000 and 2022:| Red Lick, Kentucky: | +131.8% |
| State: | +132.3% |