Red Lion, Delaware (DE) income map, earnings map, and wages data
The median household income in Red Lion, DE in 2022 was $101,415, which was 19.0% greater than the median annual income of $82,174 across the entire state of Delaware. Compared to the median income of $61,801 in 2000 this represents an increase of 39.1%. The per capita income in 2022 was $44,255, which means an increase of 42.0% compared to 2000 when it was $25,663.
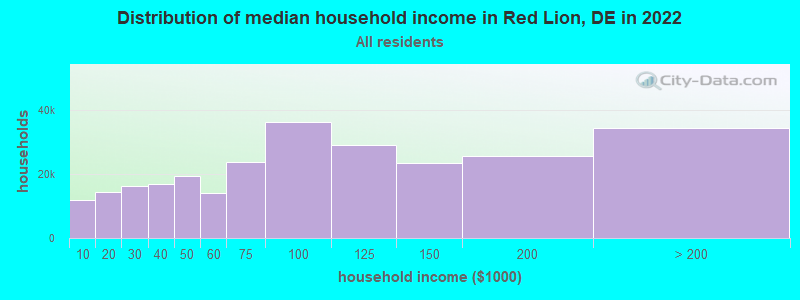
Income statistics for all residents
Median household income in Red Lion, DE in 2022:| Red Lion: | $101,416 |
| Delaware: | $82,174 |
Change in median household income between 2000 and 2022:| Red Lion, Delaware: | +64.1% |
| State: | +73.4% |
Number of households with income < $10k:| Red Lion: | 4.5% (11,806) |
| Delaware: | 4.0% (16,288) |
Number of households with income $10k - 20k:| Red Lion: | 5.4% (14,271) |
| State: | 5.6% (22,545) |
Number of households with income $20k - 30k:| Red Lion: | 6.1% (16,075) |
| State: | 6.2% (24,941) |
Number of households with income $30k - 40k:| Red Lion: | 6.3% (16,712) |
| State: | 6.7% (27,051) |
Number of households with income $40k - 50k:| Red Lion: | 7.3% (19,272) |
| State: | 7.3% (29,468) |
Number of households with income $50k - 60k:| Red Lion: | 5.4% (14,156) |
| State: | 6.3% (25,207) |
Number of households with income $60k - 75k:| Red Lion: | 8.9% (23,562) |
| State: | 9.7% (38,914) |
Number of households with income $75k - 100k:| Red Lion: | 13.7% (36,195) |
| State: | 13.9% (56,111) |
Number of households with income $100k - 125k:| Red Lion: | 11.0% (28,942) |
| Delaware: | 11.8% (47,641) |
Number of households with income $125k - 150k:| Red Lion: | 8.9% (23,446) |
| State: | 8.2% (32,964) |
Number of households with income $150k - 200k:| Red Lion: | 9.6% (25,442) |
| Delaware: | 9.4% (37,675) |
Number of households with income > $200k:| Red Lion: | 13.0% (34,200) |
| State: | 10.8% (43,529) |
Aggregate household income in Red Lion in 2022: $1,637,207,320
Median family income in Red Lion in 2022:| Red Lion: | $119,266 |
| Delaware: | $100,128 |
Median non-family income in Red Lion in 2022:| Red Lion: | $45,296 |
| State: | $46,579 |
Change in median non-family income between 2000 and 2022:| Red Lion, Delaware: | +51.0% |
| State: | +55.8% |
Median per capita income in Red Lion in 2022:| Red Lion: | $44,255 |
| State: | $42,571 |
Change in median per capita income between 2000 and 2022:| Red Lion, Delaware: | +72.4% |
| State: | +82.7% |
Income statistics for White residents
Median household income in Red Lion, DE in 2022:| Red Lion: | $100,279 |
| State: | $89,351 |
Change in median household income between 2000 and 2022:| Red Lion, Delaware: | +65.9% |
| State: | +76.9% |
Number of households with income < $10k:| Red Lion: | 3.4% (4,768) |
| Delaware: | 3.4% (9,074) |
Number of households with income $10k - 20k:| Red Lion: | 4.2% (5,924) |
| State: | 4.1% (10,674) |
Number of households with income $20k - 30k:| Red Lion: | 5.5% (7,713) |
| State: | 5.5% (14,529) |
Number of households with income $30k - 40k:| Red Lion: | 5.2% (7,401) |
| State: | 5.9% (15,596) |
Number of households with income $40k - 50k:| Red Lion: | 6.3% (8,849) |
| Delaware: | 6.5% (17,134) |
Number of households with income $50k - 60k:| Red Lion: | 5.0% (7,112) |
| State: | 6.2% (16,208) |
Number of households with income $60k - 75k:| Red Lion: | 9.1% (12,890) |
| State: | 9.9% (26,007) |
Number of households with income $75k - 100k:| Red Lion: | 14.3% (20,187) |
| State: | 14.7% (38,630) |
Number of households with income $100k - 125k:| Red Lion: | 11.0% (15,595) |
| State: | 12.4% (32,584) |
Number of households with income $125k - 150k:| Red Lion: | 10.7% (15,175) |
| State: | 9.5% (24,918) |
Number of households with income $150k - 200k:| Red Lion: | 10.6% (14,992) |
| State: | 10.2% (27,001) |
Number of households with income > $200k:| Red Lion: | 14.6% (20,578) |
| Delaware: | 11.8% (31,108) |
Aggregate household income in Red Lion in 2022: $926,718,809
Median family income in Red Lion in 2022:| Red Lion: | $120,897 |
| Delaware: | $107,254 |
Number of families with income < $10k:| Red Lion: | 1.1% (12) |
| State: | 1.6% (2,775) |
Number of families with income $10k - 20k:| Red Lion: | 2.7% (29) |
| State: | 1.9% (3,364) |
Number of families with income $20k - 30k:| Red Lion: | 1.6% (17) |
| State: | 2.1% (3,677) |
Number of families with income $30k - 40k:| Red Lion: | 3.6% (39) |
| State: | 3.4% (5,879) |
Number of families with income $40k - 50k:| Red Lion: | 3.8% (40) |
| State: | 5.0% (8,600) |
Number of families with income $50k - 60k:| Red Lion: | 4.6% (49) |
| State: | 5.6% (9,745) |
Number of families with income $60k - 75k:| Red Lion: | 7.5% (80) |
| State: | 10.0% (17,322) |
Number of families with income $75k - 100k:| Red Lion: | 16.7% (178) |
| Delaware: | 15.9% (27,642) |
Number of families with income $100k - 125k:| Red Lion: | 13.5% (144) |
| State: | 14.4% (25,049) |
Number of families with income $125k - 150k:| Red Lion: | 6.3% (68) |
| Delaware: | 11.0% (19,185) |
Number of families with income $150k - 200k:| Red Lion: | 18.5% (198) |
| State: | 13.4% (23,326) |
Number of families with income > $200k:| Red Lion: | 20.2% (216) |
| State: | 15.6% (27,066) |
Median non-family income in Red Lion in 2022:| Red Lion: | $47,667 |
| State: | $50,472 |
Change in median non-family income between 2000 and 2022:| Red Lion, Delaware: | +54.7% |
| State: | +62.2% |
Median per capita income in Red Lion in 2022:| Red Lion: | $50,511 |
| Delaware: | $49,694 |
Change in median per capita income between 2000 and 2022:| Red Lion, Delaware: | +87.5% |
| State: | +94.2% |
Income statistics for Black or African American residents
Median household income in Red Lion, DE in 2022:| Red Lion: | $132,846 |
| State: | $61,228 |
Change in median household income between 2000 and 2022:| Red Lion, Delaware: | +60.7% |
| Delaware: | +72.4% |
Number of households with income < $10k:| Red Lion: | 7.0% (8,231) |
| State: | 5.8% (4,827) |
Number of households with income $10k - 20k:| Red Lion: | 8.9% (10,490) |
| State: | 10.3% (8,504) |
Number of households with income $20k - 30k:| Red Lion: | 7.5% (8,834) |
| State: | 8.0% (6,660) |
Number of households with income $30k - 40k:| Red Lion: | 9.4% (11,118) |
| Delaware: | 8.8% (7,277) |
Number of households with income $40k - 50k:| Red Lion: | 10.4% (12,207) |
| State: | 9.6% (7,918) |
Number of households with income $50k - 60k:| Red Lion: | 5.7% (6,735) |
| State: | 6.6% (5,428) |
Number of households with income $60k - 75k:| Red Lion: | 7.8% (9,163) |
| State: | 8.3% (6,859) |
Number of households with income $75k - 100k:| Red Lion: | 12.1% (14,280) |
| Delaware: | 12.6% (10,436) |
Number of households with income $100k - 125k:| Red Lion: | 11.7% (13,787) |
| State: | 11.7% (9,680) |
Number of households with income $125k - 150k:| Red Lion: | 4.8% (5,617) |
| State: | 4.6% (3,826) |
Number of households with income $150k - 200k:| Red Lion: | 6.4% (7,548) |
| State: | 6.0% (4,991) |
Number of households with income > $200k:| Red Lion: | 8.2% (9,656) |
| State: | 7.7% (6,355) |
Aggregate household income in Red Lion in 2022: $47,322,741
Median family income in Red Lion in 2022:| Red Lion: | $168,820 |
| State: | $83,261 |
Number of families with income < $10k:| Red Lion: | 1.1% (4) |
| Delaware: | 5.3% (2,684) |
Number of families with income $10k - 20k:| Red Lion: | 1.5% (6) |
| Delaware: | 5.7% (2,917) |
Number of families with income $20k - 30k:| Red Lion: | 0.3% (1) |
| Delaware: | 4.7% (2,390) |
Number of families with income $30k - 40k:| Red Lion: | 1.0% (4) |
| State: | 6.0% (3,030) |
Number of families with income $40k - 50k:| Red Lion: | 1.1% (4) |
| Delaware: | 8.5% (4,339) |
Number of families with income $50k - 60k:| Red Lion: | 6.4% (24) |
| State: | 6.7% (3,434) |
Number of families with income $60k - 75k:| Red Lion: | 7.5% (28) |
| State: | 9.8% (4,965) |
Number of families with income $75k - 100k:| Red Lion: | 14.0% (51) |
| Delaware: | 12.4% (6,312) |
Number of families with income $100k - 125k:| Red Lion: | 52.9% (195) |
| State: | 16.0% (8,129) |
Number of families with income $125k - 150k:| Red Lion: | 14.1% (52) |
| Delaware: | 5.8% (2,928) |
Median non-family income in Red Lion in 2022:| Red Lion: | $40,327 |
| State: | $36,936 |
Change in median non-family income between 2000 and 2022:| Red Lion, Delaware: | +53.6% |
| State: | +62.8% |
Median per capita income in Red Lion in 2022:| Red Lion: | $40,885 |
| State: | $32,135 |
Change in median per capita income between 2000 and 2022:| Red Lion, Delaware: | +83.5% |
| State: | +98.7% |
Income statistics for Asian residents
Median household income in Red Lion, DE in 2022:| Red Lion: | $84,984 |
| State: | $106,917 |
Change in median household income between 2000 and 2022:| Red Lion, Delaware: | +58.1% |
| State: | +64.0% |
Number of households with income < $10k:| Red Lion: | 4.5% (431) |
| Delaware: | 3.9% (588) |
Number of households with income $10k - 20k:| Red Lion: | 2.1% (202) |
| State: | 4.6% (693) |
Number of households with income $20k - 30k:| Red Lion: | 4.3% (414) |
| State: | 4.2% (632) |
Number of households with income $30k - 40k:| Red Lion: | 4.6% (444) |
| State: | 4.9% (738) |
Number of households with income $40k - 50k:| Red Lion: | 5.5% (524) |
| State: | 6.8% (1,021) |
Number of households with income $50k - 60k:| Red Lion: | 3.8% (367) |
| State: | 4.1% (624) |
Number of households with income $60k - 75k:| Red Lion: | 4.9% (471) |
| State: | 5.0% (751) |
Number of households with income $75k - 100k:| Red Lion: | 10.7% (1,024) |
| Delaware: | 10.1% (1,514) |
Number of households with income $100k - 125k:| Red Lion: | 12.8% (1,232) |
| Delaware: | 11.1% (1,664) |
Number of households with income $125k - 150k:| Red Lion: | 7.6% (733) |
| State: | 8.1% (1,217) |
Number of households with income $150k - 200k:| Red Lion: | 13.4% (1,283) |
| Delaware: | 14.5% (2,187) |
Number of households with income > $200k:| Red Lion: | 25.7% (2,468) |
| State: | 22.8% (3,427) |
Aggregate household income in Red Lion in 2022: $2,025,037
Median family income in Red Lion in 2022:| Red Lion: | $91,493 |
| State: | $126,223 |
Median per capita income in Red Lion in 2022:| Red Lion: | $25,983 |
| State: | $51,124 |
Change in median per capita income between 2000 and 2022:| Red Lion, Delaware: | +81.1% |
| State: | +79.9% |
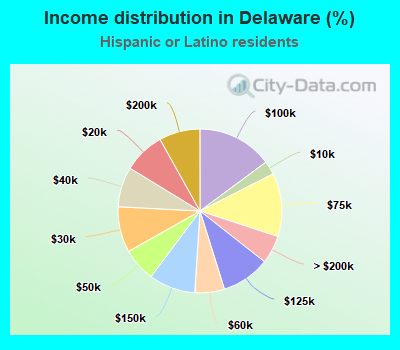
Income statistics for Hispanic or Latino residents
Median household income in Red Lion, DE in 2022:| Red Lion: | $163,656 |
| State: | $71,733 |
Change in median household income between 2000 and 2022:| Red Lion, Delaware: | +103.3% |
| Delaware: | +97.7% |
Number of households with income < $10k:| Red Lion: | 3.3% (1,362) |
| State: | 2.7% (797) |
Number of households with income $10k - 20k:| Red Lion: | 7.5% (3,047) |
| State: | 8.2% (2,421) |
Number of households with income $20k - 30k:| Red Lion: | 8.4% (3,413) |
| State: | 9.0% (2,672) |
Number of households with income $30k - 40k:| Red Lion: | 7.2% (2,942) |
| State: | 7.9% (2,345) |
Number of households with income $40k - 50k:| Red Lion: | 5.2% (2,117) |
| State: | 6.6% (1,962) |
Number of households with income $50k - 60k:| Red Lion: | 5.6% (2,290) |
| State: | 5.9% (1,735) |
Number of households with income $60k - 75k:| Red Lion: | 13.1% (5,333) |
| State: | 12.5% (3,709) |
Number of households with income $75k - 100k:| Red Lion: | 18.0% (7,338) |
| Delaware: | 14.8% (4,403) |
Number of households with income $100k - 125k:| Red Lion: | 7.5% (3,049) |
| State: | 9.6% (2,833) |
Number of households with income $125k - 150k:| Red Lion: | 8.2% (3,354) |
| State: | 9.2% (2,723) |
Number of households with income $150k - 200k:| Red Lion: | 9.1% (3,693) |
| State: | 8.1% (2,398) |
Number of households with income > $200k:| Red Lion: | 7.0% (2,868) |
| State: | 5.6% (1,653) |
Aggregate household income in Red Lion in 2022: $7,425,200
Median family income in Red Lion in 2022:| Red Lion: | $157,099 |
| State: | $71,093 |
Number of families with income < $10k:| Red Lion: | 2.8% (5) |
| State: | 2.5% (560) |
Number of families with income $10k - 20k:| Red Lion: | 6.5% (13) |
| Delaware: | 6.3% (1,436) |
Number of families with income $20k - 30k:| Red Lion: | 7.5% (15) |
| State: | 8.4% (1,913) |
Number of families with income $30k - 40k:| Red Lion: | 13.4% (26) |
| State: | 7.1% (1,609) |
Number of families with income $40k - 50k:| Red Lion: | 4.9% (10) |
| State: | 10.6% (2,398) |
Number of families with income $50k - 60k:| Red Lion: | 5.6% (11) |
| State: | 6.2% (1,399) |
Number of families with income $60k - 75k:| Red Lion: | 11.5% (23) |
| State: | 12.2% (2,780) |
Number of families with income $75k - 100k:| Red Lion: | 17.4% (34) |
| Delaware: | 12.4% (2,809) |
Number of families with income $100k - 125k:| Red Lion: | 7.4% (14) |
| State: | 9.6% (2,179) |
Number of families with income $125k - 150k:| Red Lion: | 4.2% (8) |
| Delaware: | 9.9% (2,257) |
Number of families with income $150k - 200k:| Red Lion: | 12.8% (25) |
| Delaware: | 10.0% (2,271) |
Number of families with income > $200k:| Red Lion: | 6.0% (12) |
| State: | 4.9% (1,113) |
Median per capita income in Red Lion in 2022:| Red Lion: | $23,011 |
| Delaware: | $25,402 |
Change in median per capita income between 2000 and 2022:| Red Lion, Delaware: | +94.5% |
| State: | +98.7% |
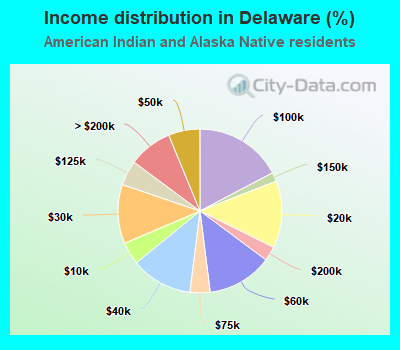
Income statistics for American Indian and Alaska Native residents
Median household income in Red Lion, DE in 2022:| Red Lion: | $47,488 |
| State: | $70,375 |
Change in median household income between 2000 and 2022:| Red Lion, Delaware: | +75.3% |
| State: | +86.8% |
Number of households with income < $10k:| Red Lion: | 8.4% (77,012) |
| State: | 4.5% (56) |
Number of households with income $10k - 20k:| Red Lion: | 9.4% (85,943) |
| State: | 13.2% (166) |
Number of households with income $20k - 30k:| Red Lion: | 8.5% (77,737) |
| State: | 11.6% (146) |
Number of households with income $30k - 40k:| Red Lion: | 9.1% (83,286) |
| State: | 12.1% (152) |
Number of households with income $40k - 50k:| Red Lion: | 8.3% (76,395) |
| State: | 6.2% (78) |
Number of households with income $50k - 60k:| Red Lion: | 7.8% (72,034) |
| State: | 12.8% (161) |
Number of households with income $60k - 75k:| Red Lion: | 9.8% (89,788) |
| Delaware: | 4.0% (50) |
Number of households with income $75k - 100k:| Red Lion: | 12.6% (115,901) |
| State: | 17.3% (217) |
Number of households with income $100k - 125k:| Red Lion: | 9.4% (86,671) |
| State: | 4.9% (62) |
Number of households with income $125k - 150k:| Red Lion: | 5.6% (51,890) |
| State: | 1.8% (22) |
Number of households with income $150k - 200k:| Red Lion: | 6.0% (54,701) |
| State: | 2.9% (36) |
Number of households with income > $200k:| Red Lion: | 5.2% (47,347) |
| State: | 8.6% (108) |
Aggregate household income in Red Lion in 2022: $2,338,314
Median family income in Red Lion in 2022:| Red Lion: | $59,462 |
| State: | $54,234 |
Median non-family income in Red Lion in 2022:| Red Lion: | $45,933 |
| State: | $75,546 |
Change in median non-family income between 2000 and 2022:| Red Lion, Delaware: | +75.0% |
| State: | +173.8% |
Median per capita income in Red Lion in 2022:| Red Lion: | $22,292 |
| State: | $31,308 |
Change in median per capita income between 2000 and 2022:| Red Lion, Delaware: | +92.5% |
| State: | +87.7% |
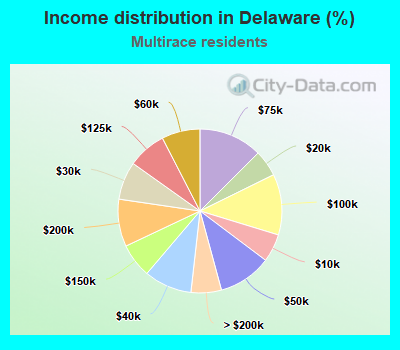
Income statistics for Multirace residents
Median household income in Red Lion, DE in 2022:| Red Lion: | $20,958 |
| State: | $62,559 |
Change in median household income between 2000 and 2022:| Red Lion, Delaware: | +73.5% |
| State: | +60.7% |
Number of households with income < $10k:| Red Lion: | 6.8% (322) |
| State: | 5.6% (1,606) |
Number of households with income $10k - 20k:| Red Lion: | 4.8% (227) |
| State: | 5.2% (1,507) |
Number of households with income $20k - 30k:| Red Lion: | 7.4% (349) |
| Delaware: | 7.5% (2,173) |
Number of households with income $30k - 40k:| Red Lion: | 6.6% (313) |
| State: | 9.4% (2,728) |
Number of households with income $40k - 50k:| Red Lion: | 10.8% (511) |
| State: | 10.5% (3,041) |
Number of households with income $50k - 60k:| Red Lion: | 6.9% (328) |
| State: | 7.6% (2,189) |
Number of households with income $60k - 75k:| Red Lion: | 11.7% (557) |
| State: | 12.5% (3,623) |
Number of households with income $75k - 100k:| Red Lion: | 11.7% (554) |
| State: | 12.0% (3,469) |
Number of households with income $100k - 125k:| Red Lion: | 7.3% (347) |
| State: | 7.6% (2,197) |
Number of households with income $125k - 150k:| Red Lion: | 7.7% (366) |
| State: | 6.8% (1,954) |
Number of households with income $150k - 200k:| Red Lion: | 10.4% (495) |
| State: | 9.4% (2,708) |
Number of households with income > $200k:| Red Lion: | 8.0% (379) |
| State: | 6.0% (1,737) |
Aggregate household income in Red Lion in 2022: $1,010,202
Median family income in Red Lion in 2022:| Red Lion: | $21,363 |
| Delaware: | $72,735 |
Number of families with income $10k - 20k:| Red Lion: | 52.5% (8) |
| State: | 3.5% (667) |
Number of families with income $20k - 30k:| Red Lion: | 47.5% (7) |
| State: | 6.3% (1,194) |
Median per capita income in Red Lion in 2022:| Red Lion: | $29,491 |
| State: | $25,790 |
Change in median per capita income between 2000 and 2022:| Red Lion, Delaware: | +98.0% |
| Delaware: | +107.7% |
Income statistics for other residents
Number of households with income < $10k:| Red Lion: | 0.0% (0) |
| State: | 1.0% (102) |
Number of households with income $10k - 20k:| Red Lion: | 7.1% (3) |
| State: | 8.2% (879) |
Number of households with income $20k - 30k:| Red Lion: | 7.1% (3) |
| State: | 8.7% (928) |
Number of households with income $30k - 40k:| Red Lion: | 7.1% (3) |
| Delaware: | 6.5% (700) |
Number of households with income $40k - 50k:| Red Lion: | 0.0% (0) |
| State: | 2.8% (299) |
Number of households with income $50k - 60k:| Red Lion: | 7.1% (3) |
| Delaware: | 5.9% (635) |
Number of households with income $60k - 75k:| Red Lion: | 14.3% (6) |
| State: | 14.3% (1,531) |
Number of households with income $75k - 100k:| Red Lion: | 21.4% (9) |
| State: | 16.8% (1,800) |
Number of households with income $100k - 125k:| Red Lion: | 7.1% (3) |
| State: | 13.1% (1,399) |
Number of households with income $125k - 150k:| Red Lion: | 11.9% (5) |
| State: | 9.8% (1,049) |
Number of households with income $150k - 200k:| Red Lion: | 9.5% (4) |
| Delaware: | 7.3% (783) |
Number of households with income > $200k:| Red Lion: | 7.1% (3) |
| State: | 5.5% (589) |
Aggregate household income in Red Lion in 2022: $3,721,820
Median family income in Red Lion in 2022:| Red Lion: | $74,011 |
| State: | $76,338 |
Number of families with income $30k - 40k:| Red Lion: | 17.9% (6) |
| Delaware: | 9.0% (776) |
Number of families with income $75k - 100k:| Red Lion: | 82.1% (26) |
| Delaware: | 19.6% (1,683) |
Median per capita income in Red Lion in 2022:| Red Lion: | $16,303 |
| Delaware: | $25,892 |
Change in median per capita income between 2000 and 2022:| Red Lion, Delaware: | +94.1% |
| State: | +110.3% |