The median household income in Richland Springs, TX in 2022 was $23,320, which was 210.0% less than the median annual income of $72,284 across the entire state of Texas. Compared to the median income of $28,750 in 2000 this represents a decrease of 23.3%. The per capita income in 2022 was $14,097, which means a decrease of 11.3% compared to 2000 when it was $15,691.
Whole page based on the data from 2000 / 2022 when the population of Richland Springs, Texas was 350 / 254
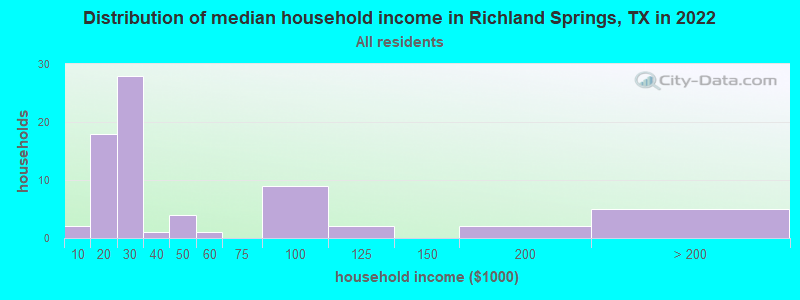
Income statistics for all residents
Median household income in Richland Springs, TX in 2022:
Richland Springs:
$23,321
State:
$72,284
Change in median household income between 2000 and 2022:: -18.9%
Richland Springs, Texas:
-18.9%
Texas:
+81.0%
Number of households with income < $10k:
Richland Springs:
2.8% (2)
State:
5.5% (611,011)
Number of households with income $10k - 20k:
Richland Springs:
25.0% (18)
State:
6.7% (743,157)
Number of households with income $20k - 30k:
Richland Springs:
38.9% (28)
Texas:
7.2% (803,381)
Number of households with income $30k - 40k:
Richland Springs:
1.4% (1)
State:
7.8% (866,080)
Number of households with income $40k - 50k:
Richland Springs:
5.6% (4)
State:
7.3% (810,440)
Number of households with income $50k - 60k:
Richland Springs:
1.4% (1)
Texas:
7.2% (799,783)
Number of households with income $60k - 75k:
Richland Springs:
0.0% (0)
Texas:
9.9% (1,095,384)
Number of households with income $75k - 100k:
Richland Springs:
12.5% (9)
State:
12.8% (1,419,057)
Number of households with income $100k - 125k:
Richland Springs:
2.8% (2)
State:
9.5% (1,054,577)
Number of households with income $125k - 150k:
Richland Springs:
0.0% (0)
Texas:
6.7% (741,518)
Number of households with income $150k - 200k:
Richland Springs:
2.8% (2)
Texas:
8.7% (961,776)
Number of households with income > $200k:
Richland Springs:
6.9% (5)
State:
10.7% (1,181,544)
Aggregate household income in Richland Springs in 2022: $4,281,921
Median non-family income in Richland Springs in 2022:
Richland Springs:
$17,660
Texas:
$45,999
Change in median non-family income between 2000 and 2022:
Richland Springs, Texas:
+41.3%
State:
+79.5%
Median per capita income in Richland Springs in 2022:
Richland Springs:
$14,097
Texas:
$38,123
Change in median per capita income between 2000 and 2022:: -10.2%
Richland Springs, Texas:
-10.2%
Texas:
+94.3%
Income statistics for White residents
Median household income in Richland Springs, TX in 2022:
Richland Springs:
$24,505
State:
$82,032
Change in median household income between 2000 and 2022:
Richland Springs, Texas:
+3.2%
Texas:
+91.0%
Number of households with income < $10k:
Richland Springs:
3.6% (2)
State:
4.7% (273,716)
Number of households with income $10k - 20k:
Richland Springs:
16.4% (9)
Texas:
5.5% (322,702)
Number of households with income $20k - 30k:
Richland Springs:
40.0% (22)
Texas:
6.2% (363,947)
Number of households with income $30k - 40k:
Richland Springs:
1.8% (1)
State:
6.8% (399,275)
Number of households with income $40k - 50k:
Richland Springs:
7.3% (4)
State:
6.5% (383,417)
Number of households with income $50k - 60k:
Richland Springs:
1.8% (1)
State:
6.6% (388,535)
Number of households with income $60k - 75k:
Richland Springs:
0.0% (0)
State:
9.7% (566,295)
Number of households with income $75k - 100k:
Richland Springs:
12.7% (7)
State:
13.0% (760,276)
Number of households with income $100k - 125k:
Richland Springs:
3.6% (2)
State:
10.2% (597,596)
Number of households with income $125k - 150k:
Richland Springs:
0.0% (0)
State:
7.4% (436,830)
Number of households with income $150k - 200k:
Richland Springs:
3.6% (2)
State:
9.9% (583,067)
Number of households with income > $200k:
Richland Springs:
9.1% (5)
State:
13.5% (792,647)
Aggregate household income in Richland Springs in 2022: $3,659,640
Median non-family income in Richland Springs in 2022:
Richland Springs:
$18,340
State:
$50,587
Change in median non-family income between 2000 and 2022:
Richland Springs, Texas:
+49.9%
State:
+87.7%
Median per capita income in Richland Springs in 2022:
Richland Springs:
$27,403
State:
$47,740
Change in median per capita income between 2000 and 2022:
Richland Springs, Texas:
+92.4%
Texas:
+114.3%
Income statistics for Hispanic or Latino residents
Aggregate household income in Richland Springs in 2022: $1,322,085
Median per capita income in Richland Springs in 2022:
Richland Springs:
$26,651
State:
$24,862
Change in median per capita income between 2000 and 2022:
Richland Springs, Texas:
+20.4%
Texas:
+130.8%
Income statistics for Multirace residents
Median per capita income in Richland Springs in 2022:
Richland Springs:
$1,225
State:
$26,785
Change in median per capita income between 2000 and 2022:: -97.5%
Richland Springs, Texas:
-97.5%
State:
+110.9%
Discuss Richland Springs, Texas (TX) on our hugely popular Texas forum.