The median household income in Richton Park, IL in 2022 was $68,202, which was 12.5% less than the median annual income of $76,708 across the entire state of Illinois. Compared to the median income of $48,299 in 2000 this represents an increase of 29.2%. The per capita income in 2022 was $32,555, which means an increase of 30.5% compared to 2000 when it was $22,626.
Whole page based on the data from 2000 / 2022 when the population of Richton Park, Illinois was 12,533 / 12,438
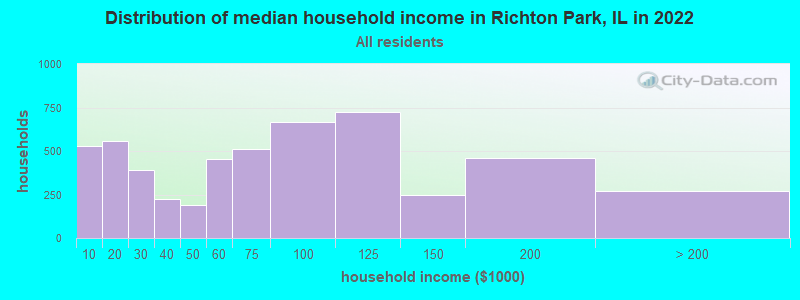
Income statistics for all residents
Median household income in Richton Park, IL in 2022:
Richton Park:
$68,203
State:
$76,708
Change in median household income between 2000 and 2022:
Richton Park, Illinois:
+41.2%
State:
+64.6%
Number of households with income < $10k:
Richton Park:
10.2% (531)
State:
5.9% (296,090)
Number of households with income $10k - 20k:
Richton Park:
10.6% (555)
Illinois:
6.6% (333,259)
Number of households with income $20k - 30k:
Richton Park:
7.5% (393)
Illinois:
6.8% (342,921)
Number of households with income $30k - 40k:
Richton Park:
4.3% (225)
State:
7.0% (355,254)
Number of households with income $40k - 50k:
Richton Park:
3.6% (188)
State:
6.7% (340,678)
Number of households with income $50k - 60k:
Richton Park:
8.6% (452)
State:
6.7% (339,405)
Number of households with income $60k - 75k:
Richton Park:
9.8% (512)
Illinois:
9.2% (465,709)
Number of households with income $75k - 100k:
Richton Park:
12.8% (668)
State:
12.9% (651,353)
Number of households with income $100k - 125k:
Richton Park:
13.9% (725)
State:
10.3% (522,359)
Number of households with income $125k - 150k:
Richton Park:
4.7% (248)
State:
7.3% (367,136)
Number of households with income $150k - 200k:
Richton Park:
8.8% (462)
State:
9.0% (455,249)
Number of households with income > $200k:
Richton Park:
5.2% (270)
State:
11.6% (586,947)
Aggregate household income in Richton Park in 2022: $404,433,241
Median family income in Richton Park in 2022:
Richton Park:
$95,416
State:
$96,948
Number of families with income < $10k:
Richton Park:
4.1% (126)
State:
3.4% (105,875)
Number of families with income $10k - 20k:
Richton Park:
0.8% (26)
State:
3.3% (105,017)
Number of families with income $20k - 30k:
Richton Park:
3.9% (119)
State:
4.7% (146,403)
Number of families with income $30k - 40k:
Richton Park:
4.6% (142)
State:
5.3% (167,069)
Number of families with income $40k - 50k:
Richton Park:
4.2% (130)
State:
5.8% (181,164)
Number of families with income $50k - 60k:
Richton Park:
8.5% (262)
State:
6.1% (191,561)
Number of families with income $60k - 75k:
Richton Park:
13.0% (398)
State:
9.0% (282,985)
Number of families with income $75k - 100k:
Richton Park:
13.6% (418)
Illinois:
13.8% (432,725)
Number of families with income $100k - 125k:
Richton Park:
17.2% (529)
State:
11.9% (373,296)
Number of families with income $125k - 150k:
Richton Park:
7.1% (219)
Illinois:
8.9% (279,791)
Number of families with income $150k - 200k:
Richton Park:
14.6% (448)
State:
11.9% (372,004)
Number of families with income > $200k:
Richton Park:
8.2% (251)
State:
15.9% (500,033)
Median non-family income in Richton Park in 2022:
Richton Park:
$24,028
Illinois:
$46,533
Change in median non-family income between 2000 and 2022:: -19.7%
Richton Park, Illinois:
-19.7%
Illinois:
+64.0%
Median per capita income in Richton Park in 2022:
Richton Park:
$32,555
Illinois:
$43,317
Change in median per capita income between 2000 and 2022:
Richton Park, Illinois:
+43.9%
State:
+87.5%
Income statistics for White residents
Median household income in Richton Park, IL in 2022:
Richton Park:
$27,574
State:
$83,346
Change in median household income between 2000 and 2022:: -41.0%
Richton Park, Illinois:
-41.0%
Illinois:
+67.5%
Number of households with income < $10k:
Richton Park:
14.8% (68)
State:
4.5% (149,895)
Number of households with income $10k - 20k:
Richton Park:
19.0% (87)
State:
5.5% (184,529)
Number of households with income $20k - 30k:
Richton Park:
22.3% (102)
State:
6.1% (205,767)
Number of households with income $30k - 40k:
Richton Park:
5.9% (27)
State:
6.7% (225,572)
Number of households with income $40k - 50k:
Richton Park:
0.0% (0)
Illinois:
6.5% (216,965)
Number of households with income $50k - 60k:
Richton Park:
13.3% (61)
State:
6.6% (222,841)
Number of households with income $60k - 75k:
Richton Park:
0.0% (0)
State:
9.3% (312,758)
Number of households with income $75k - 100k:
Richton Park:
5.2% (24)
State:
12.9% (433,180)
Number of households with income $100k - 125k:
Richton Park:
8.7% (40)
Illinois:
10.7% (360,753)
Number of households with income $125k - 150k:
Richton Park:
7.0% (32)
State:
7.9% (266,532)
Number of households with income $150k - 200k:
Richton Park:
3.7% (17)
Illinois:
10.0% (337,357)
Number of households with income > $200k:
Richton Park:
0.0% (0)
State:
13.3% (446,069)
Aggregate household income in Richton Park in 2022: $22,738,334
Median family income in Richton Park in 2022:
Richton Park:
$94,916
State:
$107,938
Number of families with income < $10k:
Richton Park:
13.4% (19)
State:
2.2% (45,983)
Number of families with income $30k - 40k:
Richton Park:
6.7% (9)
Illinois:
4.4% (90,563)
Number of families with income $50k - 60k:
Richton Park:
20.9% (29)
State:
5.8% (119,129)
Number of families with income $75k - 100k:
Richton Park:
16.1% (23)
State:
13.5% (276,887)
Number of families with income $100k - 125k:
Richton Park:
17.1% (24)
State:
12.5% (256,099)
Number of families with income $125k - 150k:
Richton Park:
20.9% (29)
Illinois:
9.8% (199,855)
Number of families with income $150k - 200k:
Richton Park:
4.9% (7)
Illinois:
13.4% (274,569)
Median non-family income in Richton Park in 2022:
Richton Park:
$21,755
State:
$50,934
Change in median non-family income between 2000 and 2022:: -11.7%
Richton Park, Illinois:
-11.7%
Illinois:
+70.7%
Median per capita income in Richton Park in 2022:
Richton Park:
$33,515
Illinois:
$50,738
Change in median per capita income between 2000 and 2022:
Richton Park, Illinois:
+42.8%
State:
+95.5%
Income statistics for Black or African American residents
Median household income in Richton Park, IL in 2022:
Richton Park:
$70,791
State:
$45,019
Change in median household income between 2000 and 2022:
Richton Park, Illinois:
+41.8%
State:
+42.0%
Number of households with income < $10k:
Richton Park:
10.3% (456)
State:
13.3% (92,224)
Number of households with income $10k - 20k:
Richton Park:
10.4% (464)
Illinois:
13.5% (93,732)
Number of households with income $20k - 30k:
Richton Park:
6.1% (270)
State:
9.9% (68,453)
Number of households with income $30k - 40k:
Richton Park:
3.9% (175)
Illinois:
8.5% (59,072)
Number of households with income $40k - 50k:
Richton Park:
4.2% (187)
Illinois:
7.9% (55,033)
Number of households with income $50k - 60k:
Richton Park:
8.1% (358)
Illinois:
7.2% (49,556)
Number of households with income $60k - 75k:
Richton Park:
9.7% (432)
State:
7.8% (53,726)
Number of households with income $75k - 100k:
Richton Park:
14.1% (626)
State:
11.6% (80,439)
Number of households with income $100k - 125k:
Richton Park:
14.6% (647)
State:
7.5% (52,244)
Number of households with income $125k - 150k:
Richton Park:
4.0% (176)
Illinois:
3.9% (27,058)
Number of households with income $150k - 200k:
Richton Park:
9.3% (415)
Illinois:
4.6% (32,057)
Number of households with income > $200k:
Richton Park:
5.4% (240)
State:
4.1% (28,731)
Aggregate household income in Richton Park in 2022: $351,471,040
Median family income in Richton Park in 2022:
Richton Park:
$98,001
State:
$60,661
Number of families with income < $10k:
Richton Park:
2.6% (70)
State:
9.5% (35,136)
Number of families with income $10k - 20k:
Richton Park:
1.0% (27)
State:
7.9% (29,324)
Number of families with income $20k - 30k:
Richton Park:
4.5% (120)
State:
8.8% (32,666)
Number of families with income $30k - 40k:
Richton Park:
4.4% (116)
State:
7.8% (28,775)
Number of families with income $40k - 50k:
Richton Park:
5.2% (139)
Illinois:
8.5% (31,429)
Number of families with income $50k - 60k:
Richton Park:
8.0% (212)
State:
7.1% (26,341)
Number of families with income $60k - 75k:
Richton Park:
13.1% (348)
Illinois:
8.3% (30,626)
Number of families with income $75k - 100k:
Richton Park:
13.9% (370)
Illinois:
14.0% (51,750)
Number of families with income $100k - 125k:
Richton Park:
17.5% (464)
State:
9.3% (34,471)
Number of families with income $125k - 150k:
Richton Park:
6.4% (170)
State:
5.7% (21,103)
Number of families with income $150k - 200k:
Richton Park:
15.1% (402)
Illinois:
6.8% (25,177)
Number of families with income > $200k:
Richton Park:
8.2% (219)
Illinois:
6.3% (23,371)
Median non-family income in Richton Park in 2022:
Richton Park:
$24,307
Illinois:
$29,966
Change in median non-family income between 2000 and 2022:: -31.5%
Richton Park, Illinois:
-31.5%
Illinois:
+44.4%
Median per capita income in Richton Park in 2022:
Richton Park:
$32,553
Illinois:
$28,045
Change in median per capita income between 2000 and 2022:
Richton Park, Illinois:
+45.5%
State:
+90.2%
Income statistics for Asian residents
Number of households with income < $10k:
Richton Park:
0.0% (0)
State:
5.3% (14,653)
Number of households with income $10k - 20k:
Richton Park:
0.0% (0)
State:
4.5% (12,283)
Number of households with income $20k - 30k:
Richton Park:
0.0% (0)
Illinois:
4.8% (13,135)
Number of households with income $30k - 40k:
Richton Park:
14.8% (4)
State:
5.0% (13,655)
Number of households with income $40k - 50k:
Richton Park:
0.0% (0)
Illinois:
4.5% (12,357)
Number of households with income $50k - 60k:
Richton Park:
0.0% (0)
State:
4.9% (13,568)
Number of households with income $60k - 75k:
Richton Park:
0.0% (0)
State:
7.1% (19,606)
Number of households with income $75k - 100k:
Richton Park:
85.2% (23)
Illinois:
12.1% (33,349)
Number of households with income $100k - 125k:
Richton Park:
0.0% (0)
State:
9.7% (26,669)
Number of households with income $125k - 150k:
Richton Park:
0.0% (0)
State:
7.3% (20,172)
Number of households with income $150k - 200k:
Richton Park:
0.0% (0)
State:
11.5% (31,711)
Number of households with income > $200k:
Richton Park:
0.0% (0)
Illinois:
23.1% (63,411)
Aggregate household income in Richton Park in 2022: $13,493,775
Median per capita income in Richton Park in 2022:
Richton Park:
$103,091
State:
$52,977
Income statistics for Hispanic or Latino residents
Median household income in Richton Park, IL in 2022:
Richton Park:
$103,949
Illinois:
$72,139
Number of households with income < $10k:
Richton Park:
10.7% (11)
State:
4.9% (33,145)
Number of households with income $10k - 20k:
Richton Park:
19.4% (20)
State:
5.4% (36,345)
Number of households with income $20k - 30k:
Richton Park:
0.0% (0)
State:
7.5% (50,677)
Number of households with income $30k - 40k:
Richton Park:
0.0% (0)
State:
7.7% (52,008)
Number of households with income $40k - 50k:
Richton Park:
0.0% (0)
Illinois:
8.1% (54,702)
Number of households with income $50k - 60k:
Richton Park:
0.0% (0)
Illinois:
7.5% (51,062)
Number of households with income $60k - 75k:
Richton Park:
0.0% (0)
Illinois:
11.3% (76,576)
Number of households with income $75k - 100k:
Richton Park:
0.0% (0)
State:
15.5% (105,152)
Number of households with income $100k - 125k:
Richton Park:
57.3% (59)
State:
11.5% (77,760)
Number of households with income $125k - 150k:
Richton Park:
12.6% (13)
State:
7.3% (49,310)
Number of households with income $150k - 200k:
Richton Park:
0.0% (0)
State:
7.6% (51,233)
Number of households with income > $200k:
Richton Park:
0.0% (0)
Illinois:
5.9% (40,028)
Aggregate household income in Richton Park in 2022: $7,897,285
Median per capita income in Richton Park in 2022:
Richton Park:
$28,750
State:
$26,551
Change in median per capita income between 2000 and 2022:
Richton Park, Illinois:
+94.3%
Illinois:
+111.0%
Income statistics for Multirace residents
Number of households with income < $10k:
Richton Park:
10.6% (15)
State:
5.3% (21,595)
Number of households with income $10k - 20k:
Richton Park:
0.0% (0)
State:
6.5% (26,720)
Number of households with income $20k - 30k:
Richton Park:
0.0% (0)
State:
8.0% (32,573)
Number of households with income $30k - 40k:
Richton Park:
0.0% (0)
Illinois:
8.4% (34,383)
Number of households with income $40k - 50k:
Richton Park:
0.0% (0)
State:
7.4% (30,234)
Number of households with income $50k - 60k:
Richton Park:
9.9% (14)
State:
6.9% (28,432)
Number of households with income $60k - 75k:
Richton Park:
21.8% (31)
State:
10.2% (41,780)
Number of households with income $75k - 100k:
Richton Park:
11.3% (16)
State:
13.0% (53,426)
Number of households with income $100k - 125k:
Richton Park:
0.0% (0)
Illinois:
10.5% (43,126)
Number of households with income $125k - 150k:
Richton Park:
17.6% (25)
State:
7.6% (31,153)
Number of households with income $150k - 200k:
Richton Park:
0.0% (0)
Illinois:
7.6% (30,946)
Number of households with income > $200k:
Richton Park:
28.9% (41)
State:
8.6% (35,208)
Aggregate household income in Richton Park in 2022: $18,117,267
Median per capita income in Richton Park in 2022:
Richton Park:
$28,622
State:
$29,285
Change in median per capita income between 2000 and 2022:
Richton Park, Illinois:
+64.7%
Illinois:
+112.9%
Income statistics for other residents
Median household income in Richton Park, IL in 2022:
Richton Park:
$119,242
State:
$71,711
Number of households with income < $10k:
Richton Park:
0.0% (0)
Illinois:
5.7% (16,383)
Number of households with income $10k - 20k:
Richton Park:
0.0% (0)
Illinois:
4.8% (13,886)
Number of households with income $20k - 30k:
Richton Park:
0.0% (0)
State:
7.0% (20,054)
Number of households with income $30k - 40k:
Richton Park:
0.0% (0)
State:
7.0% (20,038)
Number of households with income $40k - 50k:
Richton Park:
0.0% (0)
State:
8.3% (23,759)
Number of households with income $50k - 60k:
Richton Park:
0.0% (0)
Illinois:
7.8% (22,410)
Number of households with income $60k - 75k:
Richton Park:
0.0% (0)
State:
12.0% (34,448)
Number of households with income $75k - 100k:
Richton Park:
0.0% (0)
State:
16.2% (46,508)
Number of households with income $100k - 125k:
Richton Park:
78.1% (50)
State:
12.5% (35,952)
Number of households with income $125k - 150k:
Richton Park:
21.9% (14)
State:
6.9% (19,732)
Number of households with income $150k - 200k:
Richton Park:
0.0% (0)
State:
7.5% (21,422)
Number of households with income > $200k:
Richton Park:
0.0% (0)
State:
4.3% (12,194)
Aggregate household income in Richton Park in 2022: $6,867,869
Median per capita income in Richton Park in 2022:
Richton Park:
$46,423
State:
$25,392
Discuss Richton Park, Illinois (IL) on our hugely popular Illinois forum.