Rifton, New York (NY) income map, earnings map, and wages data

Data:
The per capita income in 2022 was $57,405, which means an increase of 61.7% compared to 2000 when it was $22,015.
Whole page based on the data from 2000 / 2022 when the population of Rifton, New York was 501 / 548
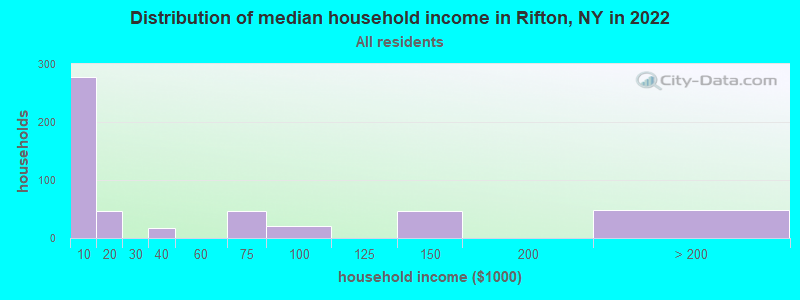
Income statistics for all residents
Number of households with income < $10k:| Rifton: | 55.3% (278) |
| New York: | 6.8% (527,598) |
Number of households with income $10k - 20k:| Rifton: | 9.3% (47) |
| New York: | 7.4% (574,940) |
Number of households with income $20k - 30k:| Rifton: | 0.0% (0) |
| New York: | 6.7% (517,718) |
Number of households with income $30k - 40k:| Rifton: | 3.4% (17) |
| State: | 6.5% (506,674) |
Number of households with income $40k - 50k:| Rifton: | 0.0% (0) |
| State: | 6.1% (470,439) |
Number of households with income $50k - 60k:| Rifton: | 0.0% (0) |
| New York: | 5.8% (454,042) |
Number of households with income $60k - 75k:| Rifton: | 9.3% (47) |
| State: | 8.5% (657,508) |
Number of households with income $75k - 100k:| Rifton: | 4.0% (20) |
| State: | 11.6% (899,824) |
Number of households with income $100k - 125k:| Rifton: | 0.0% (0) |
| State: | 9.3% (723,825) |
Number of households with income $125k - 150k:| Rifton: | 9.1% (46) |
| State: | 7.1% (552,420) |
Number of households with income $150k - 200k:| Rifton: | 0.0% (0) |
| New York: | 9.4% (727,051) |
Number of households with income > $200k:| Rifton: | 9.5% (48) |
| State: | 15.0% (1,162,269) |
Aggregate household income in Rifton in 2022: $32,961,218
Median non-family income in Rifton in 2022:| Rifton: | $2,905 |
| State: | $50,181 |
Median per capita income in Rifton in 2022:| Rifton: | $57,406 |
| State: | $47,421 |
Income statistics for White residents
Median household income in Rifton, NY in 2022:| Rifton: | $2,705 |
| State: | $89,408 |
Number of households with income < $10k:| Rifton: | 57.1% (256) |
| State: | 4.8% (225,550) |
Number of households with income $10k - 20k:| Rifton: | 2.5% (11) |
| State: | 6.1% (289,425) |
Number of households with income $20k - 30k:| Rifton: | 0.0% (0) |
| New York: | 5.9% (280,254) |
Number of households with income $30k - 40k:| Rifton: | 3.6% (16) |
| State: | 6.1% (288,263) |
Number of households with income $40k - 50k:| Rifton: | 0.0% (0) |
| State: | 5.9% (278,079) |
Number of households with income $50k - 60k:| Rifton: | 0.0% (0) |
| State: | 5.7% (267,554) |
Number of households with income $60k - 75k:| Rifton: | 10.7% (48) |
| New York: | 8.4% (398,344) |
Number of households with income $75k - 100k:| Rifton: | 4.7% (21) |
| State: | 11.8% (554,841) |
Number of households with income $100k - 125k:| Rifton: | 0.0% (0) |
| State: | 10.0% (469,794) |
Number of households with income $125k - 150k:| Rifton: | 10.5% (47) |
| New York: | 7.6% (360,467) |
Number of households with income $150k - 200k:| Rifton: | 0.0% (0) |
| New York: | 10.1% (477,078) |
Number of households with income > $200k:| Rifton: | 10.9% (49) |
| State: | 17.6% (829,233) |
Aggregate household income in Rifton in 2022: $32,021,438
Median non-family income in Rifton in 2022:| Rifton: | $3,098 |
| State: | $54,783 |
Median per capita income in Rifton in 2022:| Rifton: | $64,396 |
| New York: | $57,640 |