The median household income in Roaring Spring, PA in 2022 was $61,742, which was 16.3% less than the median annual income of $71,798 across the entire state of Pennsylvania. Compared to the median income of $35,329 in 2000 this represents an increase of 42.8%. The per capita income in 2022 was $29,284, which means an increase of 38.6% compared to 2000 when it was $17,972.
Whole page based on the data from 2000 / 2022 when the population of Roaring Spring, Pennsylvania was 2,418 / 2,479
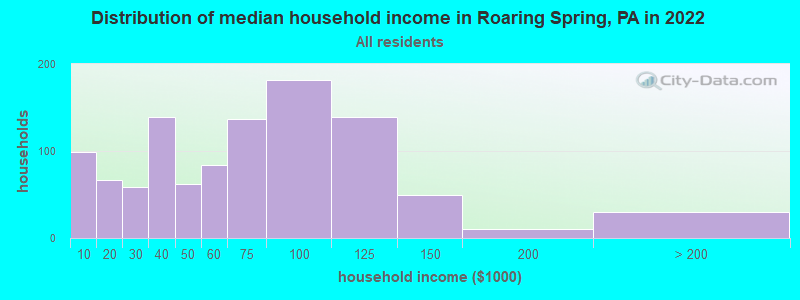
Income statistics for all residents
Median household income in Roaring Spring, PA in 2022:
Roaring Spring:
$61,743
Pennsylvania:
$71,798
Change in median household income between 2000 and 2022:
Roaring Spring, Pennsylvania:
+74.8%
Pennsylvania:
+79.0%
Number of households with income < $10k:
Roaring Spring:
9.4% (99)
Pennsylvania:
5.5% (291,562)
Number of households with income $10k - 20k:
Roaring Spring:
6.3% (67)
State:
7.3% (384,726)
Number of households with income $20k - 30k:
Roaring Spring:
5.6% (59)
Pennsylvania:
7.4% (389,464)
Number of households with income $30k - 40k:
Roaring Spring:
13.1% (139)
State:
7.6% (402,138)
Number of households with income $40k - 50k:
Roaring Spring:
5.9% (62)
State:
7.3% (387,945)
Number of households with income $50k - 60k:
Roaring Spring:
7.9% (84)
State:
7.0% (372,468)
Number of households with income $60k - 75k:
Roaring Spring:
12.9% (137)
Pennsylvania:
9.9% (524,786)
Number of households with income $75k - 100k:
Roaring Spring:
17.2% (182)
State:
12.6% (666,253)
Number of households with income $100k - 125k:
Roaring Spring:
13.1% (139)
State:
9.9% (526,402)
Number of households with income $125k - 150k:
Roaring Spring:
4.7% (50)
State:
6.9% (362,702)
Number of households with income $150k - 200k:
Roaring Spring:
0.9% (10)
State:
8.3% (440,827)
Number of households with income > $200k:
Roaring Spring:
2.8% (30)
Pennsylvania:
10.3% (544,792)
Aggregate household income in Roaring Spring in 2022: $71,683,714
Median family income in Roaring Spring in 2022:
Roaring Spring:
$80,112
State:
$93,029
Number of families with income < $10k:
Roaring Spring:
6.5% (49)
State:
3.1% (101,868)
Number of families with income $10k - 20k:
Roaring Spring:
4.0% (30)
State:
3.5% (115,881)
Number of families with income $20k - 30k:
Roaring Spring:
3.5% (26)
State:
4.8% (156,521)
Number of families with income $30k - 40k:
Roaring Spring:
8.7% (65)
State:
5.8% (191,305)
Number of families with income $40k - 50k:
Roaring Spring:
6.7% (50)
State:
6.4% (211,380)
Number of families with income $50k - 60k:
Roaring Spring:
6.1% (45)
State:
6.4% (209,910)
Number of families with income $60k - 75k:
Roaring Spring:
10.8% (81)
State:
9.7% (318,991)
Number of families with income $75k - 100k:
Roaring Spring:
22.6% (169)
State:
14.0% (461,021)
Number of families with income $100k - 125k:
Roaring Spring:
19.2% (144)
State:
12.2% (400,961)
Number of families with income $125k - 150k:
Roaring Spring:
6.7% (50)
Pennsylvania:
8.8% (288,471)
Number of families with income $150k - 200k:
Roaring Spring:
1.3% (10)
State:
11.2% (367,642)
Number of families with income > $200k:
Roaring Spring:
4.0% (30)
State:
14.3% (470,863)
Median non-family income in Roaring Spring in 2022:
Roaring Spring:
$37,283
State:
$42,203
Change in median non-family income between 2000 and 2022:
Roaring Spring, Pennsylvania:
+115.0%
Pennsylvania:
+90.1%
Median per capita income in Roaring Spring in 2022:
Roaring Spring:
$29,284
State:
$41,489
Change in median per capita income between 2000 and 2022:
Roaring Spring, Pennsylvania:
+62.9%
State:
+98.7%
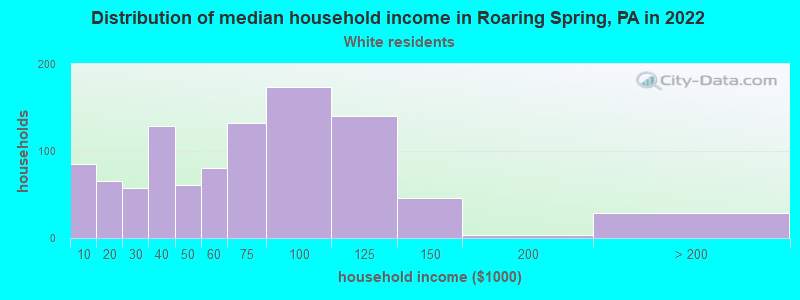
Income statistics for White residents
Median household income in Roaring Spring, PA in 2022:
Roaring Spring:
$61,944
State:
$76,765
Change in median household income between 2000 and 2022:
Roaring Spring, Pennsylvania:
+74.0%
State:
+84.3%
Number of households with income < $10k:
Roaring Spring:
8.5% (85)
Pennsylvania:
4.3% (179,792)
Number of households with income $10k - 20k:
Roaring Spring:
6.5% (65)
State:
6.5% (268,738)
Number of households with income $20k - 30k:
Roaring Spring:
5.7% (57)
State:
7.0% (288,138)
Number of households with income $30k - 40k:
Roaring Spring:
12.9% (129)
Pennsylvania:
7.2% (300,208)
Number of households with income $40k - 50k:
Roaring Spring:
6.1% (61)
State:
7.2% (298,756)
Number of households with income $50k - 60k:
Roaring Spring:
8.0% (80)
State:
6.8% (283,251)
Number of households with income $60k - 75k:
Roaring Spring:
13.2% (132)
State:
9.9% (408,159)
Number of households with income $75k - 100k:
Roaring Spring:
17.3% (173)
State:
13.2% (547,809)
Number of households with income $100k - 125k:
Roaring Spring:
14.0% (140)
State:
10.5% (436,652)
Number of households with income $125k - 150k:
Roaring Spring:
4.6% (46)
State:
7.3% (304,132)
Number of households with income $150k - 200k:
Roaring Spring:
0.3% (3)
State:
9.0% (374,658)
Number of households with income > $200k:
Roaring Spring:
2.9% (29)
State:
10.9% (452,618)
Aggregate household income in Roaring Spring in 2022: $67,329,359
Median family income in Roaring Spring in 2022:
Roaring Spring:
$81,052
Pennsylvania:
$99,396
Number of families with income < $10k:
Roaring Spring:
5.4% (39)
State:
2.2% (56,136)
Number of families with income $10k - 20k:
Roaring Spring:
4.7% (34)
State:
2.7% (69,032)
Number of families with income $20k - 30k:
Roaring Spring:
4.0% (29)
State:
3.9% (100,065)
Number of families with income $30k - 40k:
Roaring Spring:
8.3% (60)
State:
5.2% (134,367)
Number of families with income $40k - 50k:
Roaring Spring:
6.5% (47)
State:
6.0% (154,327)
Number of families with income $50k - 60k:
Roaring Spring:
6.3% (46)
Pennsylvania:
6.1% (157,983)
Number of families with income $60k - 75k:
Roaring Spring:
11.1% (80)
State:
9.6% (249,292)
Number of families with income $75k - 100k:
Roaring Spring:
22.5% (162)
Pennsylvania:
14.7% (379,316)
Number of families with income $100k - 125k:
Roaring Spring:
20.0% (145)
Pennsylvania:
12.9% (333,626)
Number of families with income $125k - 150k:
Roaring Spring:
6.5% (47)
Pennsylvania:
9.4% (243,915)
Number of families with income $150k - 200k:
Roaring Spring:
0.4% (3)
State:
12.2% (314,926)
Number of families with income > $200k:
Roaring Spring:
4.3% (31)
Pennsylvania:
15.1% (390,885)
Median non-family income in Roaring Spring in 2022:
Roaring Spring:
$37,728
State:
$44,251
Change in median non-family income between 2000 and 2022:
Roaring Spring, Pennsylvania:
+117.5%
State:
+94.2%
Median per capita income in Roaring Spring in 2022:
Roaring Spring:
$29,727
Pennsylvania:
$45,306
Change in median per capita income between 2000 and 2022:
Roaring Spring, Pennsylvania:
+64.5%
State:
+105.4%
Income statistics for Asian residents
Aggregate household income in Roaring Spring in 2022: $967,394
Median per capita income in Roaring Spring in 2022:
Roaring Spring:
$19,472
Pennsylvania:
$48,341
Income statistics for Hispanic or Latino residents
Number of households with income < $10k:
Roaring Spring:
0.0% (0)
State:
8.7% (29,517)
Number of households with income $10k - 20k:
Roaring Spring:
0.0% (0)
State:
10.0% (33,785)
Number of households with income $20k - 30k:
Roaring Spring:
0.0% (0)
Pennsylvania:
9.9% (33,399)
Number of households with income $30k - 40k:
Roaring Spring:
0.0% (0)
Pennsylvania:
8.8% (29,878)
Number of households with income $40k - 50k:
Roaring Spring:
0.0% (0)
State:
8.5% (28,549)
Number of households with income $50k - 60k:
Roaring Spring:
0.0% (0)
State:
7.6% (25,792)
Number of households with income $60k - 75k:
Roaring Spring:
100.0% (34)
State:
10.6% (35,808)
Number of households with income $75k - 100k:
Roaring Spring:
0.0% (0)
Pennsylvania:
11.9% (40,287)
Number of households with income $100k - 125k:
Roaring Spring:
0.0% (0)
State:
8.0% (27,028)
Number of households with income $125k - 150k:
Roaring Spring:
0.0% (0)
Pennsylvania:
5.2% (17,622)
Number of households with income $150k - 200k:
Roaring Spring:
0.0% (0)
State:
5.2% (17,563)
Number of households with income > $200k:
Roaring Spring:
0.0% (0)
State:
5.5% (18,469)
Median per capita income in Roaring Spring in 2022:
Roaring Spring:
$36,916
Pennsylvania:
$23,829
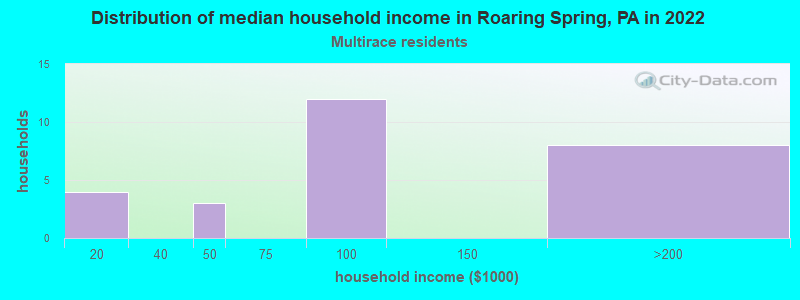
Income statistics for Multirace residents
Number of households with income < $10k:
Roaring Spring:
0.0% (0)
State:
7.8% (21,911)
Number of households with income $10k - 20k:
Roaring Spring:
14.8% (4)
State:
8.2% (22,847)
Number of households with income $20k - 30k:
Roaring Spring:
0.0% (0)
Pennsylvania:
8.7% (24,252)
Number of households with income $30k - 40k:
Roaring Spring:
0.0% (0)
State:
7.3% (20,502)
Number of households with income $40k - 50k:
Roaring Spring:
11.1% (3)
State:
7.7% (21,525)
Number of households with income $50k - 60k:
Roaring Spring:
0.0% (0)
Pennsylvania:
8.6% (24,174)
Number of households with income $60k - 75k:
Roaring Spring:
0.0% (0)
State:
11.9% (33,350)
Number of households with income $75k - 100k:
Roaring Spring:
44.4% (12)
State:
11.5% (32,274)
Number of households with income $100k - 125k:
Roaring Spring:
0.0% (0)
State:
8.3% (23,361)
Number of households with income $125k - 150k:
Roaring Spring:
0.0% (0)
State:
5.3% (14,784)
Number of households with income $150k - 200k:
Roaring Spring:
29.6% (8)
State:
6.9% (19,314)
Number of households with income > $200k:
Roaring Spring:
0.0% (0)
State:
7.8% (21,759)
Aggregate household income in Roaring Spring in 2022: $3,213,820
Median per capita income in Roaring Spring in 2022:
Roaring Spring:
$15,695
State:
$27,581
Discuss Roaring Spring, Pennsylvania (PA) on our hugely popular Pennsylvania forum.