The median household income in Roby, TX in 2022 was $53,708, which was 34.6% less than the median annual income of $72,284 across the entire state of Texas. Compared to the median income of $27,031 in 2000 this represents an increase of 49.7%. The per capita income in 2022 was $28,935, which means an increase of 51.9% compared to 2000 when it was $13,926.
Whole page based on the data from 2000 / 2022 when the population of Roby, Texas was 673 / 693
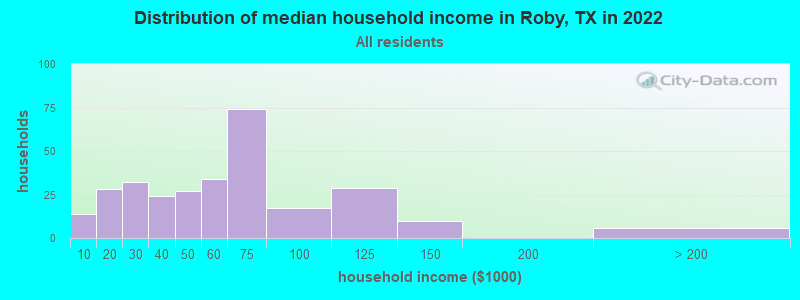
Income statistics for all residents
Median household income in Roby, TX in 2022:
Roby:
$53,709
State:
$72,284
Change in median household income between 2000 and 2022:
Roby, Texas:
+98.7%
State:
+81.0%
Number of households with income < $10k:
Roby:
4.7% (14)
State:
5.5% (611,011)
Number of households with income $10k - 20k:
Roby:
9.5% (28)
State:
6.7% (743,157)
Number of households with income $20k - 30k:
Roby:
10.8% (32)
Texas:
7.2% (803,381)
Number of households with income $30k - 40k:
Roby:
8.1% (24)
Texas:
7.8% (866,080)
Number of households with income $40k - 50k:
Roby:
9.2% (27)
State:
7.3% (810,440)
Number of households with income $50k - 60k:
Roby:
11.5% (34)
State:
7.2% (799,783)
Number of households with income $60k - 75k:
Roby:
25.1% (74)
State:
9.9% (1,095,384)
Number of households with income $75k - 100k:
Roby:
5.8% (17)
Texas:
12.8% (1,419,057)
Number of households with income $100k - 125k:
Roby:
9.8% (29)
Texas:
9.5% (1,054,577)
Number of households with income $125k - 150k:
Roby:
3.4% (10)
State:
6.7% (741,518)
Number of households with income $150k - 200k:
Roby:
0.0% (0)
State:
8.7% (961,776)
Number of households with income > $200k:
Roby:
2.0% (6)
State:
10.7% (1,181,544)
Aggregate household income in Roby in 2022: $17,699,223
Median family income in Roby in 2022:
Roby:
$52,794
Texas:
$86,267
Number of families with income < $10k:
Roby:
5.7% (11)
State:
4.0% (297,884)
Number of families with income $10k - 20k:
Roby:
8.9% (16)
Texas:
4.3% (324,514)
Number of families with income $20k - 30k:
Roby:
1.1% (2)
State:
5.8% (430,949)
Number of families with income $30k - 40k:
Roby:
9.1% (17)
State:
6.6% (493,535)
Number of families with income $40k - 50k:
Roby:
13.9% (26)
State:
6.7% (499,663)
Number of families with income $50k - 60k:
Roby:
21.3% (39)
State:
6.6% (492,203)
Number of families with income $60k - 75k:
Roby:
23.7% (44)
State:
9.5% (710,229)
Number of families with income $75k - 100k:
Roby:
2.3% (4)
State:
13.6% (1,015,480)
Number of families with income $100k - 125k:
Roby:
10.5% (19)
Texas:
10.7% (797,961)
Number of families with income > $200k:
Roby:
3.4% (6)
State:
13.5% (1,013,514)
Median per capita income in Roby in 2022:
Roby:
$28,935
State:
$38,123
Change in median per capita income between 2000 and 2022:
Roby, Texas:
+107.8%
State:
+94.3%
Income statistics for White residents
Median household income in Roby, TX in 2022:
Roby:
$54,714
Texas:
$82,032
Change in median household income between 2000 and 2022:
Roby, Texas:
+101.2%
State:
+91.0%
Number of households with income < $10k:
Roby:
5.6% (12)
State:
4.7% (273,716)
Number of households with income $10k - 20k:
Roby:
8.8% (19)
State:
5.5% (322,702)
Number of households with income $20k - 30k:
Roby:
11.6% (25)
Texas:
6.2% (363,947)
Number of households with income $30k - 40k:
Roby:
8.8% (19)
State:
6.8% (399,275)
Number of households with income $40k - 50k:
Roby:
9.3% (20)
State:
6.5% (383,417)
Number of households with income $50k - 60k:
Roby:
12.6% (27)
Texas:
6.6% (388,535)
Number of households with income $60k - 75k:
Roby:
21.4% (46)
Texas:
9.7% (566,295)
Number of households with income $75k - 100k:
Roby:
6.5% (14)
State:
13.0% (760,276)
Number of households with income $100k - 125k:
Roby:
8.4% (18)
Texas:
10.2% (597,596)
Number of households with income $125k - 150k:
Roby:
4.2% (9)
State:
7.4% (436,830)
Number of households with income $150k - 200k:
Roby:
0.0% (0)
State:
9.9% (583,067)
Number of households with income > $200k:
Roby:
2.8% (6)
State:
13.5% (792,647)
Aggregate household income in Roby in 2022: $13,527,201
Median family income in Roby in 2022:
Roby:
$55,005
State:
$101,788
Number of families with income < $10k:
Roby:
6.6% (8)
State:
2.8% (108,142)
Number of families with income $10k - 20k:
Roby:
9.6% (11)
Texas:
2.9% (113,421)
Number of families with income $20k - 30k:
Roby:
1.1% (1)
Texas:
4.1% (157,688)
Number of families with income $30k - 40k:
Roby:
10.2% (12)
State:
5.2% (198,847)
Number of families with income $40k - 50k:
Roby:
14.8% (18)
State:
5.6% (216,490)
Number of families with income $50k - 60k:
Roby:
25.2% (30)
Texas:
5.7% (220,689)
Number of families with income $60k - 75k:
Roby:
16.7% (20)
State:
9.0% (346,106)
Number of families with income $75k - 100k:
Roby:
2.9% (3)
State:
13.7% (527,363)
Number of families with income $100k - 125k:
Roby:
8.0% (10)
State:
11.6% (448,411)
Number of families with income > $200k:
Roby:
4.7% (6)
Texas:
17.6% (677,490)
Median non-family income in Roby in 2022:
Roby:
$51,089
State:
$50,587
Median per capita income in Roby in 2022:
Roby:
$31,995
State:
$47,740
Change in median per capita income between 2000 and 2022:
Roby, Texas:
+117.5%
State:
+114.3%
Income statistics for Black or African American residents
Aggregate household income in Roby in 2022: $1,747,178
Median per capita income in Roby in 2022:
Roby:
$25,458
State:
$30,490
Income statistics for Hispanic or Latino residents
Median household income in Roby, TX in 2022:
Roby:
$33,776
State:
$60,504
Change in median household income between 2000 and 2022:
Roby, Texas:
+77.8%
State:
+102.5%
Number of households with income < $10k:
Roby:
0.0% (0)
State:
5.8% (213,953)
Number of households with income $10k - 20k:
Roby:
12.5% (10)
State:
8.0% (297,456)
Number of households with income $20k - 30k:
Roby:
31.2% (25)
Texas:
9.2% (340,166)
Number of households with income $30k - 40k:
Roby:
12.5% (10)
State:
9.5% (354,336)
Number of households with income $40k - 50k:
Roby:
16.2% (13)
State:
8.8% (327,013)
Number of households with income $50k - 60k:
Roby:
0.0% (0)
State:
8.3% (308,818)
Number of households with income $60k - 75k:
Roby:
25.0% (20)
State:
10.9% (405,109)
Number of households with income $75k - 100k:
Roby:
2.5% (2)
State:
13.8% (511,639)
Number of households with income $100k - 125k:
Roby:
0.0% (0)
State:
8.6% (319,728)
Number of households with income $125k - 150k:
Roby:
0.0% (0)
State:
5.7% (210,932)
Number of households with income $150k - 200k:
Roby:
0.0% (0)
State:
6.4% (236,055)
Number of households with income > $200k:
Roby:
0.0% (0)
Texas:
5.1% (189,259)
Aggregate household income in Roby in 2022: $3,107,705
Median family income in Roby in 2022:
Roby:
$46,899
State:
$65,080
Number of families with income $10k - 20k:
Roby:
12.6% (6)
State:
6.3% (174,531)
Number of families with income $30k - 40k:
Roby:
20.2% (10)
State:
9.1% (251,999)
Number of families with income $40k - 50k:
Roby:
24.5% (12)
State:
8.6% (240,188)
Number of families with income $60k - 75k:
Roby:
38.3% (19)
State:
10.9% (302,688)
Number of families with income $75k - 100k:
Roby:
4.3% (2)
Texas:
14.3% (398,554)
Median per capita income in Roby in 2022:
Roby:
$19,420
Texas:
$24,862
Change in median per capita income between 2000 and 2022:
Roby, Texas:
+135.0%
Texas:
+130.8%
Income statistics for Multirace residents
Median per capita income in Roby in 2022:
Roby:
$28,129
State:
$26,785
Change in median per capita income between 2000 and 2022:
Roby, Texas:
+148.4%
Texas:
+110.9%
Income statistics for other residents
Number of households with income < $10k:
Roby:
0.0% (0)
State:
5.9% (54,162)
Number of households with income $10k - 20k:
Roby:
17.2% (5)
State:
6.8% (62,891)
Number of households with income $20k - 30k:
Roby:
0.0% (0)
State:
10.6% (97,294)
Number of households with income $30k - 40k:
Roby:
0.0% (0)
State:
10.8% (99,670)
Number of households with income $40k - 50k:
Roby:
0.0% (0)
State:
9.3% (85,548)
Number of households with income $50k - 60k:
Roby:
0.0% (0)
Texas:
9.0% (82,757)
Number of households with income $60k - 75k:
Roby:
82.8% (24)
Texas:
10.9% (100,326)
Number of households with income $75k - 100k:
Roby:
0.0% (0)
State:
14.0% (128,767)
Number of households with income $100k - 125k:
Roby:
0.0% (0)
State:
8.2% (75,218)
Number of households with income $125k - 150k:
Roby:
0.0% (0)
State:
4.8% (44,223)
Number of households with income $150k - 200k:
Roby:
0.0% (0)
State:
5.6% (51,376)
Number of households with income > $200k:
Roby:
0.0% (0)
State:
4.0% (36,393)
Aggregate household income in Roby in 2022: $912,872
Median per capita income in Roby in 2022:
Roby:
$27,858
Texas:
$23,899
Discuss Roby, Texas (TX) on our hugely popular Texas forum.