The median household income in Rochelle, IL in 2022 was $54,742, which was 40.1% less than the median annual income of $76,708 across the entire state of Illinois. Compared to the median income of $37,984 in 2000 this represents an increase of 30.6%. The per capita income in 2022 was $31,034, which means an increase of 41.6% compared to 2000 when it was $18,139.
Whole page based on the data from 2000 / 2022 when the population of Rochelle, Illinois was 9,424 / 9,287
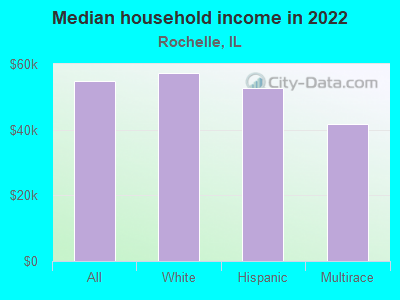
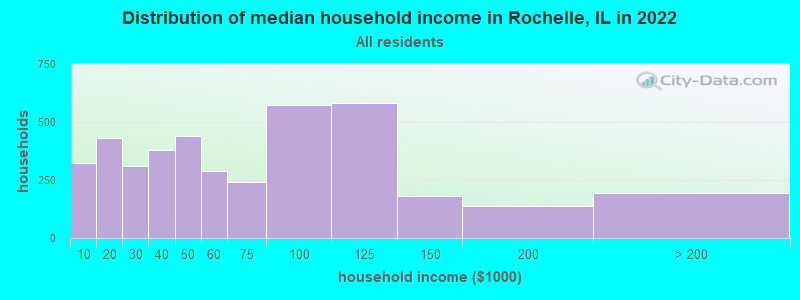
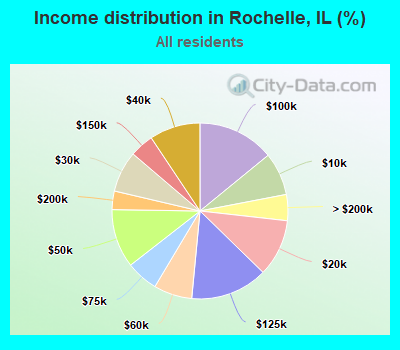
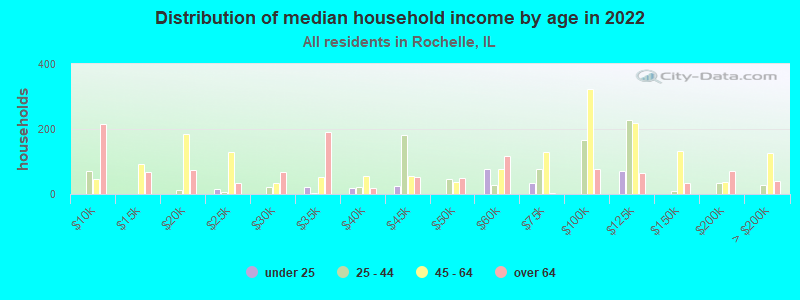
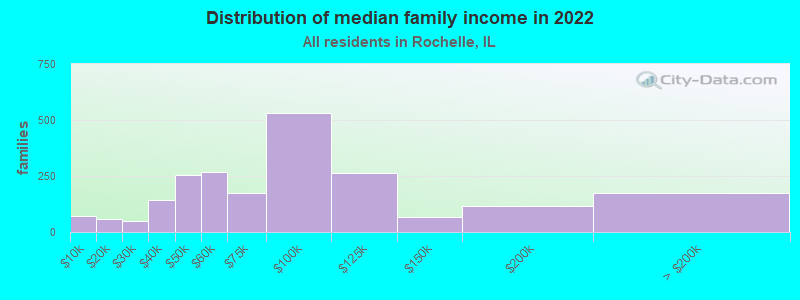
Income statistics for all residents
Median household income in Rochelle, IL in 2022:
Rochelle:
$54,743
State:
$76,708
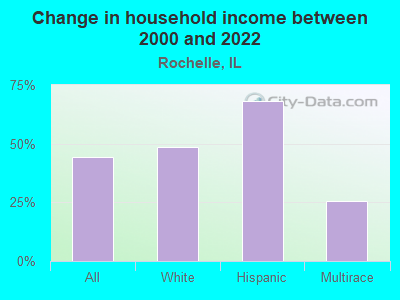
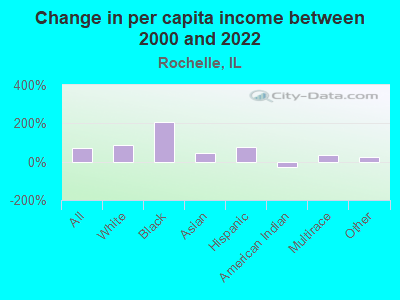
Change in median household income between 2000 and 2022:
Rochelle, Illinois:
+44.1%
Illinois:
+64.6%
Number of households with income < $10k:
Rochelle:
7.9% (322)
State:
5.9% (296,090)
Number of households with income $10k - 20k:
Rochelle:
10.5% (429)
Illinois:
6.6% (333,259)
Number of households with income $20k - 30k:
Rochelle:
7.6% (309)
State:
6.8% (342,921)
Number of households with income $30k - 40k:
Rochelle:
9.3% (381)
State:
7.0% (355,254)
Number of households with income $40k - 50k:
Rochelle:
10.8% (440)
State:
6.7% (340,678)
Number of households with income $50k - 60k:
Rochelle:
7.0% (287)
State:
6.7% (339,405)
Number of households with income $60k - 75k:
Rochelle:
5.9% (241)
Illinois:
9.2% (465,709)
Number of households with income $75k - 100k:
Rochelle:
14.1% (575)
State:
12.9% (651,353)
Number of households with income $100k - 125k:
Rochelle:
14.2% (580)
State:
10.3% (522,359)
Number of households with income $125k - 150k:
Rochelle:
4.4% (180)
State:
7.3% (367,136)
Number of households with income $150k - 200k:
Rochelle:
3.4% (139)
Illinois:
9.0% (455,249)
Number of households with income > $200k:
Rochelle:
4.8% (195)
State:
11.6% (586,947)
Aggregate household income in Rochelle in 2022: $281,615,888
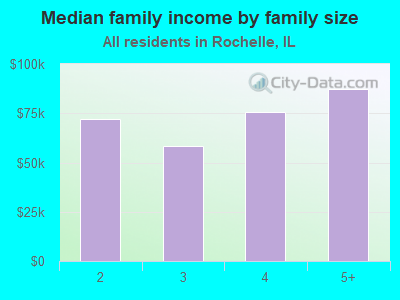
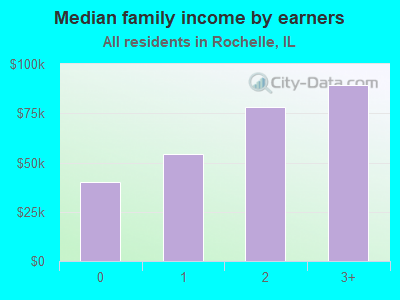
Median family income in Rochelle in 2022:
Rochelle:
$75,166
Illinois:
$96,948
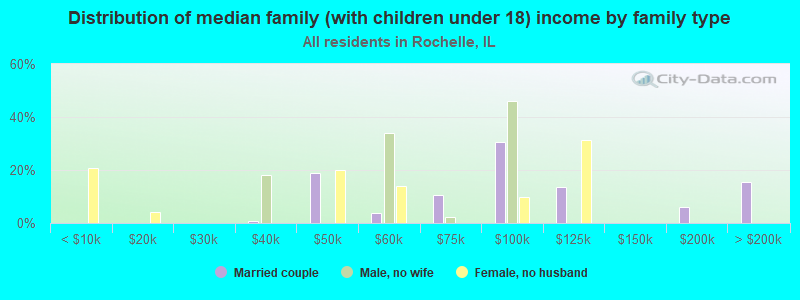
Number of families with income < $10k:
Rochelle:
3.3% (71)
State:
3.4% (105,875)
Number of families with income $10k - 20k:
Rochelle:
2.6% (57)
State:
3.3% (105,017)
Number of families with income $20k - 30k:
Rochelle:
2.2% (48)
Illinois:
4.7% (146,403)
Number of families with income $30k - 40k:
Rochelle:
6.6% (142)
State:
5.3% (167,069)
Number of families with income $40k - 50k:
Rochelle:
11.7% (253)
State:
5.8% (181,164)
Number of families with income $50k - 60k:
Rochelle:
12.4% (268)
State:
6.1% (191,561)
Number of families with income $60k - 75k:
Rochelle:
8.1% (175)
State:
9.0% (282,985)
Number of families with income $75k - 100k:
Rochelle:
24.6% (530)
State:
13.8% (432,725)
Number of families with income $100k - 125k:
Rochelle:
12.1% (262)
State:
11.9% (373,296)
Number of families with income $125k - 150k:
Rochelle:
3.0% (66)
Illinois:
8.9% (279,791)
Number of families with income $150k - 200k:
Rochelle:
5.4% (116)
Illinois:
11.9% (372,004)
Number of families with income > $200k:
Rochelle:
8.0% (172)
State:
15.9% (500,033)
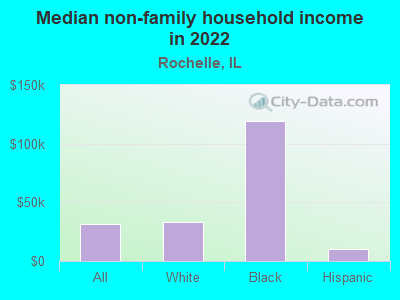
Median non-family income in Rochelle in 2022:
Rochelle:
$31,410
State:
$46,533
Change in median non-family income between 2000 and 2022:
Rochelle, Illinois:
+21.1%
Illinois:
+64.0%
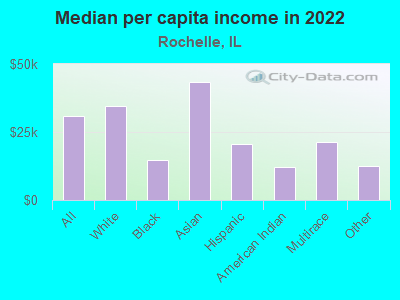
Median per capita income in Rochelle in 2022:
Rochelle:
$31,034
State:
$43,317
Change in median per capita income between 2000 and 2022:
Rochelle, Illinois:
+71.1%
State:
+87.5%
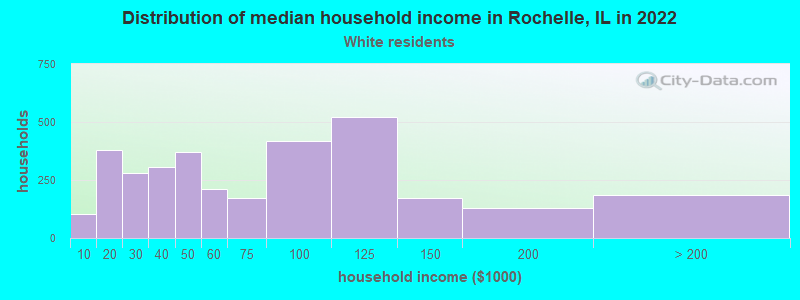
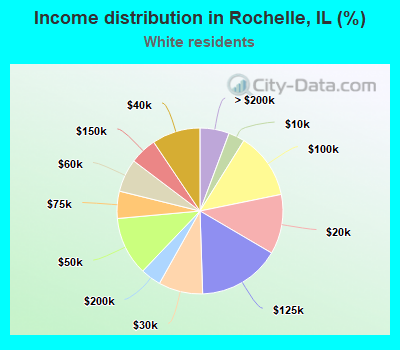
Income statistics for White residents
Median household income in Rochelle, IL in 2022:
Rochelle:
$57,112
State:
$83,346
Change in median household income between 2000 and 2022:
Rochelle, Illinois:
+48.6%
Illinois:
+67.5%
Number of households with income < $10k:
Rochelle:
3.2% (103)
State:
4.5% (149,895)
Number of households with income $10k - 20k:
Rochelle:
11.7% (379)
State:
5.5% (184,529)
Number of households with income $20k - 30k:
Rochelle:
8.6% (281)
State:
6.1% (205,767)
Number of households with income $30k - 40k:
Rochelle:
9.4% (306)
State:
6.7% (225,572)
Number of households with income $40k - 50k:
Rochelle:
11.4% (372)
State:
6.5% (216,965)
Number of households with income $50k - 60k:
Rochelle:
6.5% (210)
Illinois:
6.6% (222,841)
Number of households with income $60k - 75k:
Rochelle:
5.3% (172)
State:
9.3% (312,758)
Number of households with income $75k - 100k:
Rochelle:
12.9% (420)
Illinois:
12.9% (433,180)
Number of households with income $100k - 125k:
Rochelle:
16.0% (522)
Illinois:
10.7% (360,753)
Number of households with income $125k - 150k:
Rochelle:
5.3% (172)
State:
7.9% (266,532)
Number of households with income $150k - 200k:
Rochelle:
4.0% (130)
Illinois:
10.0% (337,357)
Number of households with income > $200k:
Rochelle:
5.7% (186)
State:
13.3% (446,069)
Aggregate household income in Rochelle in 2022: $242,997,990
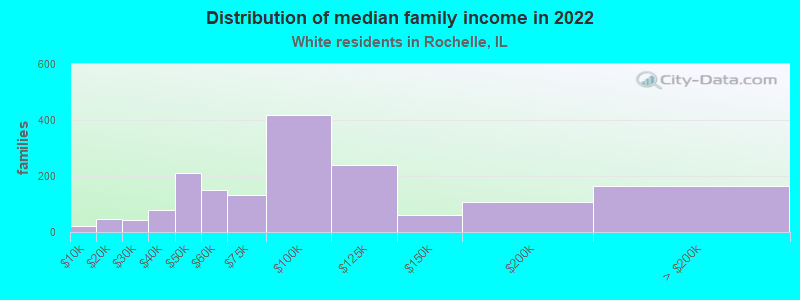
Median family income in Rochelle in 2022:
Rochelle:
$79,967
State:
$107,938
Number of families with income < $10k:
Rochelle:
1.3% (21)
State:
2.2% (45,983)
Number of families with income $10k - 20k:
Rochelle:
2.8% (46)
Illinois:
2.5% (50,574)
Number of families with income $20k - 30k:
Rochelle:
2.5% (42)
Illinois:
3.5% (70,927)
Number of families with income $30k - 40k:
Rochelle:
4.7% (79)
State:
4.4% (90,563)
Number of families with income $40k - 50k:
Rochelle:
12.6% (210)
Illinois:
5.0% (102,597)
Number of families with income $50k - 60k:
Rochelle:
9.0% (150)
Illinois:
5.8% (119,129)
Number of families with income $60k - 75k:
Rochelle:
7.9% (131)
State:
8.8% (179,665)
Number of families with income $75k - 100k:
Rochelle:
25.0% (418)
State:
13.5% (276,887)
Number of families with income $100k - 125k:
Rochelle:
14.4% (241)
State:
12.5% (256,099)
Number of families with income $125k - 150k:
Rochelle:
3.7% (61)
State:
9.8% (199,855)
Number of families with income $150k - 200k:
Rochelle:
6.4% (107)
Illinois:
13.4% (274,569)
Number of families with income > $200k:
Rochelle:
9.8% (164)
State:
18.6% (381,354)
Median non-family income in Rochelle in 2022:
Rochelle:
$33,479
State:
$50,934
Change in median non-family income between 2000 and 2022:
Rochelle, Illinois:
+26.4%
State:
+70.7%
Median per capita income in Rochelle in 2022:
Rochelle:
$34,699
State:
$50,738
Change in median per capita income between 2000 and 2022:
Rochelle, Illinois:
+85.1%
State:
+95.5%
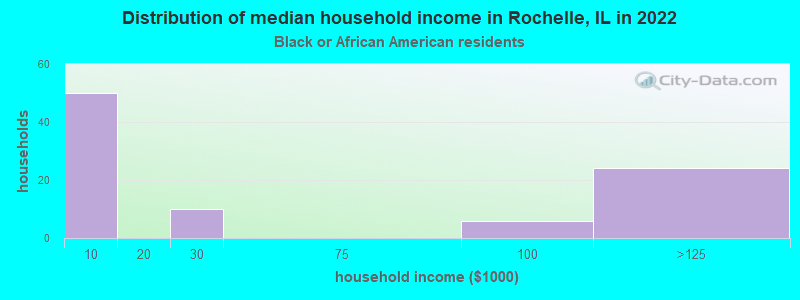
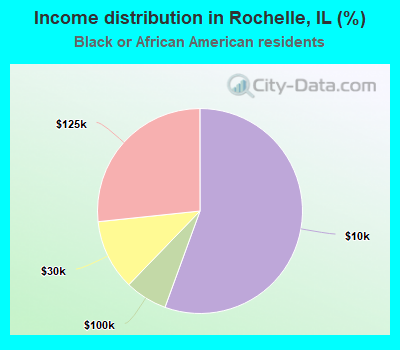
Income statistics for Black or African American residents
Number of households with income < $10k:
Rochelle:
55.6% (50)
State:
13.3% (92,224)
Number of households with income $10k - 20k:
Rochelle:
0.0% (0)
Illinois:
13.5% (93,732)
Number of households with income $20k - 30k:
Rochelle:
11.1% (10)
State:
9.9% (68,453)
Number of households with income $30k - 40k:
Rochelle:
0.0% (0)
State:
8.5% (59,072)
Number of households with income $40k - 50k:
Rochelle:
0.0% (0)
State:
7.9% (55,033)
Number of households with income $50k - 60k:
Rochelle:
0.0% (0)
Illinois:
7.2% (49,556)
Number of households with income $60k - 75k:
Rochelle:
0.0% (0)
Illinois:
7.8% (53,726)
Number of households with income $75k - 100k:
Rochelle:
6.7% (6)
State:
11.6% (80,439)
Number of households with income $100k - 125k:
Rochelle:
26.7% (24)
State:
7.5% (52,244)
Number of households with income $125k - 150k:
Rochelle:
0.0% (0)
State:
3.9% (27,058)
Number of households with income $150k - 200k:
Rochelle:
0.0% (0)
Illinois:
4.6% (32,057)
Number of households with income > $200k:
Rochelle:
0.0% (0)
State:
4.1% (28,731)
Aggregate household income in Rochelle in 2022: $3,675,414
Median non-family income in Rochelle in 2022:
Rochelle:
$119,681
State:
$29,966
Median per capita income in Rochelle in 2022:
Rochelle:
$14,589
State:
$28,045
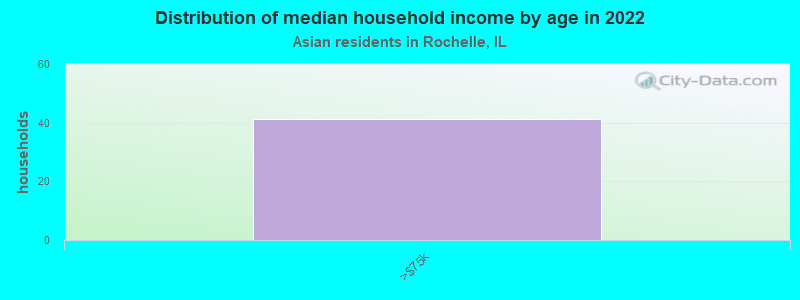
Income statistics for Asian residents
Number of households with income < $10k:
Rochelle:
0.0% (0)
State:
5.3% (14,653)
Number of households with income $10k - 20k:
Rochelle:
0.0% (0)
State:
4.5% (12,283)
Number of households with income $20k - 30k:
Rochelle:
0.0% (0)
State:
4.8% (13,135)
Number of households with income $30k - 40k:
Rochelle:
0.0% (0)
State:
5.0% (13,655)
Number of households with income $40k - 50k:
Rochelle:
0.0% (0)
State:
4.5% (12,357)
Number of households with income $50k - 60k:
Rochelle:
0.0% (0)
State:
4.9% (13,568)
Number of households with income $60k - 75k:
Rochelle:
100.0% (29)
State:
7.1% (19,606)
Number of households with income $75k - 100k:
Rochelle:
0.0% (0)
State:
12.1% (33,349)
Number of households with income $100k - 125k:
Rochelle:
0.0% (0)
State:
9.7% (26,669)
Number of households with income $125k - 150k:
Rochelle:
0.0% (0)
State:
7.3% (20,172)
Number of households with income $150k - 200k:
Rochelle:
0.0% (0)
Illinois:
11.5% (31,711)
Number of households with income > $200k:
Rochelle:
0.0% (0)
State:
23.1% (63,411)
Aggregate household income in Rochelle in 2022: $2,167,964
Median per capita income in Rochelle in 2022:
Rochelle:
$43,282
Illinois:
$52,977
Change in median per capita income between 2000 and 2022:
Rochelle, Illinois:
+45.9%
State:
+119.5%
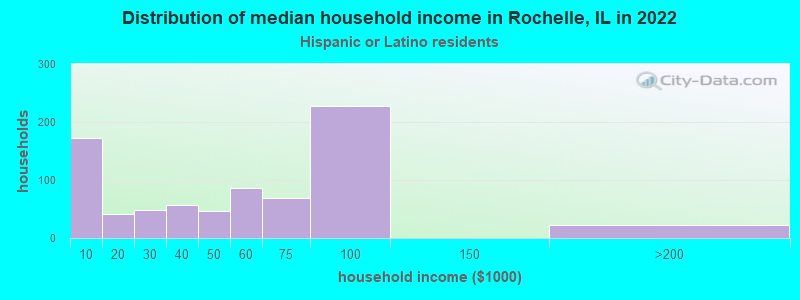
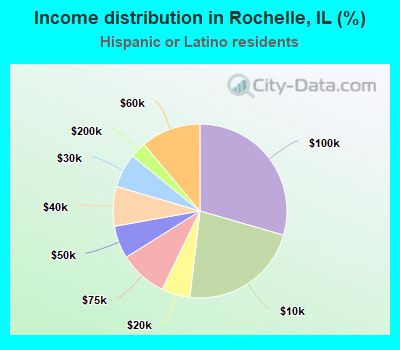
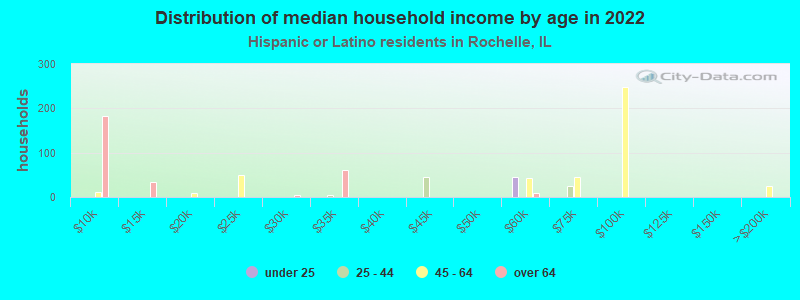
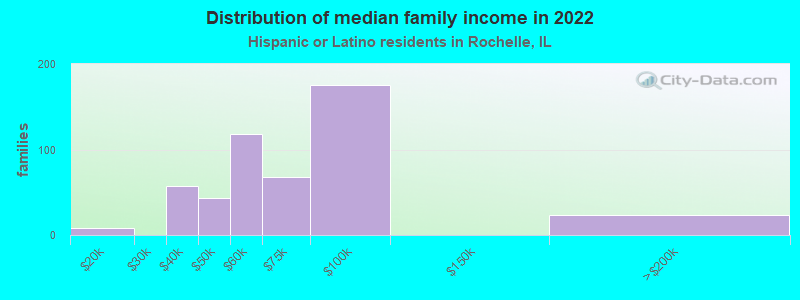
Income statistics for Hispanic or Latino residents
Median household income in Rochelle, IL in 2022:
Rochelle:
$52,673
State:
$72,139
Change in median household income between 2000 and 2022:
Rochelle, Illinois:
+68.1%
State:
+75.7%
Number of households with income < $10k:
Rochelle:
22.4% (173)
Illinois:
4.9% (33,145)
Number of households with income $10k - 20k:
Rochelle:
5.3% (41)
State:
5.4% (36,345)
Number of households with income $20k - 30k:
Rochelle:
6.3% (49)
State:
7.5% (50,677)
Number of households with income $30k - 40k:
Rochelle:
7.4% (57)
Illinois:
7.7% (52,008)
Number of households with income $40k - 50k:
Rochelle:
6.1% (47)
State:
8.1% (54,702)
Number of households with income $50k - 60k:
Rochelle:
11.1% (86)
Illinois:
7.5% (51,062)
Number of households with income $60k - 75k:
Rochelle:
8.9% (69)
State:
11.3% (76,576)
Number of households with income $75k - 100k:
Rochelle:
29.5% (228)
State:
15.5% (105,152)
Number of households with income $100k - 125k:
Rochelle:
0.0% (0)
Illinois:
11.5% (77,760)
Number of households with income $125k - 150k:
Rochelle:
0.0% (0)
Illinois:
7.3% (49,310)
Number of households with income $150k - 200k:
Rochelle:
3.0% (23)
Illinois:
7.6% (51,233)
Number of households with income > $200k:
Rochelle:
0.0% (0)
Illinois:
5.9% (40,028)
Aggregate household income in Rochelle in 2022: $38,597,520
Median family income in Rochelle in 2022:
Rochelle:
$62,049
State:
$76,467
Number of families with income $10k - 20k:
Rochelle:
1.6% (8)
State:
3.8% (19,314)
Number of families with income $30k - 40k:
Rochelle:
11.5% (57)
Illinois:
7.5% (37,976)
Number of families with income $40k - 50k:
Rochelle:
8.7% (43)
State:
7.7% (38,858)
Number of families with income $50k - 60k:
Rochelle:
24.0% (118)
State:
7.6% (38,606)
Number of families with income $60k - 75k:
Rochelle:
13.8% (68)
State:
11.5% (58,164)
Number of families with income $75k - 100k:
Rochelle:
35.7% (176)
State:
16.0% (81,055)
Number of families with income $150k - 200k:
Rochelle:
4.7% (23)
Illinois:
8.6% (43,536)
Median non-family income in Rochelle in 2022:
Rochelle:
$10,031
State:
$45,965
Change in median non-family income between 2000 and 2022:: -59.6%
Rochelle, Illinois:
-59.6%
State:
+75.9%
Median per capita income in Rochelle in 2022:
Rochelle:
$20,423
State:
$26,551
Change in median per capita income between 2000 and 2022:
Rochelle, Illinois:
+74.7%
Illinois:
+111.0%
Income statistics for American Indian and Alaska Native residents
Number of households with income < $10k:
Rochelle:
0.0% (0)
State:
3.2% (935)
Number of households with income $10k - 20k:
Rochelle:
0.0% (0)
Illinois:
7.1% (2,053)
Number of households with income $20k - 30k:
Rochelle:
0.0% (0)
State:
10.1% (2,939)
Number of households with income $30k - 40k:
Rochelle:
0.0% (0)
State:
7.7% (2,246)
Number of households with income $40k - 50k:
Rochelle:
0.0% (0)
State:
7.9% (2,300)
Number of households with income $50k - 60k:
Rochelle:
100.0% (46)
Illinois:
8.5% (2,460)
Number of households with income $60k - 75k:
Rochelle:
0.0% (0)
State:
10.7% (3,095)
Number of households with income $75k - 100k:
Rochelle:
0.0% (0)
State:
15.3% (4,451)
Number of households with income $100k - 125k:
Rochelle:
0.0% (0)
State:
11.7% (3,386)
Number of households with income $125k - 150k:
Rochelle:
0.0% (0)
Illinois:
7.8% (2,269)
Number of households with income $150k - 200k:
Rochelle:
0.0% (0)
Illinois:
5.8% (1,673)
Number of households with income > $200k:
Rochelle:
0.0% (0)
State:
4.1% (1,198)
Aggregate household income in Rochelle in 2022: $4,679,040
Median per capita income in Rochelle in 2022:
Rochelle:
$12,231
Illinois:
$26,979
Change in median per capita income between 2000 and 2022:: -27.5%
Rochelle, Illinois:
-27.5%
Illinois:
+64.2%
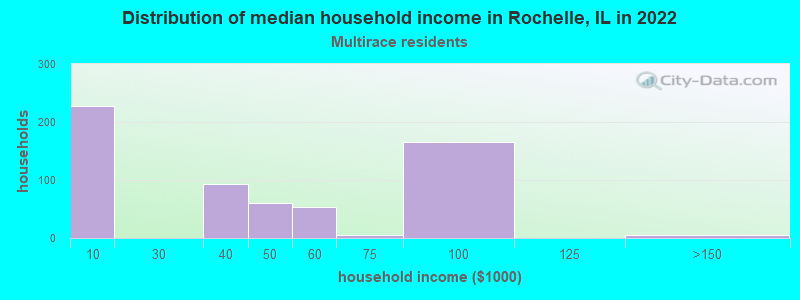
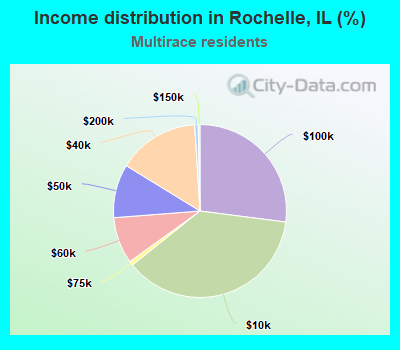
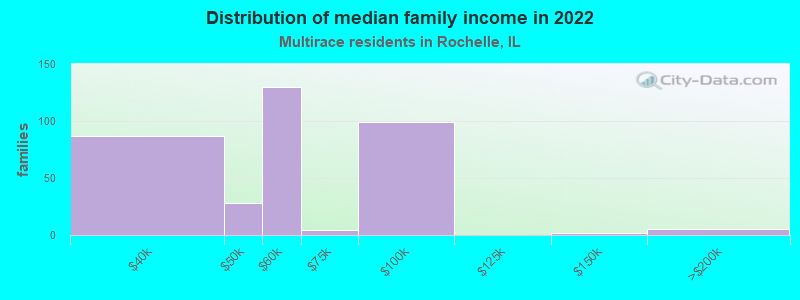
Income statistics for Multirace residents
Median household income in Rochelle, IL in 2022:
Rochelle:
$41,637
State:
$71,185
Change in median household income between 2000 and 2022:
Rochelle, Illinois:
+25.7%
State:
+81.4%
Number of households with income < $10k:
Rochelle:
37.2% (227)
State:
5.3% (21,595)
Number of households with income $10k - 20k:
Rochelle:
0.0% (0)
State:
6.5% (26,720)
Number of households with income $20k - 30k:
Rochelle:
0.0% (0)
Illinois:
8.0% (32,573)
Number of households with income $30k - 40k:
Rochelle:
15.2% (93)
State:
8.4% (34,383)
Number of households with income $40k - 50k:
Rochelle:
10.0% (61)
Illinois:
7.4% (30,234)
Number of households with income $50k - 60k:
Rochelle:
8.7% (53)
Illinois:
6.9% (28,432)
Number of households with income $60k - 75k:
Rochelle:
0.8% (5)
Illinois:
10.2% (41,780)
Number of households with income $75k - 100k:
Rochelle:
27.0% (165)
State:
13.0% (53,426)
Number of households with income $100k - 125k:
Rochelle:
0.0% (0)
State:
10.5% (43,126)
Number of households with income $125k - 150k:
Rochelle:
0.3% (2)
State:
7.6% (31,153)
Number of households with income $150k - 200k:
Rochelle:
0.7% (4)
Illinois:
7.6% (30,946)
Number of households with income > $200k:
Rochelle:
0.0% (0)
Illinois:
8.6% (35,208)
Aggregate household income in Rochelle in 2022: $26,145,674
Median family income in Rochelle in 2022:
Rochelle:
$58,212
State:
$84,400
Number of families with income $30k - 40k:
Rochelle:
24.4% (87)
State:
7.5% (20,780)
Number of families with income $40k - 50k:
Rochelle:
8.0% (28)
State:
7.1% (19,595)
Number of families with income $50k - 60k:
Rochelle:
36.6% (130)
State:
6.9% (19,177)
Number of families with income $60k - 75k:
Rochelle:
1.3% (4)
State:
9.3% (25,936)
Number of families with income $75k - 100k:
Rochelle:
28.0% (99)
State:
13.6% (37,857)
Number of families with income $125k - 150k:
Rochelle:
0.5% (2)
Illinois:
9.0% (25,085)
Number of families with income $150k - 200k:
Rochelle:
1.3% (5)
State:
9.5% (26,306)
Median per capita income in Rochelle in 2022:
Rochelle:
$21,223
Illinois:
$29,285
Change in median per capita income between 2000 and 2022:
Rochelle, Illinois:
+36.5%
Illinois:
+112.9%
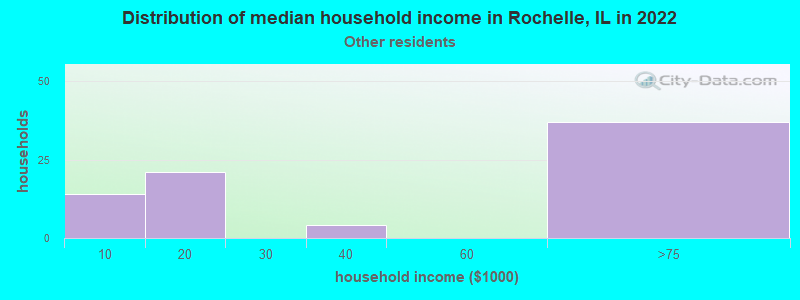
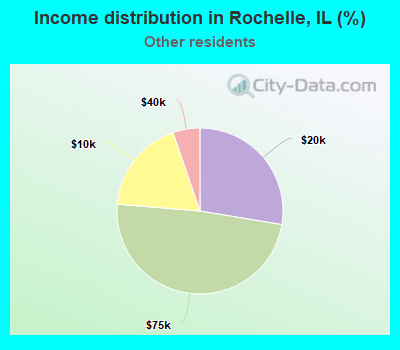
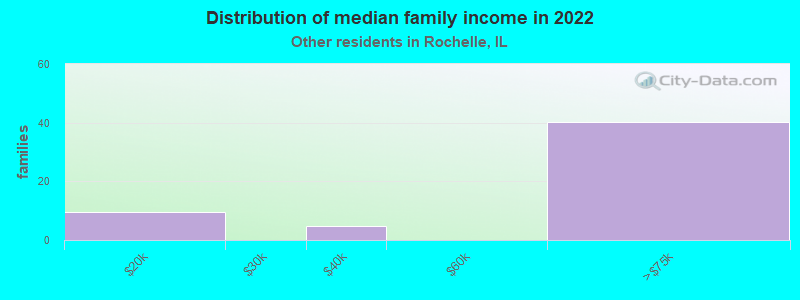
Income statistics for other residents
Number of households with income < $10k:
Rochelle:
18.4% (14)
State:
5.7% (16,383)
Number of households with income $10k - 20k:
Rochelle:
27.6% (21)
State:
4.8% (13,886)
Number of households with income $20k - 30k:
Rochelle:
0.0% (0)
Illinois:
7.0% (20,054)
Number of households with income $30k - 40k:
Rochelle:
5.3% (4)
Illinois:
7.0% (20,038)
Number of households with income $40k - 50k:
Rochelle:
0.0% (0)
Illinois:
8.3% (23,759)
Number of households with income $50k - 60k:
Rochelle:
0.0% (0)
Illinois:
7.8% (22,410)
Number of households with income $60k - 75k:
Rochelle:
48.7% (37)
Illinois:
12.0% (34,448)
Number of households with income $75k - 100k:
Rochelle:
0.0% (0)
State:
16.2% (46,508)
Number of households with income $100k - 125k:
Rochelle:
0.0% (0)
State:
12.5% (35,952)
Number of households with income $125k - 150k:
Rochelle:
0.0% (0)
State:
6.9% (19,732)
Number of households with income $150k - 200k:
Rochelle:
0.0% (0)
Illinois:
7.5% (21,422)
Number of households with income > $200k:
Rochelle:
0.0% (0)
State:
4.3% (12,194)
Aggregate household income in Rochelle in 2022: $2,711,093
Median family income in Rochelle in 2022:
Rochelle:
$63,024
Illinois:
$74,069
Number of families with income $10k - 20k:
Rochelle:
17.6% (10)
State:
3.3% (7,467)
Number of families with income $30k - 40k:
Rochelle:
8.6% (5)
State:
7.6% (17,087)
Number of families with income $60k - 75k:
Rochelle:
73.7% (40)
Illinois:
13.4% (30,011)
Median per capita income in Rochelle in 2022:
Rochelle:
$12,563
State:
$25,392
Change in median per capita income between 2000 and 2022:
Rochelle, Illinois:
+22.4%
State:
+117.4%
Discuss Rochelle, Illinois (IL) on our hugely popular Illinois forum.