Rochelle, Texas (TX) income map, earnings map, and wages data
The median household income in Rochelle, TX in 2022 was $56,972, which was 26.9% less than the median annual income of $72,284 across the entire state of Texas. Compared to the median income of $30,903 in 2000 this represents an increase of 45.8%. The per capita income in 2022 was $30,432, which means an increase of 48.5% compared to 2000 when it was $15,670.
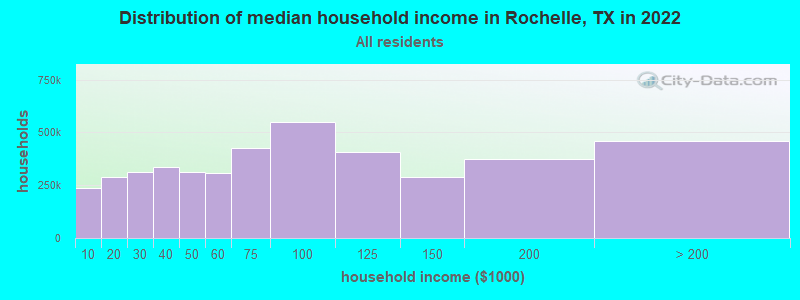
Income statistics for all residents
Median household income in Rochelle, TX in 2022:| Rochelle: | $56,972 |
| State: | $72,284 |
Change in median household income between 2000 and 2022:| Rochelle, Texas: | +84.4% |
| State: | +81.0% |
Number of households with income < $10k:| Rochelle: | 5.5% (236,328) |
| State: | 5.5% (611,011) |
Number of households with income $10k - 20k:| Rochelle: | 6.7% (287,589) |
| State: | 6.7% (743,157) |
Number of households with income $20k - 30k:| Rochelle: | 7.2% (310,904) |
| State: | 7.2% (803,381) |
Number of households with income $30k - 40k:| Rochelle: | 7.8% (335,130) |
| State: | 7.8% (866,080) |
Number of households with income $40k - 50k:| Rochelle: | 7.3% (313,613) |
| State: | 7.3% (810,440) |
Number of households with income $50k - 60k:| Rochelle: | 7.2% (309,447) |
| Texas: | 7.2% (799,783) |
Number of households with income $60k - 75k:| Rochelle: | 9.9% (423,841) |
| State: | 9.9% (1,095,384) |
Number of households with income $75k - 100k:| Rochelle: | 12.8% (549,231) |
| State: | 12.8% (1,419,057) |
Number of households with income $100k - 125k:| Rochelle: | 9.5% (408,204) |
| State: | 9.5% (1,054,577) |
Number of households with income $125k - 150k:| Rochelle: | 6.7% (287,097) |
| Texas: | 6.7% (741,518) |
Number of households with income $150k - 200k:| Rochelle: | 8.7% (372,168) |
| Texas: | 8.7% (961,776) |
Number of households with income > $200k:| Rochelle: | 10.7% (457,021) |
| State: | 10.7% (1,181,544) |
Aggregate household income in Rochelle in 2022: $2,590,227,578
Median family income in Rochelle in 2022:| Rochelle: | $61,687 |
| State: | $86,267 |
Median non-family income in Rochelle in 2022:| Rochelle: | $36,261 |
| Texas: | $45,999 |
Change in median non-family income between 2000 and 2022:| Rochelle, Texas: | +85.2% |
| State: | +79.5% |
Median per capita income in Rochelle in 2022:| Rochelle: | $30,433 |
| State: | $38,123 |
Change in median per capita income between 2000 and 2022:| Rochelle, Texas: | +94.2% |
| State: | +94.3% |
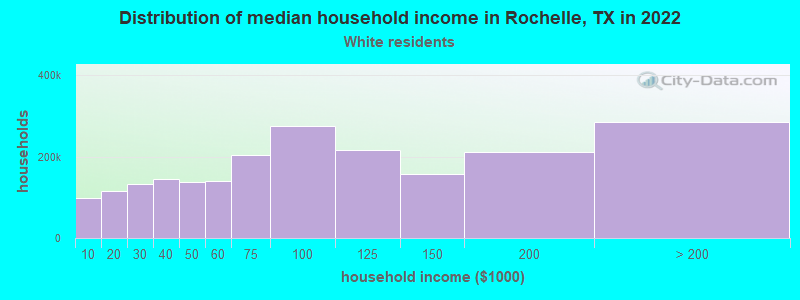
Income statistics for White residents
Median household income in Rochelle, TX in 2022:| Rochelle: | $59,231 |
| Texas: | $82,032 |
Change in median household income between 2000 and 2022:| Rochelle, Texas: | +90.4% |
| State: | +91.0% |
Number of households with income < $10k:| Rochelle: | 4.7% (98,847) |
| State: | 4.7% (273,716) |
Number of households with income $10k - 20k:| Rochelle: | 5.5% (116,751) |
| Texas: | 5.5% (322,702) |
Number of households with income $20k - 30k:| Rochelle: | 6.2% (131,745) |
| State: | 6.2% (363,947) |
Number of households with income $30k - 40k:| Rochelle: | 6.8% (144,409) |
| Texas: | 6.8% (399,275) |
Number of households with income $40k - 50k:| Rochelle: | 6.5% (138,624) |
| State: | 6.5% (383,417) |
Number of households with income $50k - 60k:| Rochelle: | 6.6% (140,448) |
| Texas: | 6.6% (388,535) |
Number of households with income $60k - 75k:| Rochelle: | 9.6% (204,436) |
| Texas: | 9.7% (566,295) |
Number of households with income $75k - 100k:| Rochelle: | 13.0% (274,727) |
| State: | 13.0% (760,276) |
Number of households with income $100k - 125k:| Rochelle: | 10.2% (215,946) |
| Texas: | 10.2% (597,596) |
Number of households with income $125k - 150k:| Rochelle: | 7.4% (157,808) |
| State: | 7.4% (436,830) |
Number of households with income $150k - 200k:| Rochelle: | 9.9% (210,470) |
| State: | 9.9% (583,067) |
Number of households with income > $200k:| Rochelle: | 13.5% (285,376) |
| State: | 13.5% (792,647) |
Aggregate household income in Rochelle in 2022: $1,533,717,290
Median family income in Rochelle in 2022:| Rochelle: | $66,859 |
| State: | $101,788 |
Number of families with income < $10k:| Rochelle: | 6.8% (7) |
| State: | 2.8% (108,142) |
Number of families with income $10k - 20k:| Rochelle: | 6.5% (7) |
| Texas: | 2.9% (113,421) |
Number of families with income $20k - 30k:| Rochelle: | 11.0% (12) |
| Texas: | 4.1% (157,688) |
Number of families with income $30k - 40k:| Rochelle: | 12.6% (13) |
| State: | 5.2% (198,847) |
Number of families with income $40k - 50k:| Rochelle: | 11.0% (12) |
| State: | 5.6% (216,490) |
Number of families with income $50k - 60k:| Rochelle: | 5.7% (6) |
| Texas: | 5.7% (220,689) |
Number of families with income $60k - 75k:| Rochelle: | 19.2% (20) |
| State: | 9.0% (346,106) |
Number of families with income $75k - 100k:| Rochelle: | 22.4% (24) |
| Texas: | 13.7% (527,363) |
Number of families with income $150k - 200k:| Rochelle: | 4.7% (5) |
| Texas: | 12.5% (480,185) |
Median non-family income in Rochelle in 2022:| Rochelle: | $36,391 |
| Texas: | $50,587 |
Change in median non-family income between 2000 and 2022:| Rochelle, Texas: | +85.8% |
| Texas: | +87.7% |
Median per capita income in Rochelle in 2022:| Rochelle: | $34,057 |
| State: | $47,740 |
Change in median per capita income between 2000 and 2022:| Rochelle, Texas: | +112.1% |
| State: | +114.3% |
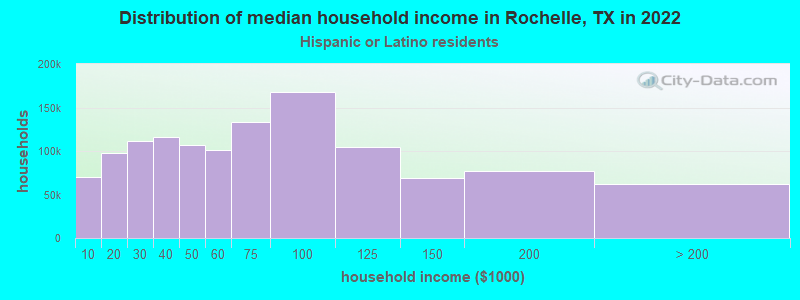
Income statistics for Hispanic or Latino residents
Median household income in Rochelle, TX in 2022:| Rochelle: | $41,692 |
| State: | $60,504 |
Change in median household income between 2000 and 2022:| Rochelle, Texas: | +112.9% |
| State: | +102.5% |
Number of households with income < $10k:| Rochelle: | 5.8% (70,205) |
| State: | 5.8% (213,953) |
Number of households with income $10k - 20k:| Rochelle: | 8.0% (97,639) |
| Texas: | 8.0% (297,456) |
Number of households with income $20k - 30k:| Rochelle: | 9.2% (111,559) |
| State: | 9.2% (340,166) |
Number of households with income $30k - 40k:| Rochelle: | 9.5% (116,311) |
| Texas: | 9.5% (354,336) |
Number of households with income $40k - 50k:| Rochelle: | 8.8% (107,270) |
| State: | 8.8% (327,013) |
Number of households with income $50k - 60k:| Rochelle: | 8.3% (101,242) |
| State: | 8.3% (308,818) |
Number of households with income $60k - 75k:| Rochelle: | 10.9% (132,927) |
| State: | 10.9% (405,109) |
Number of households with income $75k - 100k:| Rochelle: | 13.8% (167,956) |
| Texas: | 13.8% (511,639) |
Number of households with income $100k - 125k:| Rochelle: | 8.6% (104,965) |
| Texas: | 8.6% (319,728) |
Number of households with income $125k - 150k:| Rochelle: | 5.7% (69,307) |
| Texas: | 5.7% (210,932) |
Number of households with income $150k - 200k:| Rochelle: | 6.4% (77,404) |
| State: | 6.4% (236,055) |
Number of households with income > $200k:| Rochelle: | 5.1% (62,144) |
| Texas: | 5.1% (189,259) |
Aggregate household income in Rochelle in 2022: $18,102,994
Median family income in Rochelle in 2022:| Rochelle: | $42,948 |
| State: | $65,080 |
Number of families with income < $10k:| Rochelle: | 11.8% (14) |
| State: | 5.3% (147,493) |
Number of families with income $10k - 20k:| Rochelle: | 13.2% (16) |
| State: | 6.3% (174,531) |
Number of families with income $20k - 30k:| Rochelle: | 15.9% (19) |
| Texas: | 8.6% (238,528) |
Number of families with income $30k - 40k:| Rochelle: | 16.0% (19) |
| State: | 9.1% (251,999) |
Number of families with income $40k - 50k:| Rochelle: | 10.8% (13) |
| State: | 8.6% (240,188) |
Number of families with income $50k - 60k:| Rochelle: | 4.8% (6) |
| State: | 8.0% (223,566) |
Number of families with income $60k - 75k:| Rochelle: | 13.5% (16) |
| State: | 10.9% (302,688) |
Number of families with income $75k - 100k:| Rochelle: | 12.8% (15) |
| State: | 14.3% (398,554) |
Number of families with income $150k - 200k:| Rochelle: | 1.3% (2) |
| State: | 7.3% (202,259) |
Median per capita income in Rochelle in 2022:| Rochelle: | $11,760 |
| State: | $24,862 |
Change in median per capita income between 2000 and 2022:| Rochelle, Texas: | +128.5% |
| Texas: | +130.8% |
Income statistics for other residents
Number of households with income < $10k:| Rochelle: | 7.3% (3) |
| State: | 5.9% (54,162) |
Number of households with income $10k - 20k:| Rochelle: | 4.9% (2) |
| State: | 6.8% (62,891) |
Number of households with income $20k - 30k:| Rochelle: | 9.8% (4) |
| Texas: | 10.6% (97,294) |
Number of households with income $30k - 40k:| Rochelle: | 9.8% (4) |
| State: | 10.8% (99,670) |
Number of households with income $40k - 50k:| Rochelle: | 9.8% (4) |
| Texas: | 9.3% (85,548) |
Number of households with income $50k - 60k:| Rochelle: | 9.8% (4) |
| Texas: | 9.0% (82,757) |
Number of households with income $60k - 75k:| Rochelle: | 12.2% (5) |
| State: | 10.9% (100,326) |
Number of households with income $75k - 100k:| Rochelle: | 14.6% (6) |
| State: | 14.0% (128,767) |
Number of households with income $100k - 125k:| Rochelle: | 7.3% (3) |
| Texas: | 8.2% (75,218) |
Number of households with income $125k - 150k:| Rochelle: | 4.9% (2) |
| State: | 4.8% (44,223) |
Number of households with income $150k - 200k:| Rochelle: | 4.9% (2) |
| Texas: | 5.6% (51,376) |
Number of households with income > $200k:| Rochelle: | 4.9% (2) |
| Texas: | 4.0% (36,393) |
Aggregate household income in Rochelle in 2022: $3,135,592
Median family income in Rochelle in 2022:| Rochelle: | $39,340 |
| Texas: | $60,064 |
Median per capita income in Rochelle in 2022:| Rochelle: | $17,161 |
| Texas: | $23,899 |
Change in median per capita income between 2000 and 2022:| Rochelle, Texas: | +141.8% |
| Texas: | +135.2% |