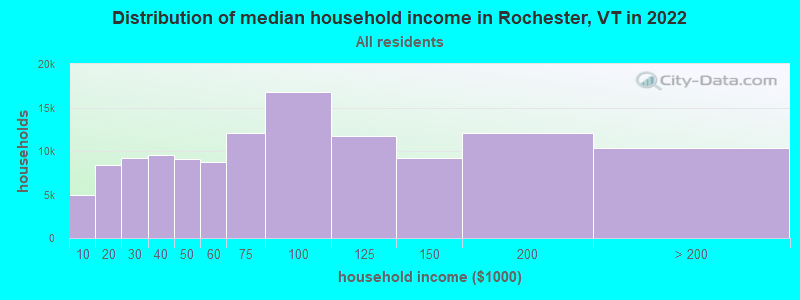
The median household income in Rochester, VT in 2022 was $65,312, which was 13.3% less than the median annual income of $73,991 across the entire state of Vermont. Compared to the median income of $35,820 in 2000 this represents an increase of 45.2%. The per capita income in 2022 was $40,932, which means an increase of 51.2% compared to 2000 when it was $19,986.
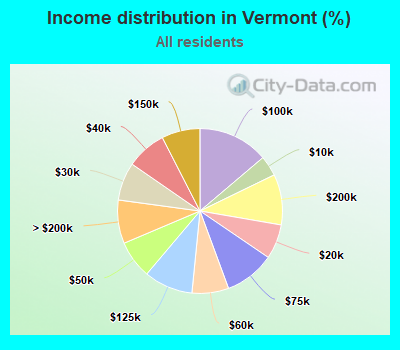
Income statistics for all residents
Median household income in Rochester, VT in 2022:
Rochester:
$65,313
State:
$73,991
Change in median household income between 2000 and 2022:
Rochester, Vermont:
+82.3%
State:
+81.1%
Number of households with income < $10k:
Rochester:
4.1% (4,988)
State:
4.0% (11,050)
Number of households with income $10k - 20k:
Rochester:
6.9% (8,399)
State:
6.8% (18,853)
Number of households with income $20k - 30k:
Rochester:
7.5% (9,176)
State:
7.5% (20,673)
Number of households with income $30k - 40k:
Rochester:
7.8% (9,568)
State:
7.8% (21,750)
Number of households with income $40k - 50k:
Rochester:
7.4% (9,100)
Vermont:
7.4% (20,642)
Number of households with income $50k - 60k:
Rochester:
7.2% (8,764)
State:
7.2% (19,901)
Number of households with income $60k - 75k:
Rochester:
9.9% (12,080)
State:
9.9% (27,351)
Number of households with income $75k - 100k:
Rochester:
13.7% (16,781)
State:
13.8% (38,275)
Number of households with income $100k - 125k:
Rochester:
9.6% (11,732)
State:
9.6% (26,632)
Number of households with income $125k - 150k:
Rochester:
7.5% (9,171)
State:
7.5% (20,857)
Number of households with income $150k - 200k:
Rochester:
9.9% (12,119)
State:
9.9% (27,469)
Number of households with income > $200k:
Rochester:
8.5% (10,382)
Vermont:
8.5% (23,637)
Aggregate household income in Rochester in 2022: $145,807,149
Median family income in Rochester in 2022:
Rochester:
$83,369
Vermont:
$96,345
Median non-family income in Rochester in 2022:
Rochester:
$44,635
State:
$46,022
Change in median non-family income between 2000 and 2022:
Rochester, Vermont:
+87.9%
State:
+87.4%
Median per capita income in Rochester in 2022:
Rochester:
$40,933
State:
$42,251
Change in median per capita income between 2000 and 2022:
Rochester, Vermont:
+104.8%
State:
+104.9%
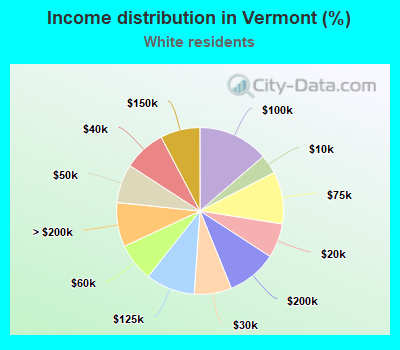
Income statistics for White residents
Median household income in Rochester, VT in 2022:
Rochester:
$64,842
State:
$73,591
Change in median household income between 2000 and 2022:
Rochester, Vermont:
+80.8%
Vermont:
+79.2%
Number of households with income < $10k:
Rochester:
3.8% (4,251)
State:
3.7% (9,508)
Number of households with income $10k - 20k:
Rochester:
6.7% (7,560)
State:
6.7% (17,064)
Number of households with income $20k - 30k:
Rochester:
7.3% (8,187)
State:
7.2% (18,552)
Number of households with income $30k - 40k:
Rochester:
8.1% (9,146)
State:
8.2% (20,886)
Number of households with income $40k - 50k:
Rochester:
7.5% (8,416)
State:
7.5% (19,216)
Number of households with income $50k - 60k:
Rochester:
7.4% (8,280)
Vermont:
7.4% (18,898)
Number of households with income $60k - 75k:
Rochester:
10.2% (11,414)
Vermont:
10.1% (25,944)
Number of households with income $75k - 100k:
Rochester:
13.6% (15,253)
Vermont:
13.7% (34,991)
Number of households with income $100k - 125k:
Rochester:
9.5% (10,681)
Vermont:
9.5% (24,409)
Number of households with income $125k - 150k:
Rochester:
7.7% (8,632)
State:
7.7% (19,710)
Number of households with income $150k - 200k:
Rochester:
9.7% (10,856)
Vermont:
9.7% (24,802)
Number of households with income > $200k:
Rochester:
8.5% (9,593)
State:
8.6% (21,983)
Aggregate household income in Rochester in 2022: $131,868,751
Median family income in Rochester in 2022:
Rochester:
$82,668
Vermont:
$96,147
Number of families with income < $10k:
Rochester:
2.0% (5)
State:
1.8% (2,669)
Number of families with income $10k - 20k:
Rochester:
2.5% (7)
State:
3.1% (4,686)
Number of families with income $20k - 30k:
Rochester:
8.3% (22)
Vermont:
4.1% (6,266)
Number of families with income $30k - 40k:
Rochester:
9.8% (26)
State:
6.1% (9,273)
Number of families with income $40k - 50k:
Rochester:
8.8% (23)
State:
6.4% (9,714)
Number of families with income $50k - 60k:
Rochester:
5.7% (15)
State:
6.1% (9,310)
Number of families with income $60k - 75k:
Rochester:
8.8% (23)
Vermont:
9.3% (14,175)
Number of families with income $75k - 100k:
Rochester:
15.3% (40)
State:
15.5% (23,673)
Number of families with income $100k - 125k:
Rochester:
8.0% (21)
Vermont:
12.7% (19,323)
Number of families with income $125k - 150k:
Rochester:
6.5% (17)
Vermont:
9.7% (14,805)
Number of families with income $150k - 200k:
Rochester:
10.2% (27)
Vermont:
13.1% (20,018)
Number of families with income > $200k:
Rochester:
14.0% (36)
State:
12.1% (18,463)
Median non-family income in Rochester in 2022:
Rochester:
$44,938
Vermont:
$45,952
Change in median non-family income between 2000 and 2022:
Rochester, Vermont:
+86.8%
Vermont:
+86.1%
Median per capita income in Rochester in 2022:
Rochester:
$40,932
State:
$43,031
Change in median per capita income between 2000 and 2022:
Rochester, Vermont:
+106.2%
Vermont:
+106.0%
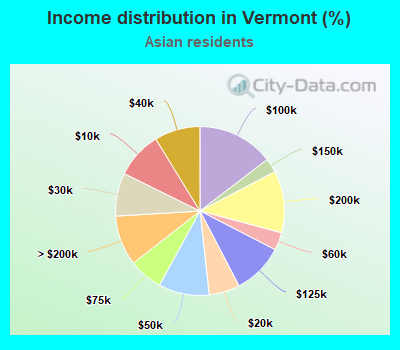
Income statistics for Asian residents
Median household income in Rochester, VT in 2022:
Rochester:
$152,748
State:
$70,809
Change in median household income between 2000 and 2022:
Rochester, Vermont:
+78.7%
State:
+78.7%
Number of households with income < $10k:
Rochester:
5.3% (596,606)
State:
8.9% (278)
Number of households with income $10k - 20k:
Rochester:
4.8% (538,577)
State:
5.9% (184)
Number of households with income $20k - 30k:
Rochester:
4.7% (527,127)
Vermont:
8.3% (258)
Number of households with income $30k - 40k:
Rochester:
4.7% (523,244)
Vermont:
8.8% (273)
Number of households with income $40k - 50k:
Rochester:
4.6% (515,245)
State:
9.7% (302)
Number of households with income $50k - 60k:
Rochester:
4.8% (534,779)
State:
3.4% (106)
Number of households with income $60k - 75k:
Rochester:
6.9% (766,939)
Vermont:
6.5% (202)
Number of households with income $75k - 100k:
Rochester:
10.9% (1,214,954)
Vermont:
14.6% (455)
Number of households with income $100k - 125k:
Rochester:
10.0% (1,113,809)
State:
9.8% (305)
Number of households with income $125k - 150k:
Rochester:
7.8% (876,445)
State:
2.7% (85)
Number of households with income $150k - 200k:
Rochester:
11.8% (1,322,772)
State:
11.8% (369)
Number of households with income > $200k:
Rochester:
23.7% (2,655,563)
State:
9.6% (299)
Aggregate household income in Rochester in 2022: $735,450
Median family income in Rochester in 2022:
Rochester:
$174,530
Vermont:
$95,526
Median per capita income in Rochester in 2022:
Rochester:
$81,103
State:
$32,037
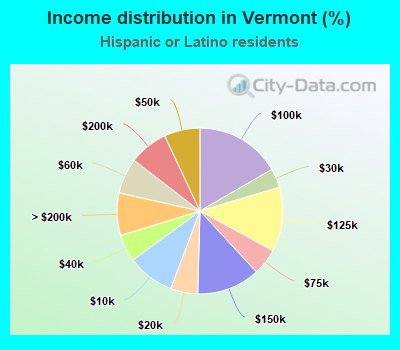
Income statistics for Hispanic or Latino residents
Median household income in Rochester, VT in 2022:
Rochester:
$90,880
State:
$90,490
Change in median household income between 2000 and 2022:
Rochester, Vermont:
+134.5%
Vermont:
+133.7%
Number of households with income < $10k:
Rochester:
9.2% (500)
State:
9.2% (500)
Number of households with income $10k - 20k:
Rochester:
5.3% (288)
State:
5.3% (288)
Number of households with income $20k - 30k:
Rochester:
3.7% (203)
Vermont:
3.7% (203)
Number of households with income $30k - 40k:
Rochester:
5.3% (288)
State:
5.3% (288)
Number of households with income $40k - 50k:
Rochester:
7.0% (379)
State:
7.0% (379)
Number of households with income $50k - 60k:
Rochester:
6.9% (376)
State:
6.9% (376)
Number of households with income $60k - 75k:
Rochester:
5.2% (282)
State:
5.2% (282)
Number of households with income $75k - 100k:
Rochester:
16.7% (906)
State:
16.7% (905)
Number of households with income $100k - 125k:
Rochester:
12.5% (682)
Vermont:
12.6% (682)
Number of households with income $125k - 150k:
Rochester:
12.3% (669)
State:
12.3% (669)
Number of households with income $150k - 200k:
Rochester:
7.6% (412)
State:
7.6% (412)
Number of households with income > $200k:
Rochester:
8.3% (450)
State:
8.3% (450)
Aggregate household income in Rochester in 2022: $1,034,761
Median family income in Rochester in 2022:
Rochester:
$96,214
State:
$116,955
Median per capita income in Rochester in 2022:
Rochester:
$39,134
Vermont:
$36,311
Change in median per capita income between 2000 and 2022:
Rochester, Vermont:
+132.4%
State:
+131.1%
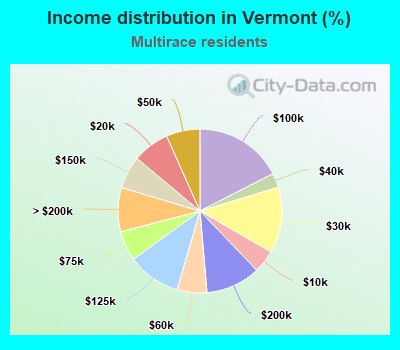
Income statistics for Multirace residents
Median household income in Rochester, VT in 2022:
Rochester:
$62,518
State:
$81,819
Number of households with income < $10k:
Rochester:
4.5% (457)
Vermont:
4.5% (613)
Number of households with income $10k - 20k:
Rochester:
7.3% (737)
State:
7.3% (988)
Number of households with income $20k - 30k:
Rochester:
13.0% (1,321)
Vermont:
13.0% (1,770)
Number of households with income $30k - 40k:
Rochester:
2.8% (288)
State:
2.8% (386)
Number of households with income $40k - 50k:
Rochester:
6.7% (675)
State:
6.7% (904)
Number of households with income $50k - 60k:
Rochester:
5.9% (595)
Vermont:
5.9% (797)
Number of households with income $60k - 75k:
Rochester:
5.9% (600)
Vermont:
5.9% (804)
Number of households with income $75k - 100k:
Rochester:
17.5% (1,773)
State:
17.5% (2,376)
Number of households with income $100k - 125k:
Rochester:
10.5% (1,065)
State:
10.5% (1,427)
Number of households with income $125k - 150k:
Rochester:
6.5% (655)
State:
6.5% (877)
Number of households with income $150k - 200k:
Rochester:
10.8% (1,095)
Vermont:
10.8% (1,467)
Number of households with income > $200k:
Rochester:
8.7% (881)
State:
8.7% (1,180)
Aggregate household income in Rochester in 2022: $4,853,564
Median family income in Rochester in 2022:
Rochester:
$68,972
State:
$98,198
Median non-family income in Rochester in 2022:
Rochester:
$51,244
State:
$44,940
Change in median non-family income between 2000 and 2022:
Rochester, Vermont:
+132.0%
Vermont:
+160.3%
Median per capita income in Rochester in 2022:
Rochester:
$100,143
State:
$34,567
Discuss Rochester, Vermont (VT) on our hugely popular Vermont forum.