The median household income in Rockport, MA in 2022 was $87,709, which was 7.7% less than the median annual income of $94,488 across the entire state of Massachusetts. Compared to the median income of $47,360 in 2000 this represents an increase of 46.0%. The per capita income in 2022 was $60,751, which means an increase of 51.4% compared to 2000 when it was $29,506.
Whole page based on the data from 2000 / 2022 when the population of Rockport, Massachusetts was 5,606 / 4,947
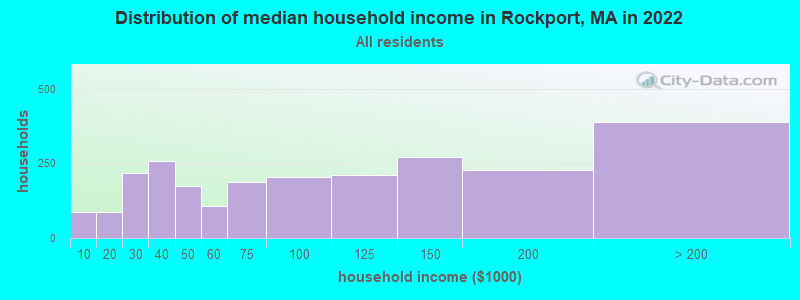
Income statistics for all residents
Median household income in Rockport, MA in 2022:
Rockport:
$87,709
Massachusetts:
$94,488
Change in median household income between 2000 and 2022:
Rockport, Massachusetts:
+85.2%
Massachusetts:
+87.1%
Number of households with income < $10k:
Rockport:
3.6% (87)
State:
5.2% (146,170)
Number of households with income $10k - 20k:
Rockport:
3.6% (88)
Massachusetts:
6.4% (180,001)
Number of households with income $20k - 30k:
Rockport:
9.0% (219)
State:
5.6% (156,667)
Number of households with income $30k - 40k:
Rockport:
10.7% (258)
State:
5.6% (157,168)
Number of households with income $40k - 50k:
Rockport:
7.1% (173)
Massachusetts:
5.4% (151,455)
Number of households with income $50k - 60k:
Rockport:
4.4% (106)
State:
5.1% (142,726)
Number of households with income $60k - 75k:
Rockport:
7.7% (187)
State:
7.6% (212,203)
Number of households with income $75k - 100k:
Rockport:
8.5% (206)
State:
11.3% (317,064)
Number of households with income $100k - 125k:
Rockport:
8.7% (210)
State:
9.7% (270,603)
Number of households with income $125k - 150k:
Rockport:
11.2% (270)
State:
8.0% (223,140)
Number of households with income $150k - 200k:
Rockport:
9.4% (228)
State:
11.0% (308,695)
Number of households with income > $200k:
Rockport:
16.1% (389)
State:
19.0% (531,884)
Aggregate household income in Rockport in 2022: $293,677,184
Median family income in Rockport in 2022:
Rockport:
$131,793
State:
$120,263
Number of families with income < $10k:
Rockport:
1.2% (17)
State:
2.9% (49,671)
Number of families with income $10k - 20k:
Rockport:
2.5% (36)
State:
2.9% (50,542)
Number of families with income $20k - 30k:
Rockport:
1.8% (25)
State:
3.9% (66,398)
Number of families with income $30k - 40k:
Rockport:
12.2% (176)
Massachusetts:
4.5% (78,234)
Number of families with income $40k - 50k:
Rockport:
2.3% (33)
State:
4.5% (77,656)
Number of families with income $50k - 60k:
Rockport:
3.9% (57)
State:
4.5% (77,928)
Number of families with income $60k - 75k:
Rockport:
7.2% (105)
State:
7.0% (120,295)
Number of families with income $75k - 100k:
Rockport:
8.7% (126)
State:
11.1% (192,172)
Number of families with income $100k - 125k:
Rockport:
8.4% (121)
State:
10.6% (182,105)
Number of families with income $125k - 150k:
Rockport:
15.5% (225)
Massachusetts:
9.3% (159,566)
Number of families with income $150k - 200k:
Rockport:
14.6% (212)
Massachusetts:
13.4% (231,410)
Number of families with income > $200k:
Rockport:
21.7% (314)
Massachusetts:
25.4% (438,378)
Median non-family income in Rockport in 2022:
Rockport:
$47,670
State:
$55,979
Change in median non-family income between 2000 and 2022:
Rockport, Massachusetts:
+126.2%
State:
+88.0%
Median per capita income in Rockport in 2022:
Rockport:
$60,751
State:
$54,025
Change in median per capita income between 2000 and 2022:
Rockport, Massachusetts:
+105.9%
State:
+108.2%
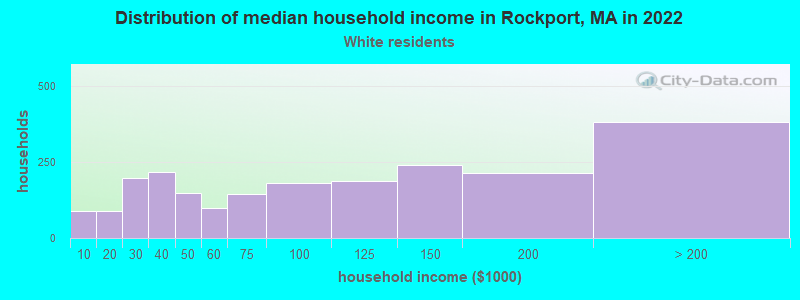
Income statistics for White residents
Median household income in Rockport, MA in 2022:
Rockport:
$90,861
State:
$101,391
Change in median household income between 2000 and 2022:
Rockport, Massachusetts:
+88.0%
State:
+93.3%
Number of households with income < $10k:
Rockport:
4.1% (89)
State:
4.4% (91,120)
Number of households with income $10k - 20k:
Rockport:
4.1% (89)
State:
5.9% (122,055)
Number of households with income $20k - 30k:
Rockport:
9.0% (198)
State:
5.1% (105,311)
Number of households with income $30k - 40k:
Rockport:
10.0% (218)
State:
5.3% (110,239)
Number of households with income $40k - 50k:
Rockport:
6.8% (149)
State:
5.0% (104,636)
Number of households with income $50k - 60k:
Rockport:
4.5% (98)
Massachusetts:
4.8% (99,486)
Number of households with income $60k - 75k:
Rockport:
6.6% (145)
State:
7.5% (155,124)
Number of households with income $75k - 100k:
Rockport:
8.3% (182)
Massachusetts:
11.4% (236,252)
Number of households with income $100k - 125k:
Rockport:
8.5% (186)
State:
9.9% (204,731)
Number of households with income $125k - 150k:
Rockport:
11.0% (240)
Massachusetts:
8.5% (175,324)
Number of households with income $150k - 200k:
Rockport:
9.7% (213)
Massachusetts:
11.7% (242,980)
Number of households with income > $200k:
Rockport:
17.4% (381)
State:
20.5% (425,966)
Aggregate household income in Rockport in 2022: $273,986,171
Median family income in Rockport in 2022:
Rockport:
$135,591
State:
$133,153
Number of families with income < $10k:
Rockport:
1.2% (15)
State:
2.0% (25,038)
Number of families with income $10k - 20k:
Rockport:
2.5% (32)
State:
2.1% (26,403)
Number of families with income $20k - 30k:
Rockport:
1.8% (22)
State:
2.6% (32,525)
Number of families with income $30k - 40k:
Rockport:
10.8% (137)
State:
3.9% (48,079)
Number of families with income $40k - 50k:
Rockport:
2.2% (28)
State:
3.8% (46,908)
Number of families with income $50k - 60k:
Rockport:
3.7% (47)
State:
3.8% (46,476)
Number of families with income $60k - 75k:
Rockport:
5.3% (67)
Massachusetts:
6.4% (79,040)
Number of families with income $75k - 100k:
Rockport:
8.2% (104)
Massachusetts:
11.1% (137,395)
Number of families with income $100k - 125k:
Rockport:
8.9% (113)
Massachusetts:
11.1% (136,771)
Number of families with income $125k - 150k:
Rockport:
16.1% (204)
State:
10.0% (123,709)
Number of families with income $150k - 200k:
Rockport:
15.3% (194)
State:
14.7% (181,602)
Number of families with income > $200k:
Rockport:
24.1% (306)
State:
28.5% (351,887)
Median non-family income in Rockport in 2022:
Rockport:
$46,637
State:
$59,323
Change in median non-family income between 2000 and 2022:
Rockport, Massachusetts:
+118.2%
Massachusetts:
+94.3%
Median per capita income in Rockport in 2022:
Rockport:
$64,683
State:
$60,804
Change in median per capita income between 2000 and 2022:
Rockport, Massachusetts:
+115.8%
State:
+118.7%
Income statistics for Black or African American residents
Median per capita income in Rockport in 2022:
Rockport:
$19,439
State:
$33,524
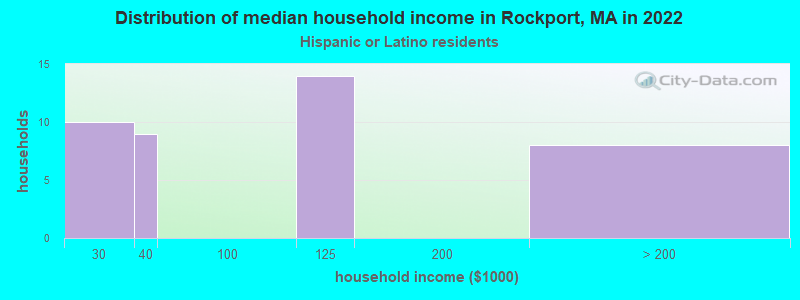
Income statistics for Hispanic or Latino residents
Number of households with income < $10k:
Rockport:
0.0% (0)
State:
8.8% (25,307)
Number of households with income $10k - 20k:
Rockport:
0.0% (0)
Massachusetts:
10.0% (28,653)
Number of households with income $20k - 30k:
Rockport:
24.4% (10)
State:
8.8% (25,189)
Number of households with income $30k - 40k:
Rockport:
22.0% (9)
State:
7.2% (20,822)
Number of households with income $40k - 50k:
Rockport:
0.0% (0)
Massachusetts:
7.2% (20,817)
Number of households with income $50k - 60k:
Rockport:
0.0% (0)
State:
6.5% (18,748)
Number of households with income $60k - 75k:
Rockport:
0.0% (0)
State:
8.8% (25,390)
Number of households with income $75k - 100k:
Rockport:
0.0% (0)
Massachusetts:
12.0% (34,488)
Number of households with income $100k - 125k:
Rockport:
34.1% (14)
State:
8.6% (24,599)
Number of households with income $125k - 150k:
Rockport:
0.0% (0)
State:
6.2% (17,743)
Number of households with income $150k - 200k:
Rockport:
0.0% (0)
State:
7.3% (21,017)
Number of households with income > $200k:
Rockport:
19.5% (8)
State:
8.6% (24,606)
Aggregate household income in Rockport in 2022: $5,781,539
Median per capita income in Rockport in 2022:
Rockport:
$40,637
State:
$28,993
Income statistics for American Indian and Alaska Native residents
Median per capita income in Rockport in 2022:
Rockport:
$61,010
State:
$39,434
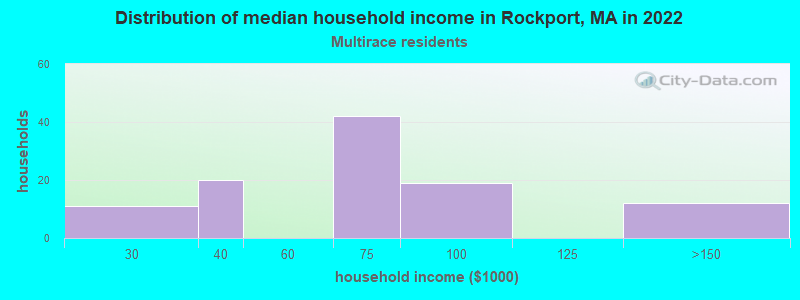
Income statistics for Multirace residents
Median household income in Rockport, MA in 2022:
Rockport:
$78,777
State:
$71,552
Number of households with income < $10k:
Rockport:
0.0% (0)
State:
6.6% (15,127)
Number of households with income $10k - 20k:
Rockport:
0.0% (0)
State:
9.2% (21,158)
Number of households with income $20k - 30k:
Rockport:
10.6% (11)
Massachusetts:
7.8% (18,016)
Number of households with income $30k - 40k:
Rockport:
19.2% (20)
State:
7.9% (18,260)
Number of households with income $40k - 50k:
Rockport:
0.0% (0)
Massachusetts:
5.6% (13,027)
Number of households with income $50k - 60k:
Rockport:
0.0% (0)
State:
5.6% (12,909)
Number of households with income $60k - 75k:
Rockport:
40.4% (42)
State:
9.0% (20,800)
Number of households with income $75k - 100k:
Rockport:
18.3% (19)
State:
12.1% (27,875)
Number of households with income $100k - 125k:
Rockport:
0.0% (0)
State:
8.1% (18,754)
Number of households with income $125k - 150k:
Rockport:
11.5% (12)
State:
6.8% (15,621)
Number of households with income $150k - 200k:
Rockport:
0.0% (0)
Massachusetts:
9.4% (21,618)
Number of households with income > $200k:
Rockport:
0.0% (0)
Massachusetts:
12.0% (27,592)
Aggregate household income in Rockport in 2022: $5,975,946
Median family income in Rockport in 2022:
Rockport:
$73,991
State:
$78,380
Number of families with income $30k - 40k:
Rockport:
14.4% (13)
State:
8.2% (12,705)
Number of families with income $60k - 75k:
Rockport:
52.0% (48)
State:
10.3% (16,064)
Number of families with income $75k - 100k:
Rockport:
22.5% (21)
Massachusetts:
12.1% (18,758)
Number of families with income $125k - 150k:
Rockport:
11.2% (10)
Massachusetts:
7.2% (11,128)
Median per capita income in Rockport in 2022:
Rockport:
$32,607
State:
$34,029
Income statistics for other residents
Number of households with income < $10k:
Rockport:
0.0% (0)
State:
8.4% (11,559)
Number of households with income $10k - 20k:
Rockport:
0.0% (0)
State:
8.4% (11,499)
Number of households with income $20k - 30k:
Rockport:
0.0% (0)
State:
9.5% (13,070)
Number of households with income $30k - 40k:
Rockport:
0.0% (0)
State:
6.0% (8,291)
Number of households with income $40k - 50k:
Rockport:
0.0% (0)
State:
9.2% (12,611)
Number of households with income $50k - 60k:
Rockport:
0.0% (0)
State:
7.9% (10,879)
Number of households with income $60k - 75k:
Rockport:
0.0% (0)
Massachusetts:
7.5% (10,239)
Number of households with income $75k - 100k:
Rockport:
0.0% (0)
State:
13.1% (18,032)
Number of households with income $100k - 125k:
Rockport:
100.0% (18)
State:
9.6% (13,141)
Number of households with income $125k - 150k:
Rockport:
0.0% (0)
Massachusetts:
5.0% (6,808)
Number of households with income $150k - 200k:
Rockport:
0.0% (0)
State:
6.4% (8,843)
Number of households with income > $200k:
Rockport:
0.0% (0)
Massachusetts:
9.0% (12,396)
Median per capita income in Rockport in 2022:
Rockport:
$124,831
Massachusetts:
$30,797
Discuss Rockport, Massachusetts (MA) on our hugely popular Massachusetts forum.