The median household income in Rosburg, WA in 2022 was $55,370, which was 64.9% less than the median annual income of $91,306 across the entire state of Washington. Compared to the median income of $39,444 in 2000 this represents an increase of 28.8%. The per capita income in 2022 was $22,645, which means an increase of 15.8% compared to 2000 when it was $19,063.
Whole page based on the data from 2000 / 2022 when the population of Rosburg, Washington was 317 / 434
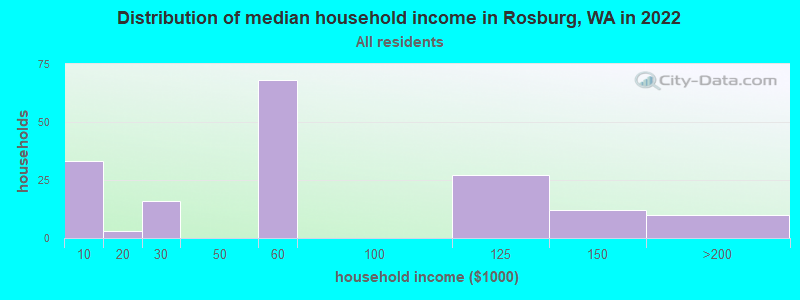
Income statistics for all residents
Median household income in Rosburg, WA in 2022:
Rosburg:
$55,371
State:
$91,306
Change in median household income between 2000 and 2022:
Rosburg, Washington:
+40.4%
State:
+99.5%
Number of households with income < $10k:
Rosburg:
19.5% (33)
State:
4.5% (139,331)
Number of households with income $10k - 20k:
Rosburg:
1.8% (3)
Washington:
5.0% (154,508)
Number of households with income $20k - 30k:
Rosburg:
9.5% (16)
State:
5.4% (166,555)
Number of households with income $30k - 40k:
Rosburg:
0.0% (0)
State:
5.5% (170,324)
Number of households with income $40k - 50k:
Rosburg:
0.0% (0)
State:
6.0% (183,941)
Number of households with income $50k - 60k:
Rosburg:
40.2% (68)
State:
6.1% (187,395)
Number of households with income $60k - 75k:
Rosburg:
0.0% (0)
Washington:
8.7% (266,771)
Number of households with income $75k - 100k:
Rosburg:
0.0% (0)
State:
13.1% (404,672)
Number of households with income $100k - 125k:
Rosburg:
16.0% (27)
State:
11.0% (337,911)
Number of households with income $125k - 150k:
Rosburg:
7.1% (12)
Washington:
8.0% (244,934)
Number of households with income $150k - 200k:
Rosburg:
5.9% (10)
State:
10.5% (323,812)
Number of households with income > $200k:
Rosburg:
0.0% (0)
Washington:
16.2% (499,799)
Aggregate household income in Rosburg in 2022: $11,035,354
Median family income in Rosburg in 2022:
Rosburg:
$56,519
State:
$109,192
Number of families with income $10k - 20k:
Rosburg:
2.8% (3)
State:
2.6% (50,138)
Number of families with income $20k - 30k:
Rosburg:
3.9% (4)
State:
3.2% (61,974)
Number of families with income $50k - 60k:
Rosburg:
54.5% (62)
State:
5.3% (101,674)
Number of families with income $75k - 100k:
Rosburg:
7.2% (8)
Washington:
13.8% (267,812)
Number of families with income $100k - 125k:
Rosburg:
16.6% (19)
State:
12.4% (240,213)
Number of families with income $125k - 150k:
Rosburg:
6.1% (7)
State:
9.3% (180,011)
Number of families with income $150k - 200k:
Rosburg:
8.8% (10)
Washington:
13.0% (250,874)
Median income for families with 0 earners:
Rosburg:
$160,039
State:
$60,470
Median income for families with 1 earner:
Rosburg:
$0
Washington:
$83,136
Median income for families with 2 earners:
Rosburg:
$0
Washington:
$135,539
Median income for families with 3+ earners:
Rosburg:
$0
Washington:
$163,538
Median per capita income in Rosburg in 2022:
Rosburg:
$22,645
Washington:
$50,764
Change in median per capita income between 2000 and 2022:
Rosburg, Washington:
+18.8%
State:
+121.0%
Income statistics for White residents
Median household income in Rosburg, WA in 2022:
Rosburg:
$54,706
Washington:
$91,916
Change in median household income between 2000 and 2022:
Rosburg, Washington:
+38.4%
State:
+95.4%
Number of households with income < $10k:
Rosburg:
20.8% (32)
State:
4.3% (95,850)
Number of households with income $10k - 20k:
Rosburg:
1.9% (3)
State:
4.8% (106,421)
Number of households with income $20k - 30k:
Rosburg:
9.7% (15)
Washington:
5.5% (122,860)
Number of households with income $30k - 40k:
Rosburg:
0.0% (0)
Washington:
5.4% (119,627)
Number of households with income $40k - 50k:
Rosburg:
0.0% (0)
Washington:
5.9% (132,276)
Number of households with income $50k - 60k:
Rosburg:
42.2% (65)
State:
6.1% (136,212)
Number of households with income $60k - 75k:
Rosburg:
0.0% (0)
State:
8.8% (196,086)
Number of households with income $75k - 100k:
Rosburg:
0.0% (0)
State:
13.4% (299,192)
Number of households with income $100k - 125k:
Rosburg:
11.7% (18)
Washington:
11.3% (252,209)
Number of households with income $125k - 150k:
Rosburg:
7.1% (11)
State:
7.9% (175,962)
Number of households with income $150k - 200k:
Rosburg:
6.5% (10)
Washington:
10.7% (239,156)
Number of households with income > $200k:
Rosburg:
0.0% (0)
State:
16.1% (359,917)
Aggregate household income in Rosburg in 2022: $9,698,956
Median family income in Rosburg in 2022:
Rosburg:
$55,957
Washington:
$112,511
Number of families with income $10k - 20k:
Rosburg:
3.0% (3)
State:
2.0% (28,228)
Number of families with income $20k - 30k:
Rosburg:
4.2% (4)
State:
2.9% (39,288)
Number of families with income $50k - 60k:
Rosburg:
58.1% (57)
State:
5.0% (69,270)
Number of families with income $100k - 125k:
Rosburg:
18.4% (18)
State:
13.2% (182,184)
Number of families with income $125k - 150k:
Rosburg:
6.6% (6)
State:
9.5% (130,928)
Number of families with income $150k - 200k:
Rosburg:
9.7% (10)
State:
13.7% (188,621)
Median per capita income in Rosburg in 2022:
Rosburg:
$27,806
Washington:
$55,212
Change in median per capita income between 2000 and 2022:
Rosburg, Washington:
+42.3%
Washington:
+123.8%
Income statistics for Multirace residents
Aggregate household income in Rosburg in 2022: $18,131,080
Median per capita income in Rosburg in 2022:
Rosburg:
$5,196
State:
$32,496
Change in median per capita income between 2000 and 2022:: -50.3%
Rosburg, Washington:
-50.3%
State:
+156.8%
Discuss Rosburg, Washington (WA) on our hugely popular Washington forum.