Sabine, Texas (TX) income map, earnings map, and wages data
The median household income in Sabine, TX in 2022 was $67,152, which was 7.6% less than the median annual income of $72,284 across the entire state of Texas. Compared to the median income of $38,226 in 2000 this represents an increase of 43.1%. The per capita income in 2022 was $30,576, which means an increase of 41.2% compared to 2000 when it was $17,984.
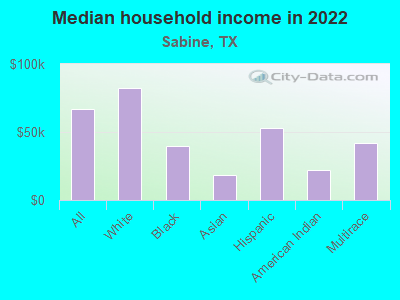
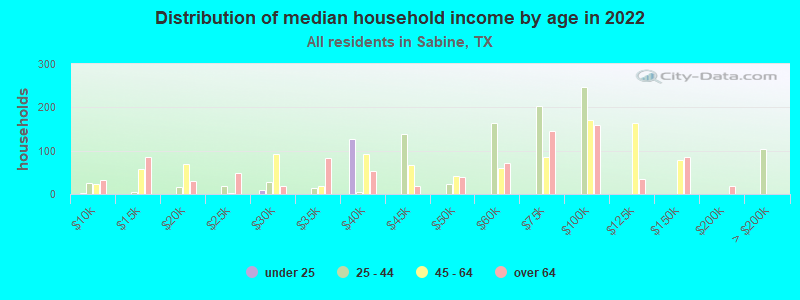
Income statistics for all residents
Median household income in Sabine, TX in 2022:| Sabine: | $67,153 |
| State: | $72,284 |
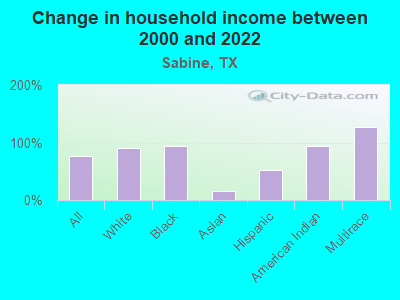
Change in median household income between 2000 and 2022:| Sabine, Texas: | +75.7% |
| State: | +81.0% |
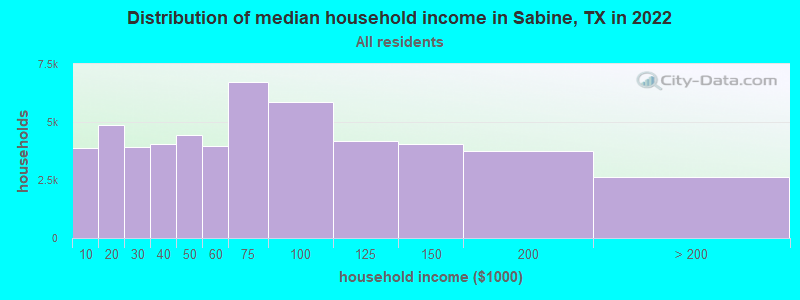
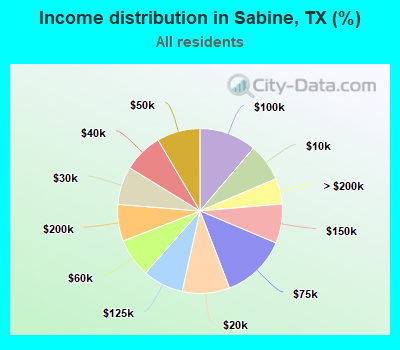
Number of households with income < $10k:| Sabine: | 7.4% (3,870) |
| Texas: | 5.5% (611,011) |
Number of households with income $10k - 20k:| Sabine: | 9.3% (4,861) |
| State: | 6.7% (743,157) |
Number of households with income $20k - 30k:| Sabine: | 7.5% (3,914) |
| State: | 7.2% (803,381) |
Number of households with income $30k - 40k:| Sabine: | 7.7% (4,047) |
| Texas: | 7.8% (866,080) |
Number of households with income $40k - 50k:| Sabine: | 8.5% (4,434) |
| Texas: | 7.3% (810,440) |
Number of households with income $50k - 60k:| Sabine: | 7.6% (3,985) |
| State: | 7.2% (799,783) |
Number of households with income $60k - 75k:| Sabine: | 12.8% (6,716) |
| State: | 9.9% (1,095,384) |
Number of households with income $75k - 100k:| Sabine: | 11.2% (5,863) |
| Texas: | 12.8% (1,419,057) |
Number of households with income $100k - 125k:| Sabine: | 8.0% (4,166) |
| Texas: | 9.5% (1,054,577) |
Number of households with income $125k - 150k:| Sabine: | 7.7% (4,031) |
| State: | 6.7% (741,518) |
Number of households with income $150k - 200k:| Sabine: | 7.2% (3,768) |
| Texas: | 8.7% (961,776) |
Number of households with income > $200k:| Sabine: | 5.0% (2,628) |
| State: | 10.7% (1,181,544) |
Aggregate household income in Sabine in 2022: $253,711,582
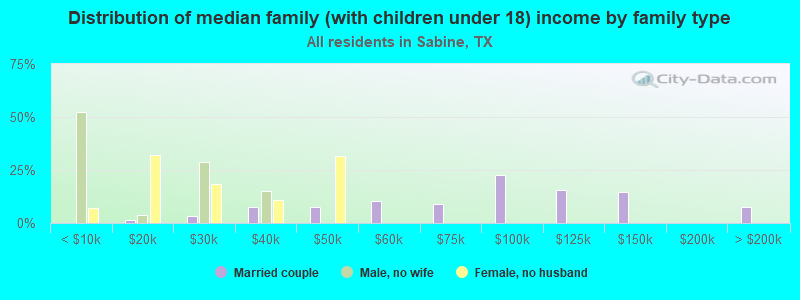
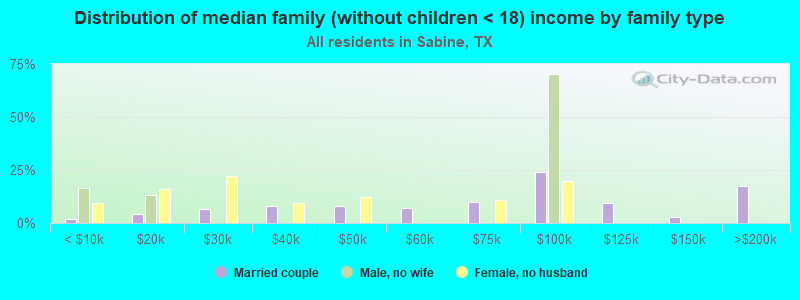
Median family income in Sabine in 2022:| Sabine: | $76,306 |
| Texas: | $86,267 |
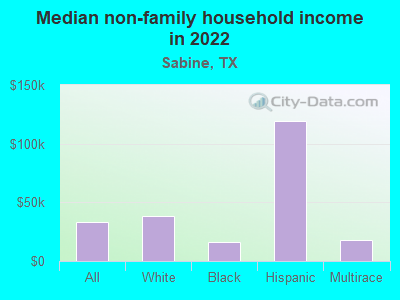
Median non-family income in Sabine in 2022:| Sabine: | $33,122 |
| Texas: | $45,999 |
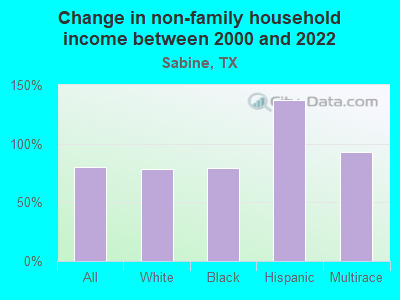
Change in median non-family income between 2000 and 2022:| Sabine, Texas: | +80.1% |
| State: | +79.5% |
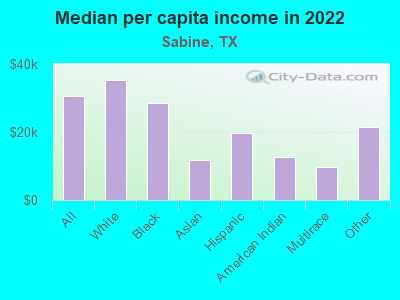
Median per capita income in Sabine in 2022:| Sabine: | $30,576 |
| Texas: | $38,123 |
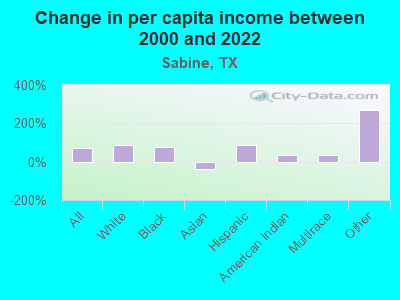
Change in median per capita income between 2000 and 2022:| Sabine, Texas: | +70.0% |
| State: | +94.3% |
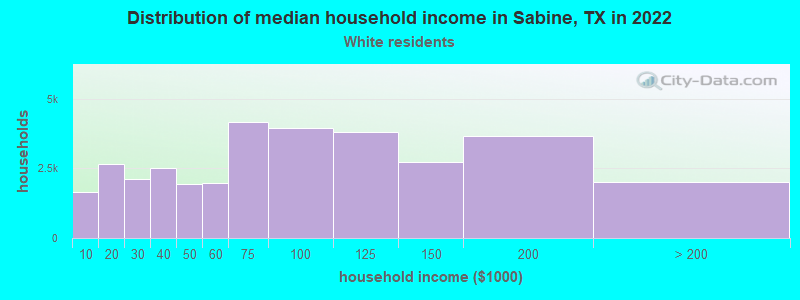
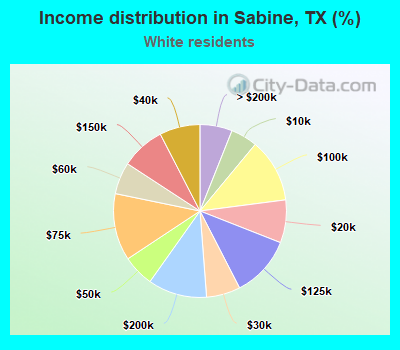
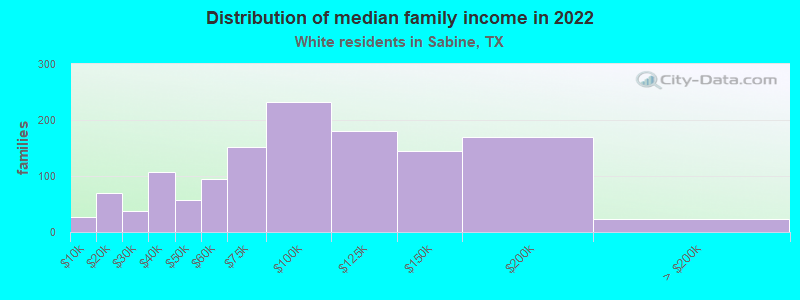
Income statistics for White residents
Median household income in Sabine, TX in 2022:| Sabine: | $82,147 |
| Texas: | $82,032 |
Change in median household income between 2000 and 2022:| Sabine, Texas: | +91.0% |
| Texas: | +91.0% |
Number of households with income < $10k:| Sabine: | 5.0% (1,654) |
| State: | 4.7% (273,716) |
Number of households with income $10k - 20k:| Sabine: | 8.0% (2,663) |
| State: | 5.5% (322,702) |
Number of households with income $20k - 30k:| Sabine: | 6.4% (2,111) |
| State: | 6.2% (363,947) |
Number of households with income $30k - 40k:| Sabine: | 7.6% (2,516) |
| State: | 6.8% (399,275) |
Number of households with income $40k - 50k:| Sabine: | 5.9% (1,949) |
| State: | 6.5% (383,417) |
Number of households with income $50k - 60k:| Sabine: | 6.0% (1,986) |
| State: | 6.6% (388,535) |
Number of households with income $60k - 75k:| Sabine: | 12.5% (4,163) |
| State: | 9.7% (566,295) |
Number of households with income $75k - 100k:| Sabine: | 11.9% (3,959) |
| State: | 13.0% (760,276) |
Number of households with income $100k - 125k:| Sabine: | 11.5% (3,809) |
| State: | 10.2% (597,596) |
Number of households with income $125k - 150k:| Sabine: | 8.2% (2,727) |
| State: | 7.4% (436,830) |
Number of households with income $150k - 200k:| Sabine: | 11.0% (3,663) |
| State: | 9.9% (583,067) |
Number of households with income > $200k:| Sabine: | 6.0% (2,009) |
| State: | 13.5% (792,647) |
Aggregate household income in Sabine in 2022: $194,872,487
Median family income in Sabine in 2022:| Sabine: | $100,020 |
| Texas: | $101,788 |
Number of families with income < $10k:| Sabine: | 2.1% (27) |
| State: | 2.8% (108,142) |
Number of families with income $10k - 20k:| Sabine: | 5.4% (70) |
| Texas: | 2.9% (113,421) |
Number of families with income $20k - 30k:| Sabine: | 2.8% (37) |
| State: | 4.1% (157,688) |
Number of families with income $30k - 40k:| Sabine: | 8.3% (107) |
| State: | 5.2% (198,847) |
Number of families with income $40k - 50k:| Sabine: | 4.4% (57) |
| Texas: | 5.6% (216,490) |
Number of families with income $50k - 60k:| Sabine: | 7.3% (95) |
| Texas: | 5.7% (220,689) |
Number of families with income $60k - 75k:| Sabine: | 11.6% (151) |
| State: | 9.0% (346,106) |
Number of families with income $75k - 100k:| Sabine: | 17.9% (232) |
| State: | 13.7% (527,363) |
Number of families with income $100k - 125k:| Sabine: | 14.0% (181) |
| Texas: | 11.6% (448,411) |
Number of families with income $125k - 150k:| Sabine: | 11.2% (145) |
| State: | 9.2% (355,798) |
Number of families with income $150k - 200k:| Sabine: | 13.1% (170) |
| State: | 12.5% (480,185) |
Number of families with income > $200k:| Sabine: | 1.9% (24) |
| Texas: | 17.6% (677,490) |
Median non-family income in Sabine in 2022:| Sabine: | $37,943 |
| Texas: | $50,587 |
Change in median non-family income between 2000 and 2022:| Sabine, Texas: | +77.6% |
| State: | +87.7% |
Median per capita income in Sabine in 2022:| Sabine: | $35,257 |
| Texas: | $47,740 |
Change in median per capita income between 2000 and 2022:| Sabine, Texas: | +85.8% |
| Texas: | +114.3% |
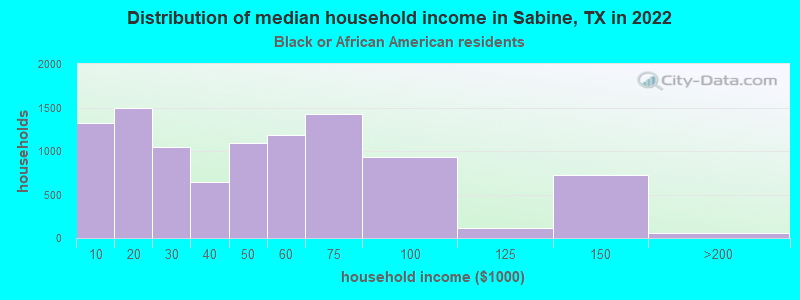
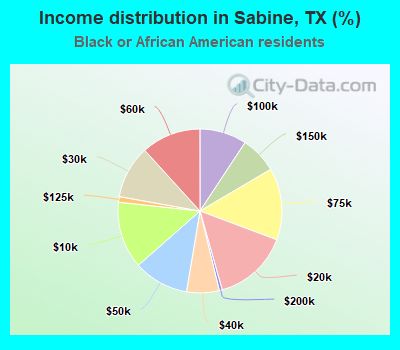
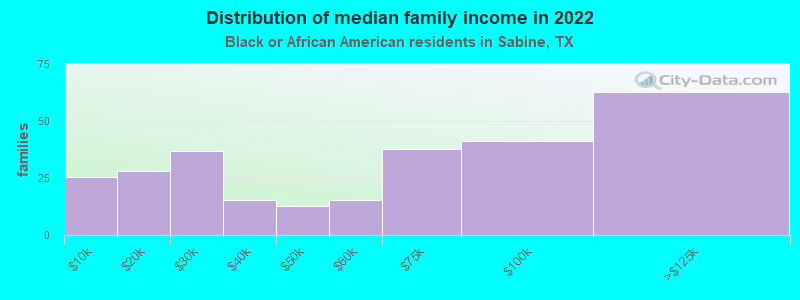
Income statistics for Black or African American residents
Median household income in Sabine, TX in 2022:| Sabine: | $39,923 |
| Texas: | $55,759 |
Change in median household income between 2000 and 2022:| Sabine, Texas: | +93.9% |
| State: | +90.3% |
Number of households with income < $10k:| Sabine: | 13.2% (1,326) |
| State: | 8.9% (126,378) |
Number of households with income $10k - 20k:| Sabine: | 14.9% (1,500) |
| Texas: | 9.9% (140,369) |
Number of households with income $20k - 30k:| Sabine: | 10.4% (1,047) |
| State: | 8.5% (120,639) |
Number of households with income $30k - 40k:| Sabine: | 6.4% (645) |
| Texas: | 9.7% (137,517) |
Number of households with income $40k - 50k:| Sabine: | 10.9% (1,092) |
| State: | 8.0% (112,973) |
Number of households with income $50k - 60k:| Sabine: | 11.7% (1,180) |
| State: | 8.3% (117,156) |
Number of households with income $60k - 75k:| Sabine: | 14.2% (1,424) |
| Texas: | 10.4% (147,462) |
Number of households with income $75k - 100k:| Sabine: | 9.3% (931) |
| Texas: | 11.5% (162,718) |
Number of households with income $100k - 125k:| Sabine: | 1.1% (111) |
| State: | 8.2% (115,829) |
Number of households with income $125k - 150k:| Sabine: | 7.3% (729) |
| State: | 4.9% (69,556) |
Number of households with income $150k - 200k:| Sabine: | 0.6% (58) |
| State: | 6.4% (90,701) |
Number of households with income > $200k:| Sabine: | 0.0% (0) |
| State: | 5.5% (77,988) |
Aggregate household income in Sabine in 2022: $30,903,374
Median family income in Sabine in 2022:| Sabine: | $44,731 |
| State: | $69,134 |
Number of families with income < $10k:| Sabine: | 9.3% (26) |
| State: | 6.8% (55,625) |
Number of families with income $10k - 20k:| Sabine: | 10.1% (28) |
| Texas: | 6.8% (55,300) |
Number of families with income $20k - 30k:| Sabine: | 13.3% (37) |
| State: | 7.1% (57,877) |
Number of families with income $30k - 40k:| Sabine: | 5.6% (15) |
| State: | 8.5% (68,776) |
Number of families with income $40k - 50k:| Sabine: | 4.6% (13) |
| Texas: | 7.1% (57,907) |
Number of families with income $50k - 60k:| Sabine: | 5.6% (16) |
| State: | 7.3% (59,511) |
Number of families with income $60k - 75k:| Sabine: | 13.7% (38) |
| Texas: | 10.1% (81,994) |
Number of families with income $75k - 100k:| Sabine: | 15.0% (41) |
| State: | 12.7% (103,723) |
Number of families with income $100k - 125k:| Sabine: | 22.8% (63) |
| State: | 9.4% (76,609) |
Median non-family income in Sabine in 2022:| Sabine: | $16,582 |
| State: | $40,133 |
Change in median non-family income between 2000 and 2022:| Sabine, Texas: | +78.6% |
| Texas: | +102.2% |
Median per capita income in Sabine in 2022:| Sabine: | $28,555 |
| Texas: | $30,490 |
Change in median per capita income between 2000 and 2022:| Sabine, Texas: | +77.7% |
| State: | +113.9% |
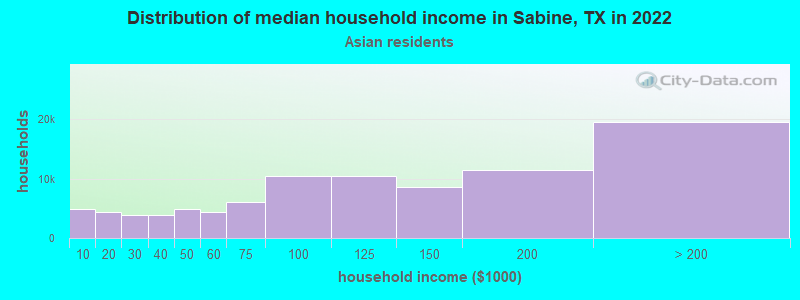
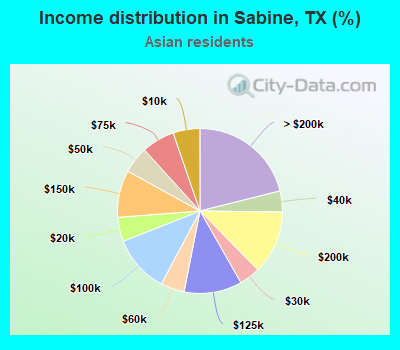
Income statistics for Asian residents
Median household income in Sabine, TX in 2022:| Sabine: | $18,639 |
| Texas: | $107,673 |
Change in median household income between 2000 and 2022:| Sabine, Texas: | +14.7% |
| State: | +115.1% |
Number of households with income < $10k:| Sabine: | 5.3% (4,858) |
| Texas: | 5.2% (29,885) |
Number of households with income $10k - 20k:| Sabine: | 4.8% (4,396) |
| Texas: | 4.7% (27,044) |
Number of households with income $20k - 30k:| Sabine: | 4.1% (3,789) |
| Texas: | 4.1% (23,363) |
Number of households with income $30k - 40k:| Sabine: | 4.1% (3,788) |
| State: | 4.1% (23,309) |
Number of households with income $40k - 50k:| Sabine: | 5.2% (4,841) |
| Texas: | 5.2% (29,826) |
Number of households with income $50k - 60k:| Sabine: | 4.6% (4,295) |
| Texas: | 4.7% (26,512) |
Number of households with income $60k - 75k:| Sabine: | 6.5% (5,998) |
| State: | 6.5% (36,905) |
Number of households with income $75k - 100k:| Sabine: | 11.3% (10,430) |
| Texas: | 11.3% (64,350) |
Number of households with income $100k - 125k:| Sabine: | 11.3% (10,497) |
| State: | 11.4% (64,714) |
Number of households with income $125k - 150k:| Sabine: | 9.3% (8,557) |
| State: | 9.3% (52,719) |
Number of households with income $150k - 200k:| Sabine: | 12.5% (11,519) |
| Texas: | 12.5% (70,953) |
Number of households with income > $200k:| Sabine: | 21.1% (19,523) |
| Texas: | 21.1% (120,260) |
Aggregate household income in Sabine in 2022: $425,494
Median family income in Sabine in 2022:| Sabine: | $15,372 |
| Texas: | $123,328 |
Number of families with income $10k - 20k:| Sabine: | 100.0% (13) |
| State: | 3.0% (13,043) |
Median per capita income in Sabine in 2022:| Sabine: | $11,707 |
| State: | $48,626 |
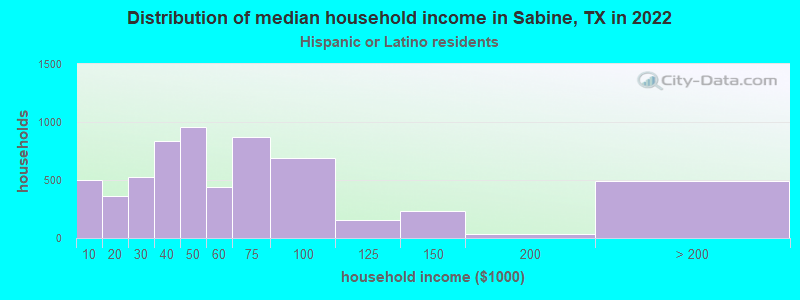
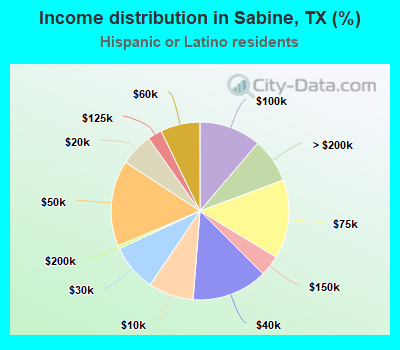
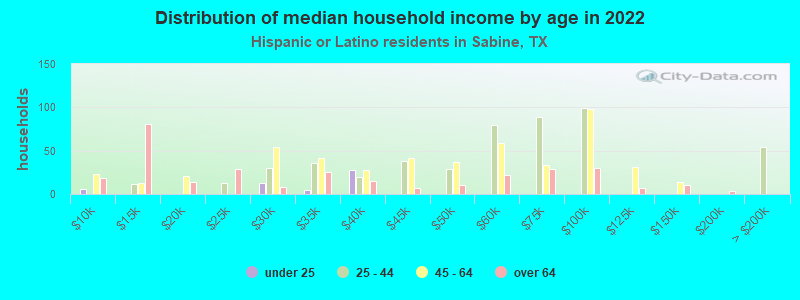
Income statistics for Hispanic or Latino residents
Median household income in Sabine, TX in 2022:| Sabine: | $52,948 |
| Texas: | $60,504 |
Change in median household income between 2000 and 2022:| Sabine, Texas: | +52.5% |
| Texas: | +102.5% |
Number of households with income < $10k:| Sabine: | 8.2% (503) |
| State: | 5.8% (213,953) |
Number of households with income $10k - 20k:| Sabine: | 5.9% (362) |
| Texas: | 8.0% (297,456) |
Number of households with income $20k - 30k:| Sabine: | 8.6% (523) |
| Texas: | 9.2% (340,166) |
Number of households with income $30k - 40k:| Sabine: | 13.7% (839) |
| State: | 9.5% (354,336) |
Number of households with income $40k - 50k:| Sabine: | 15.7% (956) |
| State: | 8.8% (327,013) |
Number of households with income $50k - 60k:| Sabine: | 7.2% (439) |
| Texas: | 8.3% (308,818) |
Number of households with income $60k - 75k:| Sabine: | 14.3% (875) |
| State: | 10.9% (405,109) |
Number of households with income $75k - 100k:| Sabine: | 11.3% (687) |
| Texas: | 13.8% (511,639) |
Number of households with income $100k - 125k:| Sabine: | 2.6% (159) |
| State: | 8.6% (319,728) |
Number of households with income $125k - 150k:| Sabine: | 3.8% (232) |
| State: | 5.7% (210,932) |
Number of households with income $150k - 200k:| Sabine: | 0.6% (34) |
| Texas: | 6.4% (236,055) |
Number of households with income > $200k:| Sabine: | 8.1% (494) |
| State: | 5.1% (189,259) |
Aggregate household income in Sabine in 2022: $14,990,217
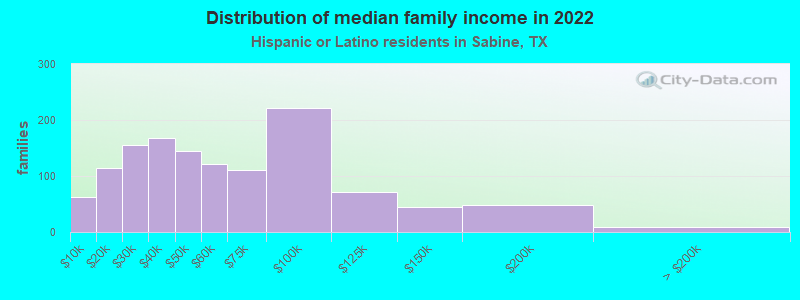
Median family income in Sabine in 2022:| Sabine: | $44,649 |
| Texas: | $65,080 |
Number of families with income < $10k:| Sabine: | 4.9% (63) |
| State: | 5.3% (147,493) |
Number of families with income $10k - 20k:| Sabine: | 9.0% (115) |
| Texas: | 6.3% (174,531) |
Number of families with income $20k - 30k:| Sabine: | 12.2% (155) |
| Texas: | 8.6% (238,528) |
Number of families with income $30k - 40k:| Sabine: | 13.2% (168) |
| State: | 9.1% (251,999) |
Number of families with income $40k - 50k:| Sabine: | 11.4% (145) |
| Texas: | 8.6% (240,188) |
Number of families with income $50k - 60k:| Sabine: | 9.6% (122) |
| State: | 8.0% (223,566) |
Number of families with income $60k - 75k:| Sabine: | 8.6% (110) |
| Texas: | 10.9% (302,688) |
Number of families with income $75k - 100k:| Sabine: | 17.4% (222) |
| State: | 14.3% (398,554) |
Number of families with income $100k - 125k:| Sabine: | 5.6% (71) |
| State: | 9.5% (264,007) |
Number of families with income $125k - 150k:| Sabine: | 3.5% (44) |
| State: | 6.2% (171,274) |
Number of families with income $150k - 200k:| Sabine: | 3.9% (49) |
| Texas: | 7.3% (202,259) |
Number of families with income > $200k:| Sabine: | 0.7% (9) |
| State: | 5.9% (165,129) |
Median non-family income in Sabine in 2022:| Sabine: | $119,330 |
| State: | $39,934 |
Change in median non-family income between 2000 and 2022:| Sabine, Texas: | +137.3% |
| Texas: | +109.1% |
Median per capita income in Sabine in 2022:| Sabine: | $19,659 |
| State: | $24,862 |
Change in median per capita income between 2000 and 2022:| Sabine, Texas: | +88.6% |
| State: | +130.8% |
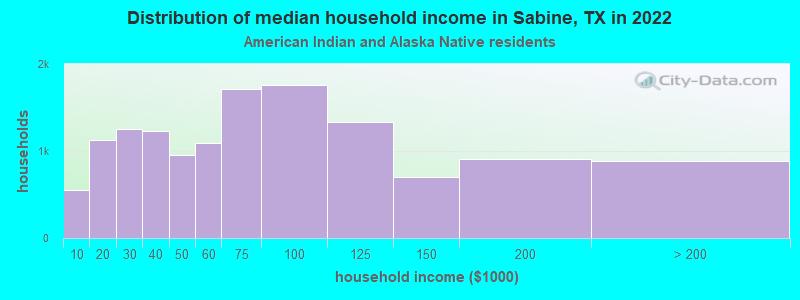
Income statistics for American Indian and Alaska Native residents
Median household income in Sabine, TX in 2022:| Sabine: | $21,794 |
| State: | $65,765 |
Change in median household income between 2000 and 2022:| Sabine, Texas: | +93.7% |
| State: | +88.3% |
Number of households with income < $10k:| Sabine: | 4.1% (548) |
| State: | 4.1% (3,398) |
Number of households with income $10k - 20k:| Sabine: | 8.3% (1,121) |
| State: | 8.3% (6,949) |
Number of households with income $20k - 30k:| Sabine: | 9.3% (1,250) |
| State: | 9.3% (7,742) |
Number of households with income $30k - 40k:| Sabine: | 9.1% (1,229) |
| State: | 9.1% (7,627) |
Number of households with income $40k - 50k:| Sabine: | 7.1% (956) |
| Texas: | 7.1% (5,922) |
Number of households with income $50k - 60k:| Sabine: | 8.1% (1,091) |
| Texas: | 8.1% (6,761) |
Number of households with income $60k - 75k:| Sabine: | 12.7% (1,708) |
| Texas: | 12.7% (10,588) |
Number of households with income $75k - 100k:| Sabine: | 13.0% (1,759) |
| Texas: | 13.0% (10,903) |
Number of households with income $100k - 125k:| Sabine: | 9.9% (1,332) |
| Texas: | 9.9% (8,256) |
Number of households with income $125k - 150k:| Sabine: | 5.2% (702) |
| State: | 5.2% (4,355) |
Number of households with income $150k - 200k:| Sabine: | 6.7% (906) |
| State: | 6.7% (5,623) |
Number of households with income > $200k:| Sabine: | 6.6% (890) |
| State: | 6.6% (5,522) |
Aggregate household income in Sabine in 2022: $146,772
Median per capita income in Sabine in 2022:| Sabine: | $12,739 |
| State: | $28,166 |
Change in median per capita income between 2000 and 2022:| Sabine, Texas: | +33.5% |
| Texas: | +77.2% |
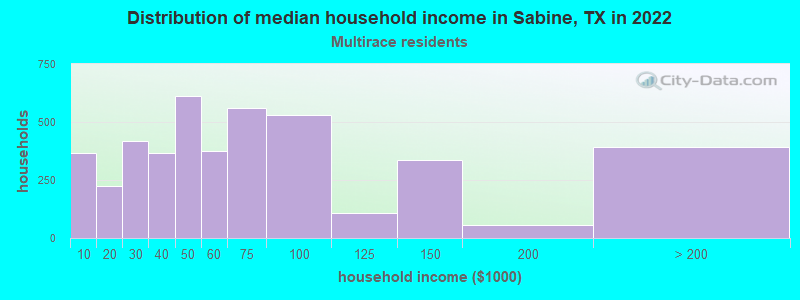
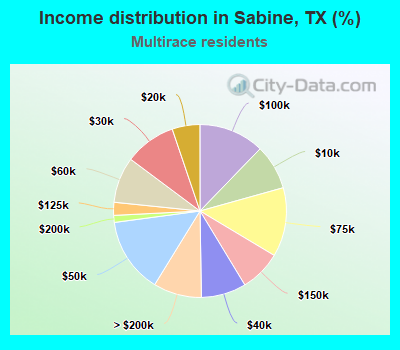
Income statistics for Multirace residents
Median household income in Sabine, TX in 2022:| Sabine: | $42,141 |
| State: | $62,748 |
Change in median household income between 2000 and 2022:| Sabine, Texas: | +126.9% |
| Texas: | +92.3% |
Number of households with income < $10k:| Sabine: | 8.4% (367) |
| Texas: | 5.5% (122,324) |
Number of households with income $10k - 20k:| Sabine: | 5.2% (226) |
| Texas: | 8.2% (182,232) |
Number of households with income $20k - 30k:| Sabine: | 9.6% (417) |
| State: | 8.5% (189,456) |
Number of households with income $30k - 40k:| Sabine: | 8.4% (366) |
| State: | 8.9% (197,499) |
Number of households with income $40k - 50k:| Sabine: | 14.1% (613) |
| State: | 8.7% (191,735) |
Number of households with income $50k - 60k:| Sabine: | 8.6% (373) |
| State: | 8.0% (177,535) |
Number of households with income $60k - 75k:| Sabine: | 12.9% (562) |
| State: | 10.5% (232,479) |
Number of households with income $75k - 100k:| Sabine: | 12.2% (532) |
| State: | 13.1% (290,448) |
Number of households with income $100k - 125k:| Sabine: | 2.4% (106) |
| Texas: | 8.6% (191,595) |
Number of households with income $125k - 150k:| Sabine: | 7.7% (336) |
| Texas: | 6.0% (133,361) |
Number of households with income $150k - 200k:| Sabine: | 1.3% (57) |
| State: | 7.2% (159,195) |
Number of households with income > $200k:| Sabine: | 9.0% (393) |
| Texas: | 6.7% (148,064) |
Aggregate household income in Sabine in 2022: $9,345,115
Median family income in Sabine in 2022:| Sabine: | $39,956 |
| State: | $69,780 |
Number of families with income $20k - 30k:| Sabine: | 100.0% (69) |
| State: | 7.8% (126,627) |
Median non-family income in Sabine in 2022:| Sabine: | $18,201 |
| State: | $40,634 |
Change in median non-family income between 2000 and 2022:| Sabine, Texas: | +93.2% |
| State: | +77.2% |
Median per capita income in Sabine in 2022:| Sabine: | $9,781 |
| State: | $26,785 |
Change in median per capita income between 2000 and 2022:| Sabine, Texas: | +36.9% |
| State: | +110.9% |
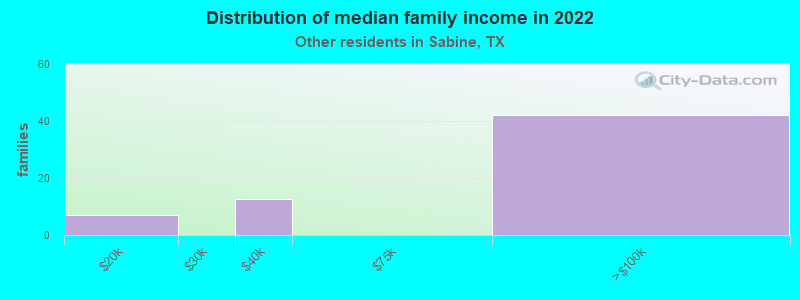
Income statistics for other residents
Number of households with income < $10k:| Sabine: | 6.0% (20) |
| State: | 5.9% (54,162) |
Number of households with income $10k - 20k:| Sabine: | 6.9% (23) |
| State: | 6.8% (62,891) |
Number of households with income $20k - 30k:| Sabine: | 10.5% (35) |
| State: | 10.6% (97,294) |
Number of households with income $30k - 40k:| Sabine: | 10.8% (36) |
| State: | 10.8% (99,670) |
Number of households with income $40k - 50k:| Sabine: | 9.3% (31) |
| Texas: | 9.3% (85,548) |
Number of households with income $50k - 60k:| Sabine: | 9.0% (30) |
| State: | 9.0% (82,757) |
Number of households with income $60k - 75k:| Sabine: | 11.1% (37) |
| State: | 10.9% (100,326) |
Number of households with income $75k - 100k:| Sabine: | 14.1% (47) |
| State: | 14.0% (128,767) |
Number of households with income $100k - 125k:| Sabine: | 8.1% (27) |
| Texas: | 8.2% (75,218) |
Number of households with income $125k - 150k:| Sabine: | 4.8% (16) |
| State: | 4.8% (44,223) |
Number of households with income $150k - 200k:| Sabine: | 5.7% (19) |
| State: | 5.6% (51,376) |
Number of households with income > $200k:| Sabine: | 3.9% (13) |
| Texas: | 4.0% (36,393) |
Aggregate household income in Sabine in 2022: $1,483,196
Median family income in Sabine in 2022:| Sabine: | $74,559 |
| Texas: | $60,064 |
Number of families with income $10k - 20k:| Sabine: | 11.4% (7) |
| Texas: | 6.0% (41,763) |
Number of families with income $30k - 40k:| Sabine: | 20.3% (12) |
| State: | 9.7% (67,685) |
Number of families with income $75k - 100k:| Sabine: | 68.3% (42) |
| Texas: | 14.5% (101,032) |
Median per capita income in Sabine in 2022:| Sabine: | $21,565 |
| Texas: | $23,899 |