The median household income in Sarita, TX in 2022 was $46,089, which was 56.8% less than the median annual income of $72,284 across the entire state of Texas. Compared to the median income of $25,000 in 2000 this represents an increase of 45.8%. The per capita income in 2022 was $34,878, which means an increase of 48.5% compared to 2000 when it was $17,959.
Income statistics for all residents
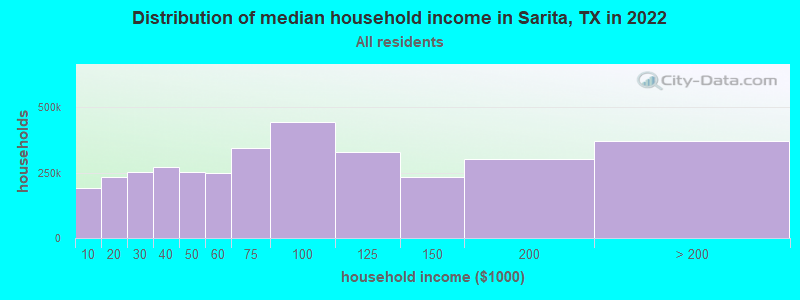
Median household income in Sarita, TX in 2022:
Sarita:
$46,090
Texas:
$72,284
Change in median household income between 2000 and 2022:
Sarita, Texas:
+84.4%
Texas:
+81.0%
Number of households with income < $10k:
Sarita:
5.5% (191,186)
State:
5.5% (611,011)
Number of households with income $10k - 20k:
Sarita:
6.7% (232,654)
Texas:
6.7% (743,157)
Number of households with income $20k - 30k:
Sarita:
7.2% (251,516)
State:
7.2% (803,381)
Number of households with income $30k - 40k:
Sarita:
7.8% (271,115)
State:
7.8% (866,080)
Number of households with income $40k - 50k:
Sarita:
7.3% (253,707)
Texas:
7.3% (810,440)
Number of households with income $50k - 60k:
Sarita:
7.2% (250,338)
State:
7.2% (799,783)
Number of households with income $60k - 75k:
Sarita:
9.9% (342,880)
State:
9.9% (1,095,384)
Number of households with income $75k - 100k:
Sarita:
12.8% (444,318)
State:
12.8% (1,419,057)
Number of households with income $100k - 125k:
Sarita:
9.5% (330,230)
State:
9.5% (1,054,577)
Number of households with income $125k - 150k:
Sarita:
6.7% (232,257)
State:
6.7% (741,518)
Number of households with income $150k - 200k:
Sarita:
8.7% (301,077)
State:
8.7% (961,776)
Number of households with income > $200k:
Sarita:
10.7% (369,722)
State:
10.7% (1,181,544)
Aggregate household income in Sarita in 2022: $1,724,323,286
Median family income in Sarita in 2022:
Sarita:
$50,812
Texas:
$86,267
Median non-family income in Sarita in 2022:
Sarita:
$28,547
State:
$45,999
Change in median non-family income between 2000 and 2022:
Sarita, Texas:
+85.2%
State:
+79.5%
Median per capita income in Sarita in 2022:
Sarita:
$34,878
State:
$38,123
Change in median per capita income between 2000 and 2022:
Sarita, Texas:
+94.2%
State:
+94.3%
Income statistics for White residents
Median household income in Sarita, TX in 2022:
Sarita:
$59,972
State:
$82,032
Change in median household income between 2000 and 2022:
Sarita, Texas:
+90.4%
State:
+91.0%
Number of households with income < $10k:
Sarita:
4.7% (100,083)
State:
4.7% (273,716)
Number of households with income $10k - 20k:
Sarita:
5.5% (118,211)
Texas:
5.5% (322,702)
Number of households with income $20k - 30k:
Sarita:
6.2% (133,392)
Texas:
6.2% (363,947)
Number of households with income $30k - 40k:
Sarita:
6.8% (146,215)
State:
6.8% (399,275)
Number of households with income $40k - 50k:
Sarita:
6.5% (140,357)
Texas:
6.5% (383,417)
Number of households with income $50k - 60k:
Sarita:
6.6% (142,204)
Texas:
6.6% (388,535)
Number of households with income $60k - 75k:
Sarita:
9.6% (206,992)
State:
9.7% (566,295)
Number of households with income $75k - 100k:
Sarita:
13.0% (278,162)
State:
13.0% (760,276)
Number of households with income $100k - 125k:
Sarita:
10.2% (218,646)
State:
10.2% (597,596)
Number of households with income $125k - 150k:
Sarita:
7.4% (159,781)
Texas:
7.4% (436,830)
Number of households with income $150k - 200k:
Sarita:
9.9% (213,102)
State:
9.9% (583,067)
Number of households with income > $200k:
Sarita:
13.5% (288,944)
State:
13.5% (792,647)
Aggregate household income in Sarita in 2022: $855,428,414
Median family income in Sarita in 2022:
Sarita:
$62,179
Texas:
$101,788
Number of families with income < $10k:
Sarita:
0.9% (1)
Texas:
2.8% (108,142)
Number of families with income $10k - 20k:
Sarita:
3.7% (2)
Texas:
2.9% (113,421)
Number of families with income $20k - 30k:
Sarita:
14.5% (9)
Texas:
4.1% (157,688)
Number of families with income $30k - 40k:
Sarita:
9.4% (6)
State:
5.2% (198,847)
Number of families with income $40k - 50k:
Sarita:
6.9% (4)
State:
5.6% (216,490)
Number of families with income $50k - 60k:
Sarita:
2.0% (1)
State:
5.7% (220,689)
Number of families with income $60k - 75k:
Sarita:
10.2% (6)
State:
9.0% (346,106)
Number of families with income $75k - 100k:
Sarita:
1.9% (1)
State:
13.7% (527,363)
Number of families with income > $200k:
Sarita:
50.5% (31)
State:
17.6% (677,490)
Median non-family income in Sarita in 2022:
Sarita:
$29,423
Texas:
$50,587
Change in median non-family income between 2000 and 2022:
Sarita, Texas:
+85.8%
State:
+87.7%
Median per capita income in Sarita in 2022:
Sarita:
$49,599
State:
$47,740
Change in median per capita income between 2000 and 2022:
Sarita, Texas:
+112.1%
Texas:
+114.3%
Income statistics for Black or African American residents
Number of households with income < $10k:
Sarita:
8.9% (44,168)
State:
8.9% (126,378)
Number of households with income $10k - 20k:
Sarita:
9.9% (49,282)
State:
9.9% (140,369)
Number of households with income $20k - 30k:
Sarita:
8.5% (42,386)
State:
8.5% (120,639)
Number of households with income $30k - 40k:
Sarita:
9.7% (48,041)
State:
9.7% (137,517)
Number of households with income $40k - 50k:
Sarita:
7.9% (39,467)
State:
8.0% (112,973)
Number of households with income $50k - 60k:
Sarita:
8.2% (40,905)
Texas:
8.3% (117,156)
Number of households with income $60k - 75k:
Sarita:
10.4% (51,591)
State:
10.4% (147,462)
Number of households with income $75k - 100k:
Sarita:
11.5% (56,954)
State:
11.5% (162,718)
Number of households with income $100k - 125k:
Sarita:
8.1% (40,470)
State:
8.2% (115,829)
Number of households with income $125k - 150k:
Sarita:
4.9% (24,456)
State:
4.9% (69,556)
Number of households with income $150k - 200k:
Sarita:
6.4% (31,740)
State:
6.4% (90,701)
Number of households with income > $200k:
Sarita:
5.5% (27,276)
State:
5.5% (77,988)
Median per capita income in Sarita in 2022:
Sarita:
$21,625
State:
$30,490
Change in median per capita income between 2000 and 2022:
Sarita, Texas:
+116.3%
State:
+113.9%
Income statistics for Hispanic or Latino residents
Median household income in Sarita, TX in 2022:
Sarita:
$47,606
Texas:
$60,504
Change in median household income between 2000 and 2022:
Sarita, Texas:
+112.9%
Texas:
+102.5%
Number of households with income < $10k:
Sarita:
5.8% (80,164)
State:
5.8% (213,953)
Number of households with income $10k - 20k:
Sarita:
8.0% (111,490)
Texas:
8.0% (297,456)
Number of households with income $20k - 30k:
Sarita:
9.2% (127,384)
State:
9.2% (340,166)
Number of households with income $30k - 40k:
Sarita:
9.5% (132,812)
State:
9.5% (354,336)
Number of households with income $40k - 50k:
Sarita:
8.8% (122,487)
State:
8.8% (327,013)
Number of households with income $50k - 60k:
Sarita:
8.3% (115,604)
Texas:
8.3% (308,818)
Number of households with income $60k - 75k:
Sarita:
10.9% (151,783)
Texas:
10.9% (405,109)
Number of households with income $75k - 100k:
Sarita:
13.8% (191,782)
State:
13.8% (511,639)
Number of households with income $100k - 125k:
Sarita:
8.6% (119,855)
State:
8.6% (319,728)
Number of households with income $125k - 150k:
Sarita:
5.7% (79,139)
State:
5.7% (210,932)
Number of households with income $150k - 200k:
Sarita:
6.4% (88,384)
State:
6.4% (236,055)
Number of households with income > $200k:
Sarita:
5.1% (70,960)
Texas:
5.1% (189,259)
Aggregate household income in Sarita in 2022: $213,536,591
Median family income in Sarita in 2022:
Sarita:
$52,479
State:
$65,080
Number of families with income $20k - 30k:
Sarita:
7.8% (1)
Texas:
8.6% (238,528)
Number of families with income $30k - 40k:
Sarita:
18.6% (3)
State:
9.1% (251,999)
Number of families with income $40k - 50k:
Sarita:
7.1% (1)
State:
8.6% (240,188)
Number of families with income $50k - 60k:
Sarita:
7.0% (1)
State:
8.0% (223,566)
Number of families with income $60k - 75k:
Sarita:
19.1% (3)
State:
10.9% (302,688)
Number of families with income > $200k:
Sarita:
40.3% (7)
Texas:
5.9% (165,129)
Median non-family income in Sarita in 2022:
Sarita:
$38,643
State:
$39,934
Change in median non-family income between 2000 and 2022:
Sarita, Texas:
+120.8%
State:
+109.1%
Median per capita income in Sarita in 2022:
Sarita:
$23,634
State:
$24,862
Change in median per capita income between 2000 and 2022:
Sarita, Texas:
+128.5%
State:
+130.8%
Income statistics for Multirace residents
Median household income in Sarita, TX in 2022:
Sarita:
$71,752
Texas:
$62,748
Change in median household income between 2000 and 2022:
Sarita, Texas:
+97.9%
Texas:
+92.3%
Number of households with income < $10k:
Sarita:
5.5% (67,879)
Texas:
5.5% (122,324)
Number of households with income $10k - 20k:
Sarita:
8.2% (101,125)
State:
8.2% (182,232)
Number of households with income $20k - 30k:
Sarita:
8.5% (105,024)
Texas:
8.5% (189,456)
Number of households with income $30k - 40k:
Sarita:
8.9% (109,567)
State:
8.9% (197,499)
Number of households with income $40k - 50k:
Sarita:
8.7% (106,425)
State:
8.7% (191,735)
Number of households with income $50k - 60k:
Sarita:
8.0% (98,435)
State:
8.0% (177,535)
Number of households with income $60k - 75k:
Sarita:
10.5% (129,019)
State:
10.5% (232,479)
Number of households with income $75k - 100k:
Sarita:
13.1% (161,137)
State:
13.1% (290,448)
Number of households with income $100k - 125k:
Sarita:
8.7% (106,342)
Texas:
8.6% (191,595)
Number of households with income $125k - 150k:
Sarita:
6.0% (74,070)
State:
6.0% (133,361)
Number of households with income $150k - 200k:
Sarita:
7.2% (88,221)
State:
7.2% (159,195)
Number of households with income > $200k:
Sarita:
6.7% (82,139)
State:
6.7% (148,064)
Aggregate household income in Sarita in 2022: $1,871,060
Median family income in Sarita in 2022:
Sarita:
$71,410
State:
$69,780
Median per capita income in Sarita in 2022:
Sarita:
$6,252
Texas:
$26,785
Change in median per capita income between 2000 and 2022:
Sarita, Texas:
+108.4%
State:
+110.9%
Income statistics for other residents
Number of households with income < $10k:
Sarita:
5.7% (14)
State:
5.9% (54,162)
Number of households with income $10k - 20k:
Sarita:
6.6% (16)
Texas:
6.8% (62,891)
Number of households with income $20k - 30k:
Sarita:
10.7% (26)
State:
10.6% (97,294)
Number of households with income $30k - 40k:
Sarita:
10.7% (26)
State:
10.8% (99,670)
Number of households with income $40k - 50k:
Sarita:
9.4% (23)
Texas:
9.3% (85,548)
Number of households with income $50k - 60k:
Sarita:
9.0% (22)
Texas:
9.0% (82,757)
Number of households with income $60k - 75k:
Sarita:
11.1% (27)
State:
10.9% (100,326)
Number of households with income $75k - 100k:
Sarita:
13.9% (34)
State:
14.0% (128,767)
Number of households with income $100k - 125k:
Sarita:
8.2% (20)
Texas:
8.2% (75,218)
Number of households with income $125k - 150k:
Sarita:
4.9% (12)
Texas:
4.8% (44,223)
Number of households with income $150k - 200k:
Sarita:
5.7% (14)
State:
5.6% (51,376)
Number of households with income > $200k:
Sarita:
4.1% (10)
Texas:
4.0% (36,393)
Aggregate household income in Sarita in 2022: $17,915,426
Median family income in Sarita in 2022:
Sarita:
$43,274
State:
$60,064
Number of families with income < $10k:
Sarita:
11.9% (4)
Texas:
6.8% (47,502)
Number of families with income $10k - 20k:
Sarita:
18.4% (6)
Texas:
6.0% (41,763)
Number of families with income $20k - 30k:
Sarita:
12.1% (4)
State:
9.9% (68,761)
Number of families with income $30k - 40k:
Sarita:
15.4% (5)
Texas:
9.7% (67,685)
Number of families with income $40k - 50k:
Sarita:
16.4% (5)
State:
9.0% (62,441)
Number of families with income $75k - 100k:
Sarita:
25.8% (8)
Texas:
14.5% (101,032)
Median non-family income in Sarita in 2022:
Sarita:
$26,591
Texas:
$38,690
Change in median non-family income between 2000 and 2022:
Sarita, Texas:
+123.9%
State:
+90.2%
Median per capita income in Sarita in 2022:
Sarita:
$19,981
State:
$23,899
Change in median per capita income between 2000 and 2022:
Sarita, Texas:
+141.8%
State:
+135.2%
Discuss Sarita, Texas (TX) on our hugely popular Texas forum.