The median household income in Saylorsburg, PA in 2022 was $86,047, which was 16.6% greater than the median annual income of $71,798 across the entire state of Pennsylvania. Compared to the median income of $46,257 in 2000 this represents an increase of 46.2%. The per capita income in 2022 was $42,313, which means an increase of 52.7% compared to 2000 when it was $20,011.
Whole page based on the data from 2000 / 2022 when the population of Saylorsburg, Pennsylvania was 1,126 / 1,071
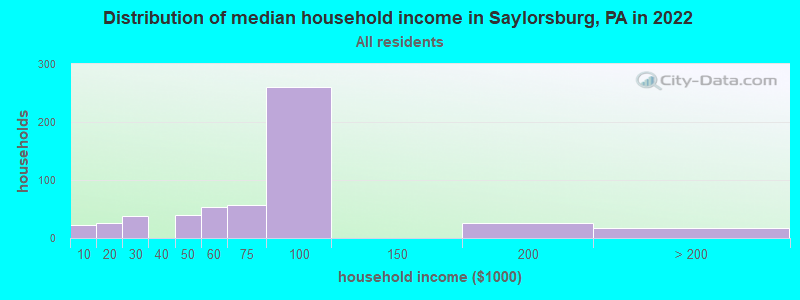
Income statistics for all residents
Median household income in Saylorsburg, PA in 2022:
Saylorsburg:
$86,048
Pennsylvania:
$71,798
Change in median household income between 2000 and 2022:
Saylorsburg, Pennsylvania:
+86.0%
Pennsylvania:
+79.0%
Number of households with income < $10k:
Saylorsburg:
4.2% (23)
State:
5.5% (291,562)
Number of households with income $10k - 20k:
Saylorsburg:
4.8% (26)
State:
7.3% (384,726)
Number of households with income $20k - 30k:
Saylorsburg:
7.0% (38)
Pennsylvania:
7.4% (389,464)
Number of households with income $30k - 40k:
Saylorsburg:
0.0% (0)
State:
7.6% (402,138)
Number of households with income $40k - 50k:
Saylorsburg:
7.4% (40)
Pennsylvania:
7.3% (387,945)
Number of households with income $50k - 60k:
Saylorsburg:
10.0% (54)
State:
7.0% (372,468)
Number of households with income $60k - 75k:
Saylorsburg:
10.5% (57)
State:
9.9% (524,786)
Number of households with income $75k - 100k:
Saylorsburg:
48.0% (260)
State:
12.6% (666,253)
Number of households with income $100k - 125k:
Saylorsburg:
0.0% (0)
State:
9.9% (526,402)
Number of households with income $125k - 150k:
Saylorsburg:
0.0% (0)
State:
6.9% (362,702)
Number of households with income $150k - 200k:
Saylorsburg:
4.8% (26)
Pennsylvania:
8.3% (440,827)
Number of households with income > $200k:
Saylorsburg:
3.3% (18)
Pennsylvania:
10.3% (544,792)
Aggregate household income in Saylorsburg in 2022: $41,187,451
Median family income in Saylorsburg in 2022:
Saylorsburg:
$72,359
Pennsylvania:
$93,029
Number of families with income $40k - 50k:
Saylorsburg:
27.0% (33)
State:
6.4% (211,380)
Number of families with income $60k - 75k:
Saylorsburg:
26.7% (32)
Pennsylvania:
9.7% (318,991)
Number of families with income $75k - 100k:
Saylorsburg:
11.4% (14)
State:
14.0% (461,021)
Number of families with income $150k - 200k:
Saylorsburg:
19.9% (24)
State:
11.2% (367,642)
Number of families with income > $200k:
Saylorsburg:
14.9% (18)
State:
14.3% (470,863)
Median income for families with 0 earners:
Saylorsburg:
$0
State:
$48,949
Median income for families with 1 earner:
Saylorsburg:
$46,114
Pennsylvania:
$64,277
Median income for families with 2 earners:
Saylorsburg:
$0
Pennsylvania:
$118,220
Median income for families with 3+ earners:
Saylorsburg:
$0
State:
$150,374
Median non-family income in Saylorsburg in 2022:
Saylorsburg:
$76,007
Pennsylvania:
$42,203
Median per capita income in Saylorsburg in 2022:
Saylorsburg:
$42,313
State:
$41,489
Change in median per capita income between 2000 and 2022:
Saylorsburg, Pennsylvania:
+111.5%
State:
+98.7%
Income statistics for White residents
Median household income in Saylorsburg, PA in 2022:
Saylorsburg:
$83,832
State:
$76,765
Change in median household income between 2000 and 2022:
Saylorsburg, Pennsylvania:
+84.4%
State:
+84.3%
Number of households with income < $10k:
Saylorsburg:
0.0% (0)
Pennsylvania:
4.3% (179,792)
Number of households with income $10k - 20k:
Saylorsburg:
6.8% (32)
State:
6.5% (268,738)
Number of households with income $20k - 30k:
Saylorsburg:
7.9% (37)
State:
7.0% (288,138)
Number of households with income $30k - 40k:
Saylorsburg:
0.0% (0)
State:
7.2% (300,208)
Number of households with income $40k - 50k:
Saylorsburg:
7.4% (35)
State:
7.2% (298,756)
Number of households with income $50k - 60k:
Saylorsburg:
9.6% (45)
State:
6.8% (283,251)
Number of households with income $60k - 75k:
Saylorsburg:
8.9% (42)
State:
9.9% (408,159)
Number of households with income $75k - 100k:
Saylorsburg:
50.0% (235)
State:
13.2% (547,809)
Number of households with income $100k - 125k:
Saylorsburg:
0.0% (0)
State:
10.5% (436,652)
Number of households with income $125k - 150k:
Saylorsburg:
0.0% (0)
State:
7.3% (304,132)
Number of households with income $150k - 200k:
Saylorsburg:
5.7% (27)
State:
9.0% (374,658)
Number of households with income > $200k:
Saylorsburg:
3.6% (17)
State:
10.9% (452,618)
Aggregate household income in Saylorsburg in 2022: $37,574,999
Median family income in Saylorsburg in 2022:
Saylorsburg:
$75,270
State:
$99,396
Number of families with income $40k - 50k:
Saylorsburg:
27.6% (29)
State:
6.0% (154,327)
Number of families with income $60k - 75k:
Saylorsburg:
20.6% (22)
State:
9.6% (249,292)
Number of families with income $75k - 100k:
Saylorsburg:
11.7% (12)
State:
14.7% (379,316)
Number of families with income $150k - 200k:
Saylorsburg:
23.7% (25)
State:
12.2% (314,926)
Number of families with income > $200k:
Saylorsburg:
16.4% (17)
Pennsylvania:
15.1% (390,885)
Median non-family income in Saylorsburg in 2022:
Saylorsburg:
$70,564
State:
$44,251
Median per capita income in Saylorsburg in 2022:
Saylorsburg:
$48,228
State:
$45,306
Change in median per capita income between 2000 and 2022:
Saylorsburg, Pennsylvania:
+138.0%
Pennsylvania:
+105.4%
Income statistics for Asian residents
Number of households with income < $10k:
Saylorsburg:
0.0% (0)
State:
5.8% (9,650)
Number of households with income $10k - 20k:
Saylorsburg:
0.0% (0)
State:
4.3% (7,158)
Number of households with income $20k - 30k:
Saylorsburg:
0.0% (0)
Pennsylvania:
5.7% (9,531)
Number of households with income $30k - 40k:
Saylorsburg:
0.0% (0)
State:
5.7% (9,580)
Number of households with income $40k - 50k:
Saylorsburg:
0.0% (0)
State:
5.4% (9,050)
Number of households with income $50k - 60k:
Saylorsburg:
0.0% (0)
Pennsylvania:
6.1% (10,189)
Number of households with income $60k - 75k:
Saylorsburg:
100.0% (14)
State:
7.8% (13,008)
Number of households with income $75k - 100k:
Saylorsburg:
0.0% (0)
Pennsylvania:
10.1% (16,923)
Number of households with income $100k - 125k:
Saylorsburg:
0.0% (0)
Pennsylvania:
8.8% (14,765)
Number of households with income $125k - 150k:
Saylorsburg:
0.0% (0)
Pennsylvania:
7.5% (12,634)
Number of households with income $150k - 200k:
Saylorsburg:
0.0% (0)
State:
10.0% (16,823)
Number of households with income > $200k:
Saylorsburg:
0.0% (0)
State:
22.9% (38,426)
Aggregate household income in Saylorsburg in 2022: $98,133,200
Median per capita income in Saylorsburg in 2022:
Saylorsburg:
$28,728
State:
$48,341
Change in median per capita income between 2000 and 2022:
Saylorsburg, Pennsylvania:
+0.7%
State:
+140.6%
Income statistics for Hispanic or Latino residents
Median household income in Saylorsburg, PA in 2022:
Saylorsburg:
$84,936
State:
$55,478
Change in median household income between 2000 and 2022:
Saylorsburg, Pennsylvania:
+57.2%
State:
+106.0%
Number of households with income < $10k:
Saylorsburg:
9.8% (19)
State:
8.7% (29,517)
Number of households with income $10k - 20k:
Saylorsburg:
0.0% (0)
State:
10.0% (33,785)
Number of households with income $20k - 30k:
Saylorsburg:
13.5% (26)
State:
9.9% (33,399)
Number of households with income $30k - 40k:
Saylorsburg:
0.0% (0)
State:
8.8% (29,878)
Number of households with income $40k - 50k:
Saylorsburg:
0.0% (0)
State:
8.5% (28,549)
Number of households with income $50k - 60k:
Saylorsburg:
0.0% (0)
Pennsylvania:
7.6% (25,792)
Number of households with income $60k - 75k:
Saylorsburg:
0.0% (0)
Pennsylvania:
10.6% (35,808)
Number of households with income $75k - 100k:
Saylorsburg:
76.7% (148)
Pennsylvania:
11.9% (40,287)
Number of households with income $100k - 125k:
Saylorsburg:
0.0% (0)
State:
8.0% (27,028)
Number of households with income $125k - 150k:
Saylorsburg:
0.0% (0)
State:
5.2% (17,622)
Number of households with income $150k - 200k:
Saylorsburg:
0.0% (0)
State:
5.2% (17,563)
Number of households with income > $200k:
Saylorsburg:
0.0% (0)
State:
5.5% (18,469)
Aggregate household income in Saylorsburg in 2022: $23,731,700
Median non-family income in Saylorsburg in 2022:
Saylorsburg:
$88,529
State:
$34,664
Median per capita income in Saylorsburg in 2022:
Saylorsburg:
$71,136
State:
$23,829
Income statistics for Multirace residents
Number of households with income < $10k:
Saylorsburg:
100.0% (28)
Pennsylvania:
7.8% (21,911)
Number of households with income $10k - 20k:
Saylorsburg:
0.0% (0)
Pennsylvania:
8.2% (22,847)
Number of households with income $20k - 30k:
Saylorsburg:
0.0% (0)
State:
8.7% (24,252)
Number of households with income $30k - 40k:
Saylorsburg:
0.0% (0)
Pennsylvania:
7.3% (20,502)
Number of households with income $40k - 50k:
Saylorsburg:
0.0% (0)
State:
7.7% (21,525)
Number of households with income $50k - 60k:
Saylorsburg:
0.0% (0)
State:
8.6% (24,174)
Number of households with income $60k - 75k:
Saylorsburg:
0.0% (0)
State:
11.9% (33,350)
Number of households with income $75k - 100k:
Saylorsburg:
0.0% (0)
Pennsylvania:
11.5% (32,274)
Number of households with income $100k - 125k:
Saylorsburg:
0.0% (0)
Pennsylvania:
8.3% (23,361)
Number of households with income $125k - 150k:
Saylorsburg:
0.0% (0)
State:
5.3% (14,784)
Number of households with income $150k - 200k:
Saylorsburg:
0.0% (0)
State:
6.9% (19,314)
Number of households with income > $200k:
Saylorsburg:
0.0% (0)
Pennsylvania:
7.8% (21,759)
Aggregate household income in Saylorsburg in 2022: $621,355,900
Median per capita income in Saylorsburg in 2022:
Saylorsburg:
$44,664
State:
$27,581
Discuss Saylorsburg, Pennsylvania (PA) on our hugely popular Pennsylvania forum.