Selby-on-the-Bay, Maryland (MD) income map, earnings map, and wages data
The median household income in Selby-on-the-Bay, MD in 2022 was $121,749, which was 22.0% greater than the median annual income of $94,991 across the entire state of Maryland. Compared to the median income of $66,477 in 2000 this represents an increase of 45.4%. The per capita income in 2022 was $59,415, which means an increase of 50.6% compared to 2000 when it was $29,356.
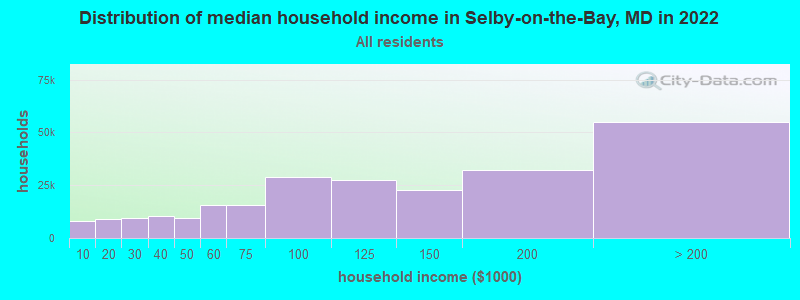
Income statistics for all residents
Median household income in Selby-on-the-Bay, MD in 2022:| Selby-on-the-Bay: | $121,749 |
| State: | $94,991 |
Change in median household income between 2000 and 2022:| Selby-on-the-Bay, Maryland: | +83.1% |
| State: | +79.7% |
Number of households with income < $10k:| Selby-on-the-Bay: | 3.2% (7,847) |
| Maryland: | 4.8% (114,450) |
Number of households with income $10k - 20k:| Selby-on-the-Bay: | 3.8% (9,158) |
| State: | 5.0% (117,883) |
Number of households with income $20k - 30k:| Selby-on-the-Bay: | 3.9% (9,505) |
| Maryland: | 5.2% (123,350) |
Number of households with income $30k - 40k:| Selby-on-the-Bay: | 4.3% (10,489) |
| State: | 5.6% (134,104) |
Number of households with income $40k - 50k:| Selby-on-the-Bay: | 3.9% (9,401) |
| State: | 5.6% (132,932) |
Number of households with income $50k - 60k:| Selby-on-the-Bay: | 6.3% (15,448) |
| Maryland: | 5.6% (132,707) |
Number of households with income $60k - 75k:| Selby-on-the-Bay: | 6.4% (15,581) |
| State: | 7.9% (188,335) |
Number of households with income $75k - 100k:| Selby-on-the-Bay: | 11.9% (28,909) |
| Maryland: | 12.5% (297,873) |
Number of households with income $100k - 125k:| Selby-on-the-Bay: | 11.3% (27,411) |
| Maryland: | 10.5% (250,497) |
Number of households with income $125k - 150k:| Selby-on-the-Bay: | 9.4% (22,882) |
| State: | 8.1% (193,208) |
Number of households with income $150k - 200k:| Selby-on-the-Bay: | 13.1% (31,992) |
| State: | 11.6% (274,905) |
Number of households with income > $200k:| Selby-on-the-Bay: | 22.5% (54,914) |
| State: | 17.5% (415,740) |
Aggregate household income in Selby-on-the-Bay in 2022: $1,661,898,438
Median family income in Selby-on-the-Bay in 2022:| Selby-on-the-Bay: | $140,849 |
| State: | $117,294 |
Median non-family income in Selby-on-the-Bay in 2022:| Selby-on-the-Bay: | $85,872 |
| Maryland: | $57,179 |
Change in median non-family income between 2000 and 2022:| Selby-on-the-Bay, Maryland: | +71.1% |
| Maryland: | +75.1% |
Median per capita income in Selby-on-the-Bay in 2022:| Selby-on-the-Bay: | $59,416 |
| State: | $49,236 |
Change in median per capita income between 2000 and 2022:| Selby-on-the-Bay, Maryland: | +102.4% |
| State: | +92.2% |
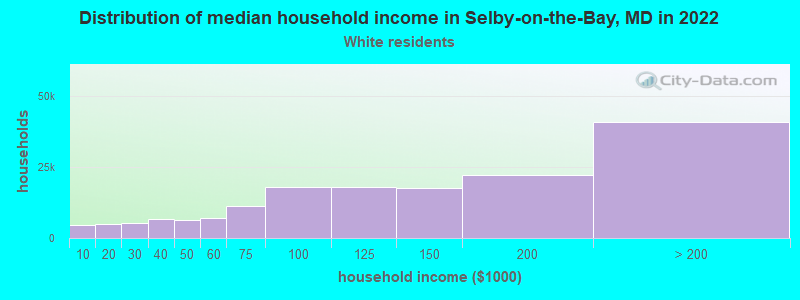
Income statistics for White residents
Median household income in Selby-on-the-Bay, MD in 2022:| Selby-on-the-Bay: | $129,614 |
| State: | $107,160 |
Change in median household income between 2000 and 2022:| Selby-on-the-Bay, Maryland: | +92.5% |
| State: | +85.3% |
Number of households with income < $10k:| Selby-on-the-Bay: | 2.9% (4,677) |
| State: | 3.7% (47,387) |
Number of households with income $10k - 20k:| Selby-on-the-Bay: | 3.0% (4,812) |
| State: | 4.1% (52,102) |
Number of households with income $20k - 30k:| Selby-on-the-Bay: | 3.3% (5,408) |
| State: | 4.6% (58,758) |
Number of households with income $30k - 40k:| Selby-on-the-Bay: | 4.1% (6,597) |
| State: | 4.7% (59,745) |
Number of households with income $40k - 50k:| Selby-on-the-Bay: | 4.0% (6,495) |
| State: | 5.0% (62,576) |
Number of households with income $50k - 60k:| Selby-on-the-Bay: | 4.4% (7,124) |
| State: | 5.1% (64,484) |
Number of households with income $60k - 75k:| Selby-on-the-Bay: | 6.8% (11,148) |
| State: | 7.7% (97,019) |
Number of households with income $75k - 100k:| Selby-on-the-Bay: | 11.0% (17,921) |
| Maryland: | 11.8% (149,205) |
Number of households with income $100k - 125k:| Selby-on-the-Bay: | 11.0% (17,900) |
| Maryland: | 10.6% (134,231) |
Number of households with income $125k - 150k:| Selby-on-the-Bay: | 10.8% (17,575) |
| Maryland: | 8.8% (111,081) |
Number of households with income $150k - 200k:| Selby-on-the-Bay: | 13.6% (22,160) |
| State: | 12.9% (162,966) |
Number of households with income > $200k:| Selby-on-the-Bay: | 25.2% (40,938) |
| Maryland: | 20.9% (264,377) |
Aggregate household income in Selby-on-the-Bay in 2022: $1,196,143,031
Median family income in Selby-on-the-Bay in 2022:| Selby-on-the-Bay: | $148,162 |
| State: | $134,708 |
Number of families with income < $10k:| Selby-on-the-Bay: | 0.8% (7) |
| State: | 1.6% (13,064) |
Number of families with income $10k - 20k:| Selby-on-the-Bay: | 2.3% (19) |
| State: | 2.0% (16,048) |
Number of families with income $20k - 30k:| Selby-on-the-Bay: | 3.6% (31) |
| State: | 2.2% (18,018) |
Number of families with income $30k - 40k:| Selby-on-the-Bay: | 2.1% (18) |
| Maryland: | 3.3% (26,886) |
Number of families with income $40k - 50k:| Selby-on-the-Bay: | 3.3% (28) |
| State: | 3.6% (29,194) |
Number of families with income $50k - 60k:| Selby-on-the-Bay: | 2.4% (20) |
| State: | 4.1% (33,120) |
Number of families with income $60k - 75k:| Selby-on-the-Bay: | 5.6% (48) |
| State: | 6.6% (53,501) |
Number of families with income $75k - 100k:| Selby-on-the-Bay: | 10.4% (89) |
| State: | 11.3% (91,779) |
Number of families with income $100k - 125k:| Selby-on-the-Bay: | 15.3% (131) |
| State: | 11.3% (91,483) |
Number of families with income $125k - 150k:| Selby-on-the-Bay: | 13.7% (117) |
| Maryland: | 9.9% (80,832) |
Number of families with income $150k - 200k:| Selby-on-the-Bay: | 17.5% (150) |
| Maryland: | 16.0% (130,295) |
Number of families with income > $200k:| Selby-on-the-Bay: | 23.1% (197) |
| State: | 28.1% (228,324) |
Median non-family income in Selby-on-the-Bay in 2022:| Selby-on-the-Bay: | $88,654 |
| Maryland: | $61,991 |
Change in median non-family income between 2000 and 2022:| Selby-on-the-Bay, Maryland: | +76.2% |
| State: | +76.8% |
Median per capita income in Selby-on-the-Bay in 2022:| Selby-on-the-Bay: | $64,851 |
| State: | $59,750 |
Change in median per capita income between 2000 and 2022:| Selby-on-the-Bay, Maryland: | +117.7% |
| Maryland: | +104.5% |
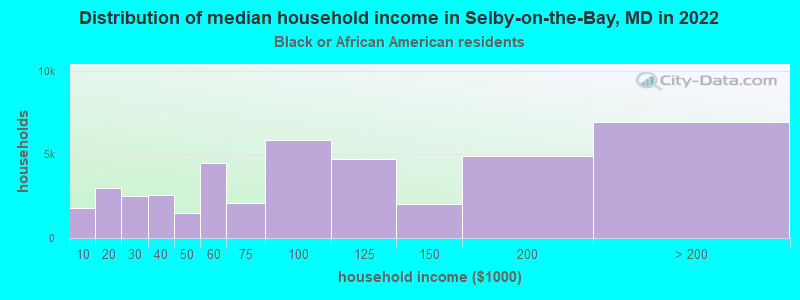
Income statistics for Black or African American residents
Median household income in Selby-on-the-Bay, MD in 2022:| Selby-on-the-Bay: | $85,408 |
| State: | $77,368 |
Change in median household income between 2000 and 2022:| Selby-on-the-Bay, Maryland: | +82.8% |
| State: | +85.7% |
Number of households with income < $10k:| Selby-on-the-Bay: | 4.2% (1,785) |
| State: | 7.0% (50,093) |
Number of households with income $10k - 20k:| Selby-on-the-Bay: | 7.0% (2,970) |
| State: | 7.2% (51,849) |
Number of households with income $20k - 30k:| Selby-on-the-Bay: | 6.0% (2,532) |
| State: | 5.8% (41,510) |
Number of households with income $30k - 40k:| Selby-on-the-Bay: | 6.1% (2,601) |
| State: | 6.9% (49,466) |
Number of households with income $40k - 50k:| Selby-on-the-Bay: | 3.5% (1,503) |
| State: | 6.6% (47,557) |
Number of households with income $50k - 60k:| Selby-on-the-Bay: | 10.6% (4,486) |
| State: | 6.2% (44,818) |
Number of households with income $60k - 75k:| Selby-on-the-Bay: | 4.9% (2,077) |
| State: | 8.6% (61,728) |
Number of households with income $75k - 100k:| Selby-on-the-Bay: | 13.8% (5,838) |
| State: | 13.2% (95,107) |
Number of households with income $100k - 125k:| Selby-on-the-Bay: | 11.2% (4,741) |
| State: | 10.2% (73,579) |
Number of households with income $125k - 150k:| Selby-on-the-Bay: | 4.8% (2,033) |
| Maryland: | 7.2% (51,970) |
Number of households with income $150k - 200k:| Selby-on-the-Bay: | 11.6% (4,922) |
| State: | 9.4% (67,623) |
Number of households with income > $200k:| Selby-on-the-Bay: | 16.4% (6,944) |
| State: | 11.7% (83,862) |
Aggregate household income in Selby-on-the-Bay in 2022: $9,944,252
Median family income in Selby-on-the-Bay in 2022:| Selby-on-the-Bay: | $81,828 |
| State: | $96,241 |
Number of families with income $30k - 40k:| Selby-on-the-Bay: | 74.6% (15) |
| State: | 6.1% (26,770) |
Number of families with income $40k - 50k:| Selby-on-the-Bay: | 25.4% (5) |
| State: | 6.2% (27,138) |
Median non-family income in Selby-on-the-Bay in 2022:| Selby-on-the-Bay: | $103,762 |
| Maryland: | $49,944 |
Change in median non-family income between 2000 and 2022:| Selby-on-the-Bay, Maryland: | +71.6% |
| Maryland: | +71.8% |
Median per capita income in Selby-on-the-Bay in 2022:| Selby-on-the-Bay: | $47,352 |
| Maryland: | $40,756 |
Change in median per capita income between 2000 and 2022:| Selby-on-the-Bay, Maryland: | +133.3% |
| Maryland: | +113.5% |
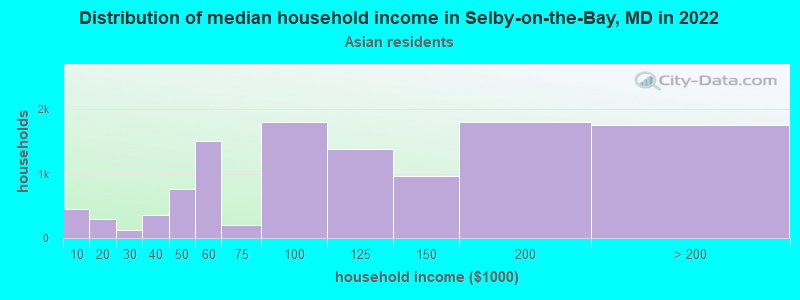
Income statistics for Asian residents
Median household income in Selby-on-the-Bay, MD in 2022:| Selby-on-the-Bay: | $140,204 |
| State: | $117,771 |
Change in median household income between 2000 and 2022:| Selby-on-the-Bay, Maryland: | +99.8% |
| Maryland: | +97.6% |
Number of households with income < $10k:| Selby-on-the-Bay: | 3.9% (448) |
| State: | 4.6% (6,395) |
Number of households with income $10k - 20k:| Selby-on-the-Bay: | 2.6% (295) |
| Maryland: | 3.6% (4,994) |
Number of households with income $20k - 30k:| Selby-on-the-Bay: | 1.1% (120) |
| Maryland: | 4.6% (6,399) |
Number of households with income $30k - 40k:| Selby-on-the-Bay: | 3.2% (363) |
| State: | 3.4% (4,682) |
Number of households with income $40k - 50k:| Selby-on-the-Bay: | 6.7% (760) |
| State: | 4.6% (6,382) |
Number of households with income $50k - 60k:| Selby-on-the-Bay: | 13.3% (1,514) |
| State: | 4.6% (6,402) |
Number of households with income $60k - 75k:| Selby-on-the-Bay: | 1.7% (199) |
| State: | 5.4% (7,426) |
Number of households with income $75k - 100k:| Selby-on-the-Bay: | 15.8% (1,802) |
| State: | 11.1% (15,313) |
Number of households with income $100k - 125k:| Selby-on-the-Bay: | 12.1% (1,383) |
| State: | 10.6% (14,640) |
Number of households with income $125k - 150k:| Selby-on-the-Bay: | 8.4% (958) |
| State: | 8.3% (11,465) |
Number of households with income $150k - 200k:| Selby-on-the-Bay: | 15.8% (1,795) |
| State: | 13.4% (18,490) |
Number of households with income > $200k:| Selby-on-the-Bay: | 15.4% (1,759) |
| State: | 25.6% (35,377) |
Aggregate household income in Selby-on-the-Bay in 2022: $4,288,829
Median family income in Selby-on-the-Bay in 2022:| Selby-on-the-Bay: | $147,216 |
| State: | $137,857 |
Number of families with income $60k - 75k:| Selby-on-the-Bay: | 100.0% (12) |
| State: | 4.5% (4,749) |
Median per capita income in Selby-on-the-Bay in 2022:| Selby-on-the-Bay: | $58,368 |
| State: | $53,546 |
Change in median per capita income between 2000 and 2022:| Selby-on-the-Bay, Maryland: | +118.1% |
| Maryland: | +122.9% |
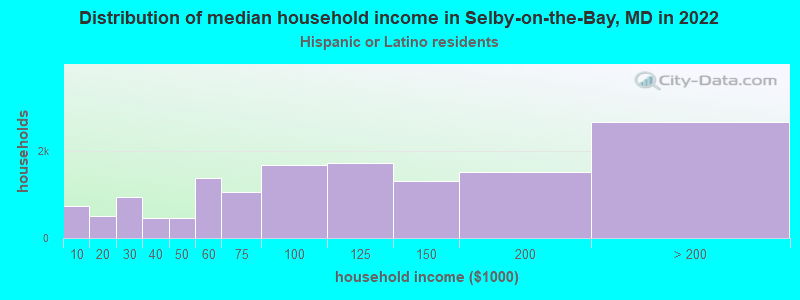
Income statistics for Hispanic or Latino residents
Median household income in Selby-on-the-Bay, MD in 2022:| Selby-on-the-Bay: | $103,739 |
| State: | $82,138 |
Change in median household income between 2000 and 2022:| Selby-on-the-Bay, Maryland: | +72.9% |
| Maryland: | +70.2% |
Number of households with income < $10k:| Selby-on-the-Bay: | 5.1% (729) |
| State: | 3.7% (6,871) |
Number of households with income $10k - 20k:| Selby-on-the-Bay: | 3.6% (514) |
| Maryland: | 2.9% (5,465) |
Number of households with income $20k - 30k:| Selby-on-the-Bay: | 6.5% (936) |
| Maryland: | 5.9% (11,012) |
Number of households with income $30k - 40k:| Selby-on-the-Bay: | 3.2% (464) |
| State: | 7.9% (14,668) |
Number of households with income $40k - 50k:| Selby-on-the-Bay: | 3.2% (455) |
| State: | 7.6% (14,074) |
Number of households with income $50k - 60k:| Selby-on-the-Bay: | 9.6% (1,382) |
| State: | 7.6% (14,166) |
Number of households with income $60k - 75k:| Selby-on-the-Bay: | 7.4% (1,058) |
| State: | 9.9% (18,486) |
Number of households with income $75k - 100k:| Selby-on-the-Bay: | 11.6% (1,673) |
| State: | 16.1% (30,032) |
Number of households with income $100k - 125k:| Selby-on-the-Bay: | 11.9% (1,711) |
| State: | 9.4% (17,432) |
Number of households with income $125k - 150k:| Selby-on-the-Bay: | 9.0% (1,299) |
| State: | 7.5% (13,963) |
Number of households with income $150k - 200k:| Selby-on-the-Bay: | 10.5% (1,504) |
| State: | 10.1% (18,750) |
Number of households with income > $200k:| Selby-on-the-Bay: | 18.5% (2,660) |
| Maryland: | 11.4% (21,133) |
Aggregate household income in Selby-on-the-Bay in 2022: $6,929,649
Median family income in Selby-on-the-Bay in 2022:| Selby-on-the-Bay: | $167,403 |
| Maryland: | $80,127 |
Number of families with income < $10k:| Selby-on-the-Bay: | 3.0% (3) |
| Maryland: | 3.1% (4,499) |
Number of families with income $10k - 20k:| Selby-on-the-Bay: | 4.2% (4) |
| State: | 2.2% (3,250) |
Number of families with income $20k - 30k:| Selby-on-the-Bay: | 13.8% (13) |
| State: | 6.8% (10,000) |
Number of families with income $30k - 40k:| Selby-on-the-Bay: | 1.5% (1) |
| State: | 7.6% (11,123) |
Number of families with income $40k - 50k:| Selby-on-the-Bay: | 2.7% (3) |
| State: | 8.1% (11,900) |
Number of families with income $50k - 60k:| Selby-on-the-Bay: | 7.0% (7) |
| Maryland: | 8.5% (12,561) |
Number of families with income $60k - 75k:| Selby-on-the-Bay: | 9.3% (9) |
| State: | 10.2% (15,051) |
Number of families with income $75k - 100k:| Selby-on-the-Bay: | 11.8% (11) |
| State: | 14.6% (21,440) |
Number of families with income $100k - 125k:| Selby-on-the-Bay: | 11.8% (11) |
| State: | 9.6% (14,146) |
Number of families with income $125k - 150k:| Selby-on-the-Bay: | 10.2% (10) |
| State: | 6.9% (10,202) |
Number of families with income $150k - 200k:| Selby-on-the-Bay: | 10.7% (10) |
| Maryland: | 10.7% (15,752) |
Number of families with income > $200k:| Selby-on-the-Bay: | 14.1% (14) |
| State: | 11.6% (17,028) |
Median non-family income in Selby-on-the-Bay in 2022:| Selby-on-the-Bay: | $47,170 |
| State: | $55,347 |
Change in median non-family income between 2000 and 2022:| Selby-on-the-Bay, Maryland: | +64.1% |
| Maryland: | +61.9% |
Median per capita income in Selby-on-the-Bay in 2022:| Selby-on-the-Bay: | $35,236 |
| State: | $29,024 |
Change in median per capita income between 2000 and 2022:| Selby-on-the-Bay, Maryland: | +70.9% |
| State: | +79.2% |
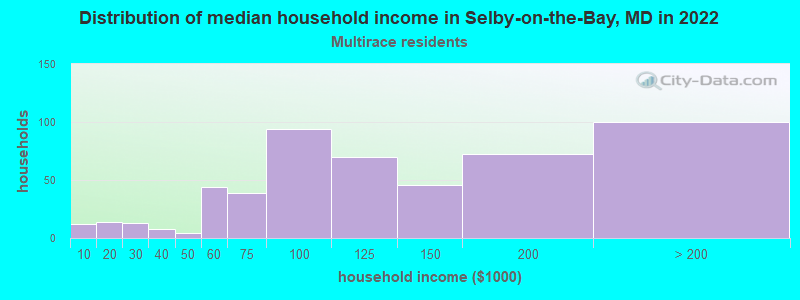
Income statistics for Multirace residents
Median household income in Selby-on-the-Bay, MD in 2022:| Selby-on-the-Bay: | $4,897 |
| Maryland: | $99,027 |
Change in median household income between 2000 and 2022:| Selby-on-the-Bay, Maryland: | +96.0% |
| State: | +111.4% |
Number of households with income < $10k:| Selby-on-the-Bay: | 2.3% (12) |
| State: | 4.8% (6,469) |
Number of households with income $10k - 20k:| Selby-on-the-Bay: | 2.7% (14) |
| State: | 3.3% (4,464) |
Number of households with income $20k - 30k:| Selby-on-the-Bay: | 2.5% (13) |
| State: | 5.8% (7,826) |
Number of households with income $30k - 40k:| Selby-on-the-Bay: | 1.6% (8) |
| State: | 8.1% (11,077) |
Number of households with income $40k - 50k:| Selby-on-the-Bay: | 0.8% (4) |
| State: | 4.3% (5,895) |
Number of households with income $50k - 60k:| Selby-on-the-Bay: | 8.5% (44) |
| State: | 3.9% (5,346) |
Number of households with income $60k - 75k:| Selby-on-the-Bay: | 7.6% (39) |
| State: | 6.7% (9,159) |
Number of households with income $75k - 100k:| Selby-on-the-Bay: | 18.2% (94) |
| State: | 13.6% (18,420) |
Number of households with income $100k - 125k:| Selby-on-the-Bay: | 13.6% (70) |
| Maryland: | 12.9% (17,488) |
Number of households with income $125k - 150k:| Selby-on-the-Bay: | 8.9% (46) |
| State: | 8.1% (11,039) |
Number of households with income $150k - 200k:| Selby-on-the-Bay: | 14.0% (72) |
| Maryland: | 11.5% (15,675) |
Number of households with income > $200k:| Selby-on-the-Bay: | 19.4% (100) |
| State: | 17.0% (23,059) |
Aggregate household income in Selby-on-the-Bay in 2022: $158,052
Median non-family income in Selby-on-the-Bay in 2022:| Selby-on-the-Bay: | $6,441 |
| State: | $60,702 |
Median per capita income in Selby-on-the-Bay in 2022:| Selby-on-the-Bay: | $28,500 |
| State: | $35,630 |
Change in median per capita income between 2000 and 2022:| Selby-on-the-Bay, Maryland: | +122.7% |
| State: | +125.1% |
Income statistics for other residents
Number of households with income < $10k:| Selby-on-the-Bay: | 5.0% (5) |
| State: | 3.4% (3,746) |
Number of households with income $10k - 20k:| Selby-on-the-Bay: | 5.0% (5) |
| Maryland: | 3.5% (3,842) |
Number of households with income $20k - 30k:| Selby-on-the-Bay: | 9.9% (10) |
| Maryland: | 7.6% (8,343) |
Number of households with income $30k - 40k:| Selby-on-the-Bay: | 5.0% (5) |
| State: | 7.5% (8,251) |
Number of households with income $40k - 50k:| Selby-on-the-Bay: | 5.0% (5) |
| State: | 8.6% (9,414) |
Number of households with income $50k - 60k:| Selby-on-the-Bay: | 12.9% (13) |
| State: | 10.0% (11,048) |
Number of households with income $60k - 75k:| Selby-on-the-Bay: | 7.9% (8) |
| Maryland: | 11.2% (12,339) |
Number of households with income $75k - 100k:| Selby-on-the-Bay: | 5.0% (5) |
| Maryland: | 17.5% (19,277) |
Number of households with income $100k - 125k:| Selby-on-the-Bay: | 11.9% (12) |
| State: | 8.9% (9,813) |
Number of households with income $125k - 150k:| Selby-on-the-Bay: | 7.9% (8) |
| State: | 6.3% (6,907) |
Number of households with income $150k - 200k:| Selby-on-the-Bay: | 7.9% (8) |
| State: | 8.2% (9,023) |
Number of households with income > $200k:| Selby-on-the-Bay: | 16.8% (17) |
| State: | 7.3% (8,036) |
Aggregate household income in Selby-on-the-Bay in 2022: $10,705,521
Median family income in Selby-on-the-Bay in 2022:| Selby-on-the-Bay: | $128,742 |
| State: | $69,179 |
Number of families with income $75k - 100k:| Selby-on-the-Bay: | 100.0% (52) |
| State: | 15.9% (14,199) |
Median per capita income in Selby-on-the-Bay in 2022:| Selby-on-the-Bay: | $94,205 |
| State: | $24,415 |
Change in median per capita income between 2000 and 2022:| Selby-on-the-Bay, Maryland: | +109.3% |
| Maryland: | +73.6% |