Seymour, Connecticut (CT) income map, earnings map, and wages data
The median household income in Seymour, CT in 2022 was $88,681, which was about the same as the median annual income of $88,429 across the entire state of Connecticut. Compared to the median income of $52,408 in 2000 this represents an increase of 40.9%. The per capita income in 2022 was $44,005, which means an increase of 45.3% compared to 2000 when it was $24,056.
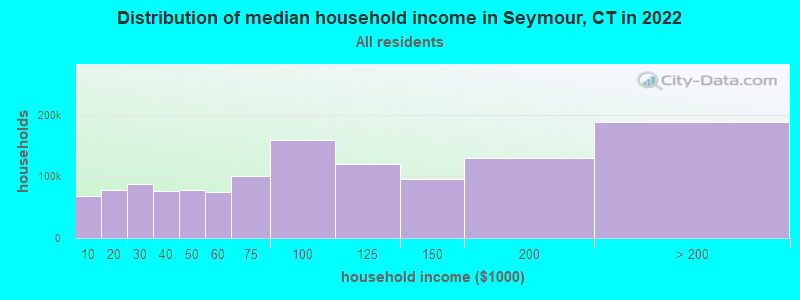
Income statistics for all residents
Median household income in Seymour, CT in 2022:| Seymour: | $88,682 |
| State: | $88,429 |
Change in median household income between 2000 and 2022:| Seymour, Connecticut: | +69.2% |
| Connecticut: | +64.0% |
Number of households with income < $10k:| Seymour: | 5.2% (36,122) |
| State: | 5.1% (72,746) |
Number of households with income $10k - 20k:| Seymour: | 5.8% (40,733) |
| State: | 5.7% (81,643) |
Number of households with income $20k - 30k:| Seymour: | 6.6% (46,105) |
| Connecticut: | 6.5% (92,844) |
Number of households with income $30k - 40k:| Seymour: | 5.9% (41,377) |
| Connecticut: | 5.9% (83,934) |
Number of households with income $40k - 50k:| Seymour: | 5.9% (41,111) |
| State: | 5.8% (83,025) |
Number of households with income $50k - 60k:| Seymour: | 5.8% (40,312) |
| State: | 5.7% (81,788) |
Number of households with income $60k - 75k:| Seymour: | 8.1% (56,482) |
| State: | 8.1% (115,651) |
Number of households with income $75k - 100k:| Seymour: | 12.6% (88,213) |
| State: | 12.6% (180,173) |
Number of households with income $100k - 125k:| Seymour: | 9.8% (68,673) |
| State: | 9.9% (141,231) |
Number of households with income $125k - 150k:| Seymour: | 7.8% (54,842) |
| Connecticut: | 7.9% (112,826) |
Number of households with income $150k - 200k:| Seymour: | 10.7% (75,019) |
| Connecticut: | 10.8% (154,641) |
Number of households with income > $200k:| Seymour: | 16.0% (112,074) |
| State: | 16.3% (233,133) |
Aggregate household income in Seymour in 2022: $15,668,320,110
Median family income in Seymour in 2022:| Seymour: | $116,111 |
| Connecticut: | $115,183 |
Median non-family income in Seymour in 2022:| Seymour: | $53,664 |
| Connecticut: | $50,964 |
Change in median non-family income between 2000 and 2022:| Seymour, Connecticut: | +71.5% |
| State: | +65.1% |
Median per capita income in Seymour in 2022:| Seymour: | $44,006 |
| Connecticut: | $51,581 |
Change in median per capita income between 2000 and 2022:| Seymour, Connecticut: | +82.9% |
| State: | +79.3% |
Income statistics for White residents
Median household income in Seymour, CT in 2022:| Seymour: | $88,185 |
| State: | $96,890 |
Change in median household income between 2000 and 2022:| Seymour, Connecticut: | +69.4% |
| Connecticut: | +68.5% |
Number of households with income < $10k:| Seymour: | 4.2% (19,288) |
| State: | 4.2% (42,265) |
Number of households with income $10k - 20k:| Seymour: | 4.9% (22,175) |
| State: | 4.8% (48,323) |
Number of households with income $20k - 30k:| Seymour: | 5.8% (26,372) |
| Connecticut: | 5.7% (57,716) |
Number of households with income $30k - 40k:| Seymour: | 5.4% (24,412) |
| Connecticut: | 5.3% (53,827) |
Number of households with income $40k - 50k:| Seymour: | 5.3% (24,310) |
| State: | 5.3% (53,301) |
Number of households with income $50k - 60k:| Seymour: | 5.6% (25,300) |
| Connecticut: | 5.5% (55,690) |
Number of households with income $60k - 75k:| Seymour: | 7.9% (36,155) |
| State: | 8.0% (80,329) |
Number of households with income $75k - 100k:| Seymour: | 12.7% (57,934) |
| State: | 12.7% (128,070) |
Number of households with income $100k - 125k:| Seymour: | 10.0% (45,492) |
| Connecticut: | 10.0% (101,210) |
Number of households with income $125k - 150k:| Seymour: | 8.0% (36,522) |
| Connecticut: | 8.0% (81,250) |
Number of households with income $150k - 200k:| Seymour: | 11.8% (53,702) |
| State: | 11.8% (119,527) |
Number of households with income > $200k:| Seymour: | 18.4% (84,068) |
| State: | 18.6% (187,875) |
Aggregate household income in Seymour in 2022: $11,469,501,954
Median family income in Seymour in 2022:| Seymour: | $117,294 |
| State: | $128,955 |
Number of families with income < $10k:| Seymour: | 4.7% (127) |
| Connecticut: | 1.9% (11,537) |
Number of families with income $10k - 20k:| Seymour: | 2.6% (70) |
| State: | 1.8% (11,289) |
Number of families with income $20k - 30k:| Seymour: | 4.2% (114) |
| Connecticut: | 3.0% (18,506) |
Number of families with income $30k - 40k:| Seymour: | 5.1% (137) |
| State: | 2.9% (18,160) |
Number of families with income $40k - 50k:| Seymour: | 6.2% (168) |
| State: | 3.9% (24,550) |
Number of families with income $50k - 60k:| Seymour: | 6.2% (167) |
| State: | 4.3% (26,723) |
Number of families with income $60k - 75k:| Seymour: | 11.3% (306) |
| State: | 7.1% (44,075) |
Number of families with income $75k - 100k:| Seymour: | 16.7% (452) |
| State: | 12.5% (77,679) |
Number of families with income $100k - 125k:| Seymour: | 19.0% (513) |
| State: | 11.1% (69,086) |
Number of families with income $125k - 150k:| Seymour: | 8.1% (219) |
| Connecticut: | 9.6% (59,616) |
Number of families with income $150k - 200k:| Seymour: | 7.5% (204) |
| State: | 15.7% (97,890) |
Number of families with income > $200k:| Seymour: | 8.4% (227) |
| State: | 26.3% (163,417) |
Median non-family income in Seymour in 2022:| Seymour: | $54,317 |
| State: | $54,067 |
Change in median non-family income between 2000 and 2022:| Seymour, Connecticut: | +73.7% |
| State: | +68.7% |
Median per capita income in Seymour in 2022:| Seymour: | $46,760 |
| Connecticut: | $59,916 |
Change in median per capita income between 2000 and 2022:| Seymour, Connecticut: | +92.1% |
| State: | +90.2% |
Income statistics for Black or African American residents
Median household income in Seymour, CT in 2022:| Seymour: | $151,878 |
| State: | $61,803 |
Change in median household income between 2000 and 2022:| Seymour, Connecticut: | +60.9% |
| Connecticut: | +76.1% |
Number of households with income < $10k:| Seymour: | 6.8% (25,528) |
| State: | 6.8% (9,494) |
Number of households with income $10k - 20k:| Seymour: | 7.9% (29,585) |
| State: | 7.9% (11,003) |
Number of households with income $20k - 30k:| Seymour: | 10.8% (40,453) |
| Connecticut: | 10.8% (15,045) |
Number of households with income $30k - 40k:| Seymour: | 8.2% (30,924) |
| State: | 8.2% (11,501) |
Number of households with income $40k - 50k:| Seymour: | 7.4% (28,006) |
| Connecticut: | 7.4% (10,416) |
Number of households with income $50k - 60k:| Seymour: | 7.5% (28,324) |
| State: | 7.5% (10,534) |
Number of households with income $60k - 75k:| Seymour: | 8.0% (30,233) |
| Connecticut: | 8.0% (11,244) |
Number of households with income $75k - 100k:| Seymour: | 9.6% (35,949) |
| State: | 9.6% (13,370) |
Number of households with income $100k - 125k:| Seymour: | 10.2% (38,299) |
| Connecticut: | 10.2% (14,244) |
Number of households with income $125k - 150k:| Seymour: | 8.0% (30,238) |
| State: | 8.0% (11,246) |
Number of households with income $150k - 200k:| Seymour: | 7.7% (28,843) |
| State: | 7.7% (10,727) |
Number of households with income > $200k:| Seymour: | 7.9% (29,808) |
| Connecticut: | 7.9% (11,086) |
Aggregate household income in Seymour in 2022: $24,349,762
Median family income in Seymour in 2022:| Seymour: | $200,924 |
| State: | $87,228 |
Number of families with income $60k - 75k:| Seymour: | 5.6% (7) |
| State: | 8.2% (6,861) |
Number of families with income $75k - 100k:| Seymour: | 27.2% (34) |
| Connecticut: | 12.7% (10,598) |
Number of families with income $100k - 125k:| Seymour: | 4.3% (5) |
| Connecticut: | 11.4% (9,482) |
Number of families with income $125k - 150k:| Seymour: | 62.9% (79) |
| State: | 11.2% (9,356) |
Median per capita income in Seymour in 2022:| Seymour: | $58,550 |
| State: | $36,289 |
Change in median per capita income between 2000 and 2022:| Seymour, Connecticut: | +115.2% |
| Connecticut: | +117.5% |
Income statistics for Asian residents
Median household income in Seymour, CT in 2022:| Seymour: | $138,015 |
| Connecticut: | $110,568 |
Change in median household income between 2000 and 2022:| Seymour, Connecticut: | +110.1% |
| State: | +79.5% |
Number of households with income < $10k:| Seymour: | 7.1% (4,528) |
| State: | 7.1% (4,245) |
Number of households with income $10k - 20k:| Seymour: | 3.5% (2,226) |
| State: | 3.5% (2,087) |
Number of households with income $20k - 30k:| Seymour: | 4.1% (2,628) |
| Connecticut: | 4.1% (2,464) |
Number of households with income $30k - 40k:| Seymour: | 4.1% (2,643) |
| State: | 4.1% (2,478) |
Number of households with income $40k - 50k:| Seymour: | 3.3% (2,115) |
| State: | 3.3% (1,983) |
Number of households with income $50k - 60k:| Seymour: | 3.9% (2,483) |
| Connecticut: | 3.9% (2,328) |
Number of households with income $60k - 75k:| Seymour: | 7.0% (4,510) |
| State: | 7.0% (4,228) |
Number of households with income $75k - 100k:| Seymour: | 11.5% (7,372) |
| State: | 11.5% (6,911) |
Number of households with income $100k - 125k:| Seymour: | 10.2% (6,536) |
| State: | 10.2% (6,127) |
Number of households with income $125k - 150k:| Seymour: | 8.5% (5,418) |
| State: | 8.5% (5,079) |
Number of households with income $150k - 200k:| Seymour: | 12.4% (7,930) |
| Connecticut: | 12.4% (7,434) |
Number of households with income > $200k:| Seymour: | 24.4% (15,639) |
| Connecticut: | 24.4% (14,661) |
Aggregate household income in Seymour in 2022: $28,492,776
Median family income in Seymour in 2022:| Seymour: | $137,964 |
| State: | $134,548 |
Number of families with income $30k - 40k:| Seymour: | 3.2% (3) |
| State: | 3.8% (1,652) |
Number of families with income $40k - 50k:| Seymour: | 16.9% (14) |
| State: | 2.0% (863) |
Number of families with income $60k - 75k:| Seymour: | 29.8% (25) |
| State: | 6.0% (2,651) |
Number of families with income $75k - 100k:| Seymour: | 38.1% (32) |
| Connecticut: | 11.0% (4,844) |
Number of families with income $100k - 125k:| Seymour: | 12.0% (10) |
| Connecticut: | 10.5% (4,621) |
Median non-family income in Seymour in 2022:| Seymour: | $108,757 |
| State: | $63,785 |
Change in median non-family income between 2000 and 2022:| Seymour, Connecticut: | +148.6% |
| Connecticut: | +77.9% |
Median per capita income in Seymour in 2022:| Seymour: | $38,674 |
| State: | $55,295 |
Change in median per capita income between 2000 and 2022:| Seymour, Connecticut: | +103.6% |
| Connecticut: | +97.8% |
Income statistics for Hispanic or Latino residents
Median household income in Seymour, CT in 2022:| Seymour: | $70,079 |
| Connecticut: | $60,275 |
Change in median household income between 2000 and 2022:| Seymour, Connecticut: | +67.8% |
| State: | +87.9% |
Number of households with income < $10k:| Seymour: | 8.7% (24,198) |
| Connecticut: | 8.7% (18,584) |
Number of households with income $10k - 20k:| Seymour: | 9.1% (25,046) |
| Connecticut: | 9.1% (19,235) |
Number of households with income $20k - 30k:| Seymour: | 8.9% (24,725) |
| Connecticut: | 8.9% (18,989) |
Number of households with income $30k - 40k:| Seymour: | 7.5% (20,790) |
| Connecticut: | 7.5% (15,967) |
Number of households with income $40k - 50k:| Seymour: | 8.7% (24,044) |
| Connecticut: | 8.7% (18,466) |
Number of households with income $50k - 60k:| Seymour: | 6.9% (19,149) |
| Connecticut: | 6.9% (14,706) |
Number of households with income $60k - 75k:| Seymour: | 8.9% (24,594) |
| State: | 8.9% (18,888) |
Number of households with income $75k - 100k:| Seymour: | 13.5% (37,330) |
| State: | 13.5% (28,669) |
Number of households with income $100k - 125k:| Seymour: | 8.2% (22,701) |
| State: | 8.2% (17,434) |
Number of households with income $125k - 150k:| Seymour: | 6.5% (17,907) |
| State: | 6.5% (13,752) |
Number of households with income $150k - 200k:| Seymour: | 6.6% (18,378) |
| State: | 6.6% (14,114) |
Number of households with income > $200k:| Seymour: | 6.4% (17,748) |
| State: | 6.4% (13,630) |
Aggregate household income in Seymour in 2022: $66,269,566
Median family income in Seymour in 2022:| Seymour: | $79,027 |
| State: | $68,336 |
Number of families with income < $10k:| Seymour: | 7.0% (55) |
| Connecticut: | 5.2% (7,456) |
Number of families with income $10k - 20k:| Seymour: | 6.8% (53) |
| State: | 6.0% (8,616) |
Number of families with income $20k - 30k:| Seymour: | 11.3% (88) |
| State: | 8.9% (12,680) |
Number of families with income $30k - 40k:| Seymour: | 9.4% (73) |
| State: | 8.5% (12,090) |
Number of families with income $40k - 50k:| Seymour: | 10.5% (82) |
| State: | 8.8% (12,624) |
Number of families with income $50k - 60k:| Seymour: | 9.8% (77) |
| State: | 8.4% (11,924) |
Number of families with income $60k - 75k:| Seymour: | 10.4% (81) |
| State: | 8.9% (12,677) |
Number of families with income $75k - 100k:| Seymour: | 15.0% (117) |
| State: | 14.3% (20,457) |
Number of families with income $100k - 125k:| Seymour: | 10.5% (82) |
| State: | 8.2% (11,720) |
Number of families with income $125k - 150k:| Seymour: | 5.3% (42) |
| Connecticut: | 8.2% (11,729) |
Number of families with income $150k - 200k:| Seymour: | 2.5% (19) |
| State: | 7.1% (10,096) |
Number of families with income > $200k:| Seymour: | 1.6% (13) |
| State: | 7.4% (10,622) |
Median non-family income in Seymour in 2022:| Seymour: | $44,273 |
| Connecticut: | $36,714 |
Change in median non-family income between 2000 and 2022:| Seymour, Connecticut: | +73.9% |
| State: | +90.0% |
Median per capita income in Seymour in 2022:| Seymour: | $26,754 |
| Connecticut: | $28,507 |
Change in median per capita income between 2000 and 2022:| Seymour, Connecticut: | +80.3% |
| State: | +117.2% |
Income statistics for American Indian and Alaska Native residents
Median household income in Seymour, CT in 2022:| Seymour: | $31,821 |
| Connecticut: | $41,848 |
Change in median household income between 2000 and 2022:| Seymour, Connecticut: | +12.9% |
| State: | +12.9% |
Number of households with income < $10k:| Seymour: | 8.4% (80,171) |
| State: | 10.2% (340) |
Number of households with income $10k - 20k:| Seymour: | 9.4% (89,470) |
| State: | 8.5% (283) |
Number of households with income $20k - 30k:| Seymour: | 8.5% (80,926) |
| Connecticut: | 9.4% (314) |
Number of households with income $30k - 40k:| Seymour: | 9.1% (86,702) |
| State: | 10.1% (337) |
Number of households with income $40k - 50k:| Seymour: | 8.3% (79,529) |
| State: | 13.4% (447) |
Number of households with income $50k - 60k:| Seymour: | 7.8% (74,989) |
| State: | 3.1% (104) |
Number of households with income $60k - 75k:| Seymour: | 9.8% (93,471) |
| Connecticut: | 5.6% (188) |
Number of households with income $75k - 100k:| Seymour: | 12.6% (120,656) |
| State: | 13.4% (447) |
Number of households with income $100k - 125k:| Seymour: | 9.4% (90,227) |
| State: | 9.5% (317) |
Number of households with income $125k - 150k:| Seymour: | 5.6% (54,018) |
| State: | 3.9% (131) |
Number of households with income $150k - 200k:| Seymour: | 6.0% (56,945) |
| Connecticut: | 6.3% (212) |
Number of households with income > $200k:| Seymour: | 5.2% (49,290) |
| State: | 6.8% (228) |
Aggregate household income in Seymour in 2022: $398,807
Median family income in Seymour in 2022:| Seymour: | $38,525 |
| State: | $57,217 |
Median per capita income in Seymour in 2022:| Seymour: | $9,361 |
| State: | $25,355 |
Change in median per capita income between 2000 and 2022:| Seymour, Connecticut: | +45.9% |
| Connecticut: | +39.4% |
Income statistics for Multirace residents
Median household income in Seymour, CT in 2022:| Seymour: | $132,842 |
| State: | $77,277 |
Change in median household income between 2000 and 2022:| Seymour, Connecticut: | +119.4% |
| State: | +113.6% |
Number of households with income < $10k:| Seymour: | 6.0% (12,475) |
| State: | 6.0% (7,457) |
Number of households with income $10k - 20k:| Seymour: | 8.1% (16,962) |
| State: | 8.1% (10,139) |
Number of households with income $20k - 30k:| Seymour: | 7.0% (14,558) |
| Connecticut: | 7.0% (8,702) |
Number of households with income $30k - 40k:| Seymour: | 6.9% (14,296) |
| Connecticut: | 6.9% (8,546) |
Number of households with income $40k - 50k:| Seymour: | 7.0% (14,575) |
| Connecticut: | 7.0% (8,712) |
Number of households with income $50k - 60k:| Seymour: | 5.9% (12,264) |
| State: | 5.9% (7,331) |
Number of households with income $60k - 75k:| Seymour: | 8.5% (17,790) |
| Connecticut: | 8.5% (10,634) |
Number of households with income $75k - 100k:| Seymour: | 14.1% (29,443) |
| State: | 14.1% (17,600) |
Number of households with income $100k - 125k:| Seymour: | 9.9% (20,716) |
| Connecticut: | 9.9% (12,383) |
Number of households with income $125k - 150k:| Seymour: | 7.2% (14,924) |
| Connecticut: | 7.2% (8,921) |
Number of households with income $150k - 200k:| Seymour: | 8.8% (18,272) |
| Connecticut: | 8.8% (10,922) |
Number of households with income > $200k:| Seymour: | 10.6% (22,161) |
| State: | 10.6% (13,247) |
Aggregate household income in Seymour in 2022: $12,918,199
Median family income in Seymour in 2022:| Seymour: | $131,718 |
| Connecticut: | $84,255 |
Number of families with income $60k - 75k:| Seymour: | 100.0% (53) |
| State: | 7.8% (6,550) |
Median non-family income in Seymour in 2022:| Seymour: | $11,314 |
| Connecticut: | $44,462 |
Change in median non-family income between 2000 and 2022:| Seymour, Connecticut: | +81.0% |
| State: | +97.6% |
Median per capita income in Seymour in 2022:| Seymour: | $17,756 |
| Connecticut: | $32,794 |
Change in median per capita income between 2000 and 2022:| Seymour, Connecticut: | +95.5% |
| Connecticut: | +117.2% |
Income statistics for other residents
Number of households with income < $10k:| Seymour: | 9.0% (14) |
| State: | 9.0% (8,596) |
Number of households with income $10k - 20k:| Seymour: | 10.3% (16) |
| Connecticut: | 10.2% (9,773) |
Number of households with income $20k - 30k:| Seymour: | 9.0% (14) |
| State: | 9.1% (8,691) |
Number of households with income $30k - 40k:| Seymour: | 7.7% (12) |
| State: | 7.8% (7,447) |
Number of households with income $40k - 50k:| Seymour: | 8.3% (13) |
| Connecticut: | 8.2% (7,860) |
Number of households with income $50k - 60k:| Seymour: | 5.8% (9) |
| State: | 6.0% (5,757) |
Number of households with income $60k - 75k:| Seymour: | 9.6% (15) |
| State: | 9.3% (8,942) |
Number of households with income $75k - 100k:| Seymour: | 14.1% (22) |
| State: | 14.3% (13,700) |
Number of households with income $100k - 125k:| Seymour: | 7.1% (11) |
| Connecticut: | 7.2% (6,906) |
Number of households with income $125k - 150k:| Seymour: | 6.4% (10) |
| State: | 6.5% (6,215) |
Number of households with income $150k - 200k:| Seymour: | 6.4% (10) |
| Connecticut: | 6.1% (5,865) |
Number of households with income > $200k:| Seymour: | 6.4% (10) |
| State: | 6.3% (6,065) |
Aggregate household income in Seymour in 2022: $22,009,904
Median family income in Seymour in 2022:| Seymour: | $167,425 |
| State: | $67,610 |
Number of families with income $40k - 50k:| Seymour: | 19.2% (21) |
| Connecticut: | 9.1% (6,039) |
Number of families with income $60k - 75k:| Seymour: | 23.8% (27) |
| State: | 9.4% (6,232) |
Number of families with income $75k - 100k:| Seymour: | 57.0% (64) |
| State: | 15.7% (10,362) |
Median non-family income in Seymour in 2022:| Seymour: | $57,387 |
| Connecticut: | $34,285 |
Change in median non-family income between 2000 and 2022:| Seymour, Connecticut: | +83.6% |
| State: | +83.6% |
Median per capita income in Seymour in 2022:| Seymour: | $51,523 |
| Connecticut: | $29,353 |