The median household income in Snoqualmie Pass, WA in 2022 was $81,753, which was 11.7% less than the median annual income of $91,306 across the entire state of Washington. Compared to the median income of $81,883 in 2000 this represents a constant level. The per capita income in 2022 was $65,062, which means an increase of 16.5% compared to 2000 when it was $54,316.
Whole page based on the data from 2000 / 2022 when the population of Snoqualmie Pass, Washington was 201 / 425
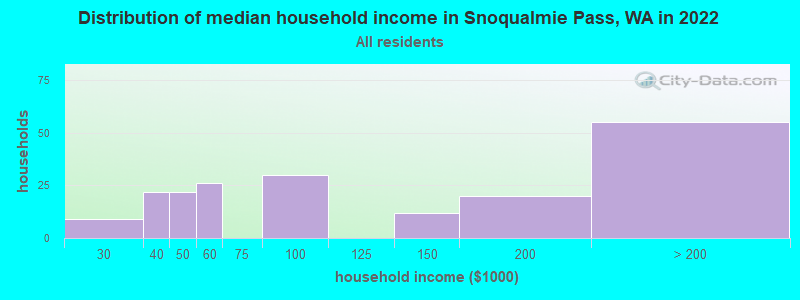
Income statistics for all residents
Median household income in Snoqualmie Pass, WA in 2022:
Snoqualmie Pass:
$81,753
Washington:
$91,306
Change in median household income between 2000 and 2022:: -0.2%
Snoqualmie Pass, Washington:
-0.2%
Washington:
+99.5%
Number of households with income < $10k:
Snoqualmie Pass:
0.0% (0)
Washington:
4.5% (139,331)
Number of households with income $10k - 20k:
Snoqualmie Pass:
0.0% (0)
Washington:
5.0% (154,508)
Number of households with income $20k - 30k:
Snoqualmie Pass:
4.6% (9)
Washington:
5.4% (166,555)
Number of households with income $30k - 40k:
Snoqualmie Pass:
11.2% (22)
State:
5.5% (170,324)
Number of households with income $40k - 50k:
Snoqualmie Pass:
11.2% (22)
State:
6.0% (183,941)
Number of households with income $50k - 60k:
Snoqualmie Pass:
13.3% (26)
State:
6.1% (187,395)
Number of households with income $60k - 75k:
Snoqualmie Pass:
0.0% (0)
State:
8.7% (266,771)
Number of households with income $75k - 100k:
Snoqualmie Pass:
15.3% (30)
State:
13.1% (404,672)
Number of households with income $100k - 125k:
Snoqualmie Pass:
0.0% (0)
Washington:
11.0% (337,911)
Number of households with income $125k - 150k:
Snoqualmie Pass:
6.1% (12)
State:
8.0% (244,934)
Number of households with income $150k - 200k:
Snoqualmie Pass:
10.2% (20)
State:
10.5% (323,812)
Number of households with income > $200k:
Snoqualmie Pass:
28.1% (55)
State:
16.2% (499,799)
Aggregate household income in Snoqualmie Pass in 2022: $26,083,833
Median family income in Snoqualmie Pass in 2022:
Snoqualmie Pass:
$178,287
State:
$109,192
Number of families with income $50k - 60k:
Snoqualmie Pass:
7.1% (8)
State:
5.3% (101,674)
Number of families with income $75k - 100k:
Snoqualmie Pass:
27.4% (30)
State:
13.8% (267,812)
Number of families with income $150k - 200k:
Snoqualmie Pass:
16.5% (18)
State:
13.0% (250,874)
Number of families with income > $200k:
Snoqualmie Pass:
48.9% (53)
State:
20.4% (393,898)
Median income for 3 person families:
Snoqualmie Pass:
$213,575
Washington:
$113,759
Median income for families with 0 earners:
Snoqualmie Pass:
$0
State:
$60,470
Median income for families with 1 earner:
Snoqualmie Pass:
$181,760
State:
$83,136
Median income for families with 2 earners:
Snoqualmie Pass:
$0
Washington:
$135,539
Median income for families with 3+ earners:
Snoqualmie Pass:
$0
State:
$163,538
Median non-family income in Snoqualmie Pass in 2022:
Snoqualmie Pass:
$45,153
State:
$57,299
Change in median non-family income between 2000 and 2022:: -7.4%
Snoqualmie Pass, Washington:
-7.4%
State:
+94.9%
Median per capita income in Snoqualmie Pass in 2022:
Snoqualmie Pass:
$65,063
Washington:
$50,764
Change in median per capita income between 2000 and 2022:
Snoqualmie Pass, Washington:
+19.8%
State:
+121.0%
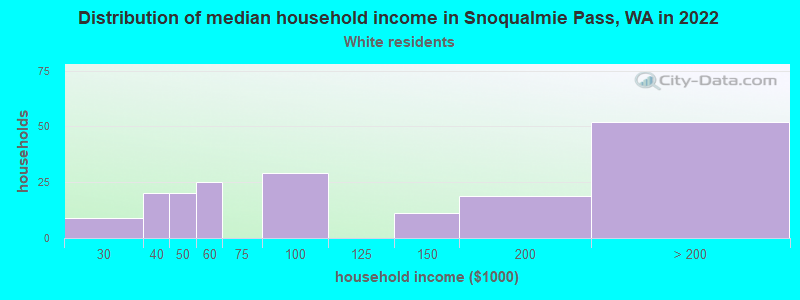
Income statistics for White residents
Median household income in Snoqualmie Pass, WA in 2022:
Snoqualmie Pass:
$81,153
State:
$91,916
Change in median household income between 2000 and 2022:
Snoqualmie Pass, Washington:
+3.1%
State:
+95.4%
Number of households with income < $10k:
Snoqualmie Pass:
0.0% (0)
Washington:
4.3% (95,850)
Number of households with income $10k - 20k:
Snoqualmie Pass:
0.0% (0)
State:
4.8% (106,421)
Number of households with income $20k - 30k:
Snoqualmie Pass:
4.9% (9)
Washington:
5.5% (122,860)
Number of households with income $30k - 40k:
Snoqualmie Pass:
10.8% (20)
State:
5.4% (119,627)
Number of households with income $40k - 50k:
Snoqualmie Pass:
10.8% (20)
Washington:
5.9% (132,276)
Number of households with income $50k - 60k:
Snoqualmie Pass:
13.5% (25)
Washington:
6.1% (136,212)
Number of households with income $60k - 75k:
Snoqualmie Pass:
0.0% (0)
State:
8.8% (196,086)
Number of households with income $75k - 100k:
Snoqualmie Pass:
15.7% (29)
State:
13.4% (299,192)
Number of households with income $100k - 125k:
Snoqualmie Pass:
0.0% (0)
State:
11.3% (252,209)
Number of households with income $125k - 150k:
Snoqualmie Pass:
5.9% (11)
State:
7.9% (175,962)
Number of households with income $150k - 200k:
Snoqualmie Pass:
10.3% (19)
State:
10.7% (239,156)
Number of households with income > $200k:
Snoqualmie Pass:
28.1% (52)
State:
16.1% (359,917)
Aggregate household income in Snoqualmie Pass in 2022: $24,998,213
Median family income in Snoqualmie Pass in 2022:
Snoqualmie Pass:
$177,783
State:
$112,511
Number of families with income $50k - 60k:
Snoqualmie Pass:
6.9% (7)
Washington:
5.0% (69,270)
Number of families with income $75k - 100k:
Snoqualmie Pass:
27.4% (28)
State:
14.1% (194,214)
Number of families with income $150k - 200k:
Snoqualmie Pass:
16.6% (17)
Washington:
13.7% (188,621)
Number of families with income > $200k:
Snoqualmie Pass:
49.1% (51)
Washington:
20.8% (285,982)
Median non-family income in Snoqualmie Pass in 2022:
Snoqualmie Pass:
$44,589
State:
$56,103
Change in median non-family income between 2000 and 2022:
Snoqualmie Pass, Washington:
+11.5%
State:
+87.7%
Median per capita income in Snoqualmie Pass in 2022:
Snoqualmie Pass:
$68,314
State:
$55,212
Change in median per capita income between 2000 and 2022:
Snoqualmie Pass, Washington:
+18.4%
Washington:
+123.8%
Income statistics for Black or African American residents
Median per capita income in Snoqualmie Pass in 2022:
Snoqualmie Pass:
$27,825
Washington:
$38,209
Income statistics for Hispanic or Latino residents
Median per capita income in Snoqualmie Pass in 2022:
Snoqualmie Pass:
$25,516
State:
$28,252
Change in median per capita income between 2000 and 2022:: -32.9%
Snoqualmie Pass, Washington:
-32.9%
State:
+150.2%
Income statistics for other residents
Median per capita income in Snoqualmie Pass in 2022:
Snoqualmie Pass:
$20,976
Washington:
$27,542
Change in median per capita income between 2000 and 2022:: -30.1%
Snoqualmie Pass, Washington:
-30.1%
State:
+167.8%
Discuss Snoqualmie Pass, Washington (WA) on our hugely popular Washington forum.