Snoqualmie Valley, Washington (WA) income map, earnings map, and wages data
The median household income in Snoqualmie Valley, WA in 2022 was $143,148, which was 36.2% greater than the median annual income of $91,306 across the entire state of Washington. Compared to the median income of $65,454 in 2000 this represents an increase of 54.3%. The per capita income in 2022 was $67,057, which means an increase of 57.8% compared to 2000 when it was $28,301.
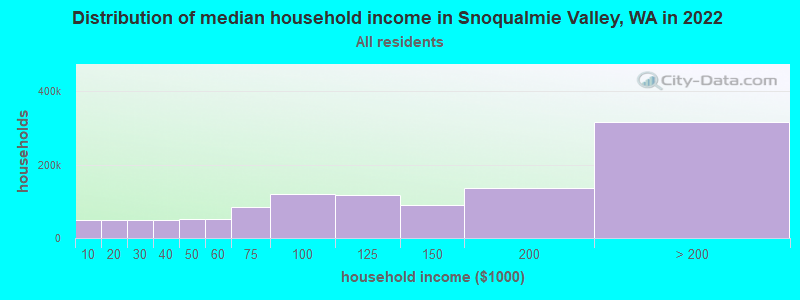
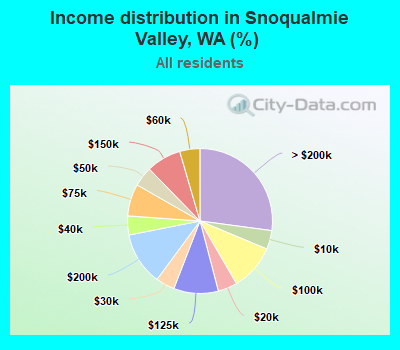
Income statistics for all residents
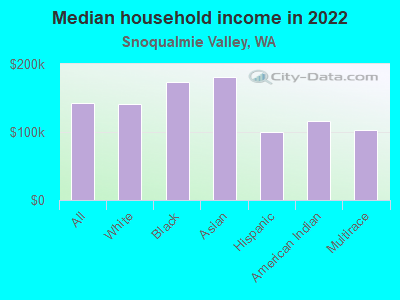
Median household income in Snoqualmie Valley, WA in 2022:| Snoqualmie Valley: | $143,149 |
| State: | $91,306 |
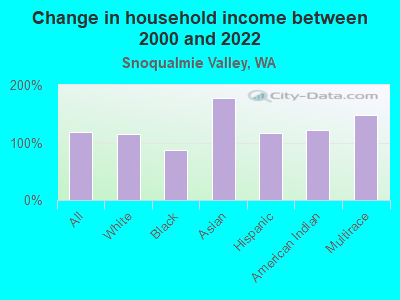
Change in median household income between 2000 and 2022:| Snoqualmie Valley, Washington: | +118.7% |
| Washington: | +99.5% |
Number of households with income < $10k:| Snoqualmie Valley: | 4.2% (48,742) |
| Washington: | 4.5% (139,331) |
Number of households with income $10k - 20k:| Snoqualmie Valley: | 4.3% (49,988) |
| State: | 5.0% (154,508) |
Number of households with income $20k - 30k:| Snoqualmie Valley: | 4.2% (49,302) |
| State: | 5.4% (166,555) |
Number of households with income $30k - 40k:| Snoqualmie Valley: | 4.2% (49,367) |
| State: | 5.5% (170,324) |
Number of households with income $40k - 50k:| Snoqualmie Valley: | 4.4% (51,291) |
| State: | 6.0% (183,941) |
Number of households with income $50k - 60k:| Snoqualmie Valley: | 4.5% (52,558) |
| State: | 6.1% (187,395) |
Number of households with income $60k - 75k:| Snoqualmie Valley: | 7.2% (83,332) |
| State: | 8.7% (266,771) |
Number of households with income $75k - 100k:| Snoqualmie Valley: | 10.3% (119,997) |
| State: | 13.1% (404,672) |
Number of households with income $100k - 125k:| Snoqualmie Valley: | 9.9% (115,734) |
| Washington: | 11.0% (337,911) |
Number of households with income $125k - 150k:| Snoqualmie Valley: | 7.8% (90,460) |
| State: | 8.0% (244,934) |
Number of households with income $150k - 200k:| Snoqualmie Valley: | 11.8% (137,194) |
| Washington: | 10.5% (323,812) |
Number of households with income > $200k:| Snoqualmie Valley: | 27.1% (315,693) |
| Washington: | 16.2% (499,799) |
Aggregate household income in Snoqualmie Valley in 2022: $75,849,092,061
Median family income in Snoqualmie Valley in 2022:| Snoqualmie Valley: | $160,197 |
| State: | $109,192 |
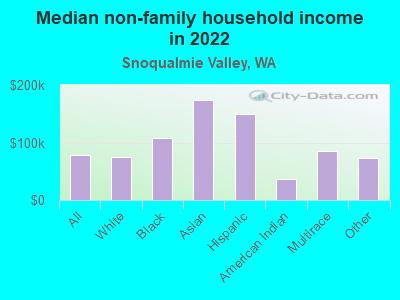
Median non-family income in Snoqualmie Valley in 2022:| Snoqualmie Valley: | $77,856 |
| State: | $57,299 |
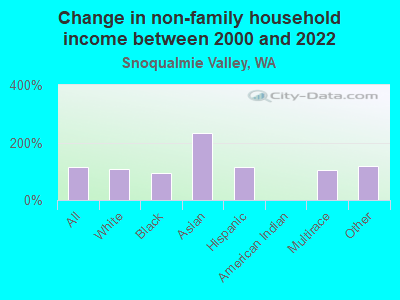
Change in median non-family income between 2000 and 2022:| Snoqualmie Valley, Washington: | +114.0% |
| State: | +94.9% |
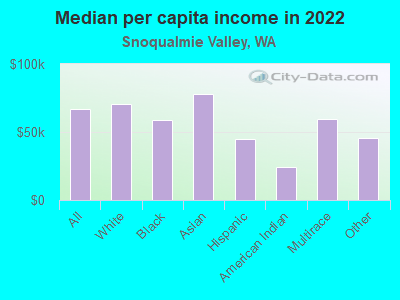
Median per capita income in Snoqualmie Valley in 2022:| Snoqualmie Valley: | $67,057 |
| Washington: | $50,764 |
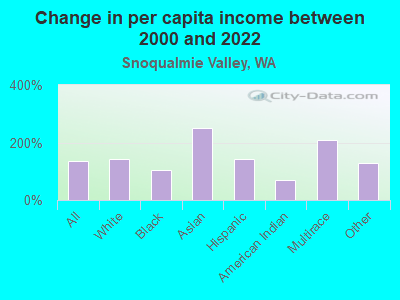
Change in median per capita income between 2000 and 2022:| Snoqualmie Valley, Washington: | +136.9% |
| Washington: | +121.0% |
Income statistics for White residents
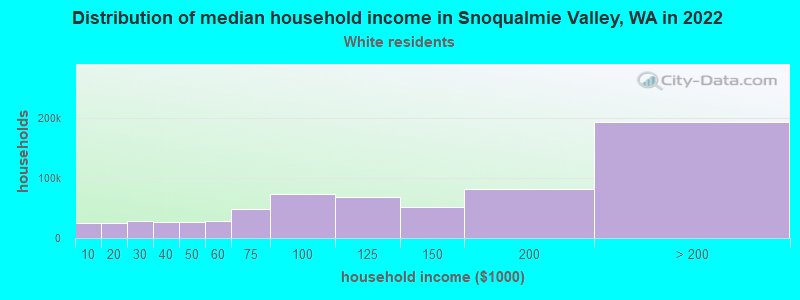
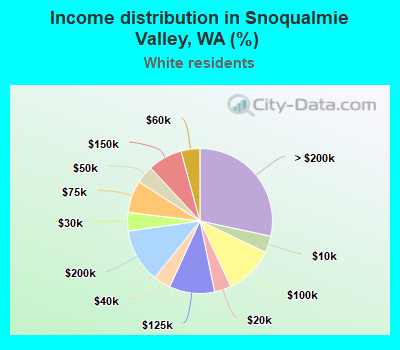
Median household income in Snoqualmie Valley, WA in 2022:| Snoqualmie Valley: | $140,976 |
| State: | $91,916 |
Change in median household income between 2000 and 2022:| Snoqualmie Valley, Washington: | +114.1% |
| State: | +95.4% |
Number of households with income < $10k:| Snoqualmie Valley: | 3.7% (25,258) |
| Washington: | 4.3% (95,850) |
Number of households with income $10k - 20k:| Snoqualmie Valley: | 3.8% (25,557) |
| State: | 4.8% (106,421) |
Number of households with income $20k - 30k:| Snoqualmie Valley: | 4.1% (28,230) |
| Washington: | 5.5% (122,860) |
Number of households with income $30k - 40k:| Snoqualmie Valley: | 3.9% (26,237) |
| Washington: | 5.4% (119,627) |
Number of households with income $40k - 50k:| Snoqualmie Valley: | 4.0% (27,146) |
| State: | 5.9% (132,276) |
Number of households with income $50k - 60k:| Snoqualmie Valley: | 4.2% (28,642) |
| Washington: | 6.1% (136,212) |
Number of households with income $60k - 75k:| Snoqualmie Valley: | 7.2% (48,923) |
| State: | 8.8% (196,086) |
Number of households with income $75k - 100k:| Snoqualmie Valley: | 10.9% (74,208) |
| Washington: | 13.4% (299,192) |
Number of households with income $100k - 125k:| Snoqualmie Valley: | 10.1% (68,805) |
| State: | 11.3% (252,209) |
Number of households with income $125k - 150k:| Snoqualmie Valley: | 7.7% (52,483) |
| State: | 7.9% (175,962) |
Number of households with income $150k - 200k:| Snoqualmie Valley: | 12.1% (82,097) |
| State: | 10.7% (239,156) |
Number of households with income > $200k:| Snoqualmie Valley: | 28.4% (193,526) |
| Washington: | 16.1% (359,917) |
Aggregate household income in Snoqualmie Valley in 2022: $46,284,693,333
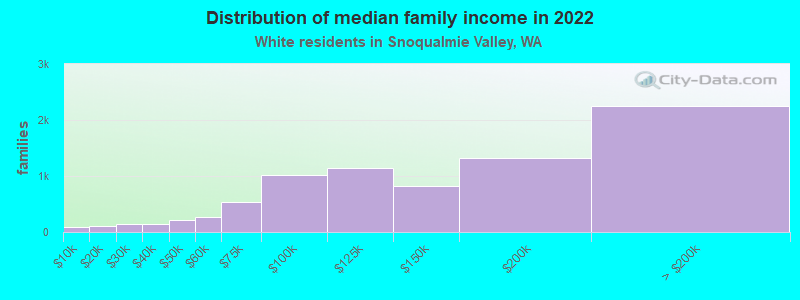
Median family income in Snoqualmie Valley in 2022:| Snoqualmie Valley: | $165,656 |
| State: | $112,511 |
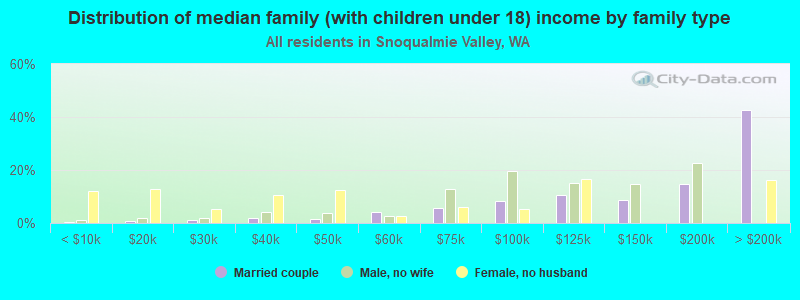
Number of families with income < $10k:| Snoqualmie Valley: | 1.2% (97) |
| State: | 2.4% (33,676) |
Number of families with income $10k - 20k:| Snoqualmie Valley: | 1.3% (108) |
| Washington: | 2.0% (28,228) |
Number of families with income $20k - 30k:| Snoqualmie Valley: | 1.7% (137) |
| State: | 2.9% (39,288) |
Number of families with income $30k - 40k:| Snoqualmie Valley: | 1.7% (137) |
| State: | 3.6% (50,190) |
Number of families with income $40k - 50k:| Snoqualmie Valley: | 2.7% (220) |
| State: | 4.6% (63,009) |
Number of families with income $50k - 60k:| Snoqualmie Valley: | 3.2% (260) |
| State: | 5.0% (69,270) |
Number of families with income $60k - 75k:| Snoqualmie Valley: | 6.7% (537) |
| State: | 8.2% (112,369) |
Number of families with income $75k - 100k:| Snoqualmie Valley: | 12.6% (1,016) |
| State: | 14.1% (194,214) |
Number of families with income $100k - 125k:| Snoqualmie Valley: | 14.2% (1,140) |
| Washington: | 13.2% (182,184) |
Number of families with income $125k - 150k:| Snoqualmie Valley: | 10.2% (820) |
| State: | 9.5% (130,928) |
Number of families with income $150k - 200k:| Snoqualmie Valley: | 16.4% (1,314) |
| Washington: | 13.7% (188,621) |
Number of families with income > $200k:| Snoqualmie Valley: | 28.0% (2,247) |
| Washington: | 20.8% (285,982) |
Median non-family income in Snoqualmie Valley in 2022:| Snoqualmie Valley: | $75,435 |
| Washington: | $56,103 |
Change in median non-family income between 2000 and 2022:| Snoqualmie Valley, Washington: | +109.2% |
| State: | +87.7% |
Median per capita income in Snoqualmie Valley in 2022:| Snoqualmie Valley: | $70,410 |
| Washington: | $55,212 |
Change in median per capita income between 2000 and 2022:| Snoqualmie Valley, Washington: | +143.6% |
| Washington: | +123.8% |
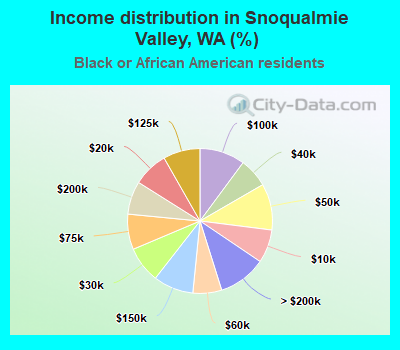
Income statistics for Black or African American residents
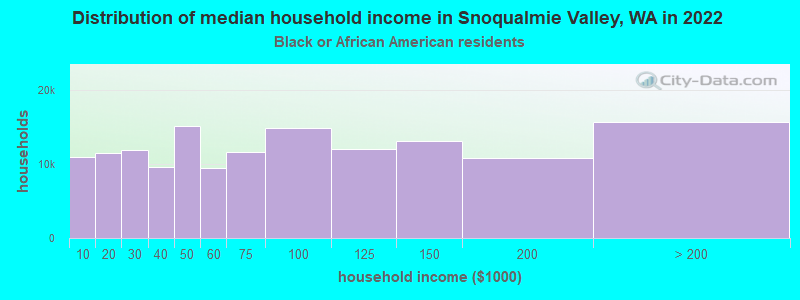
Median household income in Snoqualmie Valley, WA in 2022:| Snoqualmie Valley: | $173,505 |
| Washington: | $68,202 |
Change in median household income between 2000 and 2022:| Snoqualmie Valley, Washington: | +87.5% |
| Washington: | +89.9% |
Number of households with income < $10k:| Snoqualmie Valley: | 7.4% (10,915) |
| State: | 7.2% (8,014) |
Number of households with income $10k - 20k:| Snoqualmie Valley: | 7.8% (11,470) |
| State: | 8.0% (8,904) |
Number of households with income $20k - 30k:| Snoqualmie Valley: | 8.1% (11,851) |
| Washington: | 7.4% (8,207) |
Number of households with income $30k - 40k:| Snoqualmie Valley: | 6.5% (9,562) |
| State: | 5.6% (6,220) |
Number of households with income $40k - 50k:| Snoqualmie Valley: | 10.4% (15,167) |
| State: | 9.5% (10,585) |
Number of households with income $50k - 60k:| Snoqualmie Valley: | 6.4% (9,433) |
| State: | 7.3% (8,078) |
Number of households with income $60k - 75k:| Snoqualmie Valley: | 7.9% (11,567) |
| Washington: | 8.7% (9,704) |
Number of households with income $75k - 100k:| Snoqualmie Valley: | 10.1% (14,848) |
| State: | 12.9% (14,315) |
Number of households with income $100k - 125k:| Snoqualmie Valley: | 8.2% (12,067) |
| Washington: | 7.7% (8,592) |
Number of households with income $125k - 150k:| Snoqualmie Valley: | 9.0% (13,125) |
| State: | 8.9% (9,840) |
Number of households with income $150k - 200k:| Snoqualmie Valley: | 7.4% (10,838) |
| State: | 7.6% (8,434) |
Number of households with income > $200k:| Snoqualmie Valley: | 10.7% (15,677) |
| Washington: | 9.1% (10,075) |
Aggregate household income in Snoqualmie Valley in 2022: $32,071,214
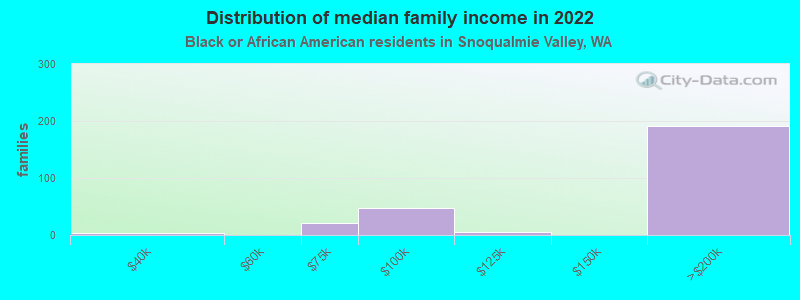
Median family income in Snoqualmie Valley in 2022:| Snoqualmie Valley: | $189,498 |
| State: | $82,165 |
Number of families with income $30k - 40k:| Snoqualmie Valley: | 1.2% (3) |
| State: | 5.3% (3,525) |
Number of families with income $60k - 75k:| Snoqualmie Valley: | 7.7% (21) |
| State: | 9.3% (6,231) |
Number of families with income $75k - 100k:| Snoqualmie Valley: | 17.9% (48) |
| Washington: | 14.8% (9,876) |
Number of families with income $100k - 125k:| Snoqualmie Valley: | 2.2% (6) |
| State: | 9.0% (6,018) |
Number of families with income $150k - 200k:| Snoqualmie Valley: | 71.0% (191) |
| State: | 8.6% (5,737) |
Median non-family income in Snoqualmie Valley in 2022:| Snoqualmie Valley: | $108,471 |
| Washington: | $49,169 |
Change in median non-family income between 2000 and 2022:| Snoqualmie Valley, Washington: | +92.8% |
| State: | +87.7% |
Median per capita income in Snoqualmie Valley in 2022:| Snoqualmie Valley: | $58,838 |
| State: | $38,209 |
Change in median per capita income between 2000 and 2022:| Snoqualmie Valley, Washington: | +104.5% |
| State: | +115.3% |
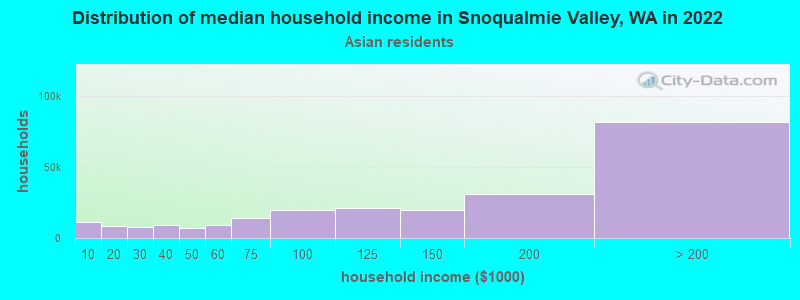
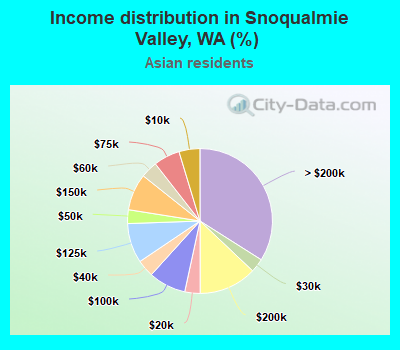
Income statistics for Asian residents
Median household income in Snoqualmie Valley, WA in 2022:| Snoqualmie Valley: | $180,788 |
| State: | $125,692 |
Number of households with income < $10k:| Snoqualmie Valley: | 4.7% (11,171) |
| State: | 4.9% (14,099) |
Number of households with income $10k - 20k:| Snoqualmie Valley: | 3.4% (8,200) |
| State: | 3.5% (9,873) |
Number of households with income $20k - 30k:| Snoqualmie Valley: | 3.1% (7,415) |
| State: | 2.9% (8,352) |
Number of households with income $30k - 40k:| Snoqualmie Valley: | 3.9% (9,235) |
| Washington: | 4.0% (11,415) |
Number of households with income $40k - 50k:| Snoqualmie Valley: | 3.1% (7,330) |
| State: | 4.0% (11,421) |
Number of households with income $50k - 60k:| Snoqualmie Valley: | 3.8% (9,022) |
| State: | 4.2% (12,100) |
Number of households with income $60k - 75k:| Snoqualmie Valley: | 5.9% (14,073) |
| State: | 6.3% (17,903) |
Number of households with income $75k - 100k:| Snoqualmie Valley: | 8.3% (19,910) |
| Washington: | 10.4% (29,663) |
Number of households with income $100k - 125k:| Snoqualmie Valley: | 8.9% (21,262) |
| State: | 9.4% (26,839) |
Number of households with income $125k - 150k:| Snoqualmie Valley: | 8.2% (19,637) |
| State: | 8.5% (24,200) |
Number of households with income $150k - 200k:| Snoqualmie Valley: | 12.9% (30,876) |
| Washington: | 12.6% (35,976) |
Number of households with income > $200k:| Snoqualmie Valley: | 34.0% (81,431) |
| State: | 29.2% (83,109) |
Aggregate household income in Snoqualmie Valley in 2022: $182,512,294
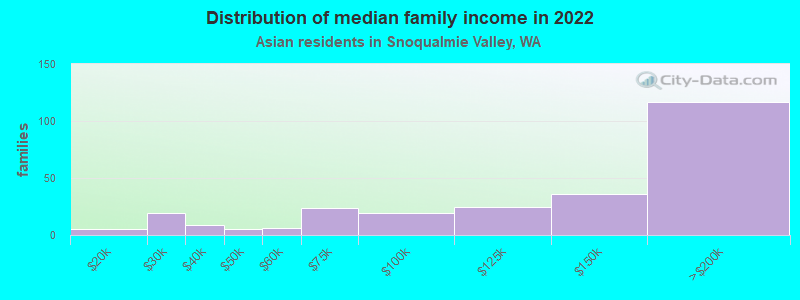
Median family income in Snoqualmie Valley in 2022:| Snoqualmie Valley: | $173,820 |
| State: | $143,595 |
Number of families with income $10k - 20k:| Snoqualmie Valley: | 1.9% (5) |
| Washington: | 2.2% (4,150) |
Number of families with income $20k - 30k:| Snoqualmie Valley: | 7.4% (19) |
| State: | 1.9% (3,558) |
Number of families with income $30k - 40k:| Snoqualmie Valley: | 3.3% (9) |
| State: | 3.1% (5,734) |
Number of families with income $40k - 50k:| Snoqualmie Valley: | 1.8% (5) |
| Washington: | 3.6% (6,707) |
Number of families with income $50k - 60k:| Snoqualmie Valley: | 2.1% (6) |
| State: | 4.1% (7,663) |
Number of families with income $60k - 75k:| Snoqualmie Valley: | 9.0% (24) |
| State: | 5.1% (9,490) |
Number of families with income $75k - 100k:| Snoqualmie Valley: | 7.2% (19) |
| State: | 11.7% (21,919) |
Number of families with income $100k - 125k:| Snoqualmie Valley: | 9.4% (25) |
| Washington: | 9.3% (17,280) |
Number of families with income $125k - 150k:| Snoqualmie Valley: | 13.7% (36) |
| State: | 8.4% (15,602) |
Number of families with income $150k - 200k:| Snoqualmie Valley: | 44.2% (117) |
| State: | 13.3% (24,789) |
Median non-family income in Snoqualmie Valley in 2022:| Snoqualmie Valley: | $173,546 |
| State: | $84,971 |
Median per capita income in Snoqualmie Valley in 2022:| Snoqualmie Valley: | $77,937 |
| State: | $67,666 |
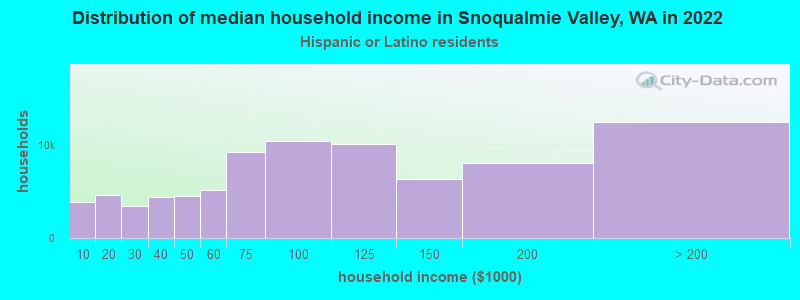
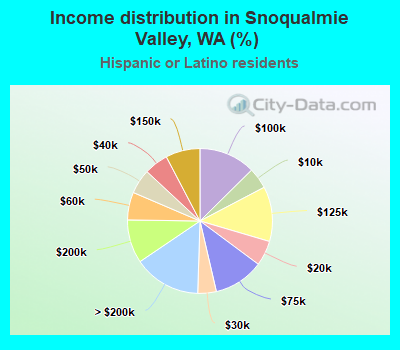
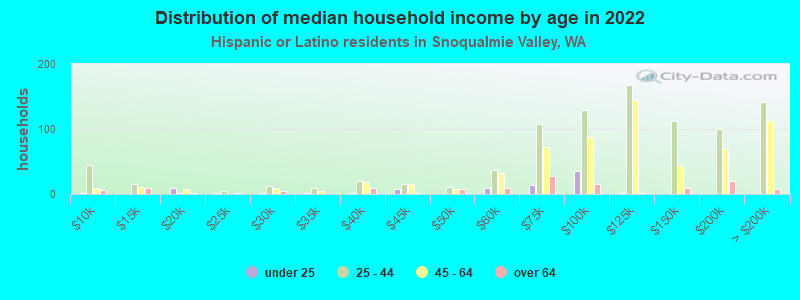
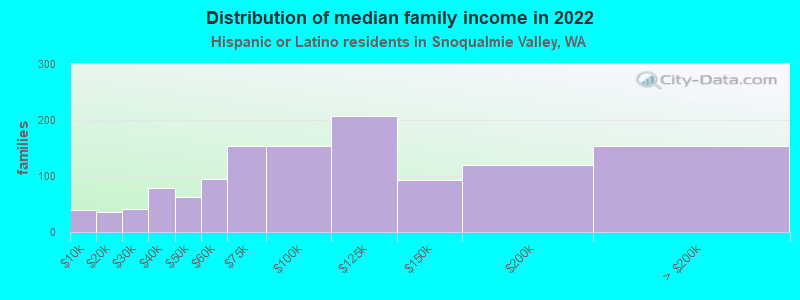
Income statistics for Hispanic or Latino residents
Median household income in Snoqualmie Valley, WA in 2022:| Snoqualmie Valley: | $100,047 |
| Washington: | $74,770 |
Change in median household income between 2000 and 2022:| Snoqualmie Valley, Washington: | +116.8% |
| Washington: | +128.3% |
Number of households with income < $10k:| Snoqualmie Valley: | 4.7% (3,906) |
| Washington: | 4.9% (14,456) |
Number of households with income $10k - 20k:| Snoqualmie Valley: | 5.6% (4,658) |
| Washington: | 5.3% (15,449) |
Number of households with income $20k - 30k:| Snoqualmie Valley: | 4.1% (3,434) |
| State: | 6.8% (20,016) |
Number of households with income $30k - 40k:| Snoqualmie Valley: | 5.4% (4,462) |
| State: | 7.7% (22,548) |
Number of households with income $40k - 50k:| Snoqualmie Valley: | 5.5% (4,568) |
| State: | 7.3% (21,450) |
Number of households with income $50k - 60k:| Snoqualmie Valley: | 6.2% (5,143) |
| Washington: | 7.7% (22,744) |
Number of households with income $60k - 75k:| Snoqualmie Valley: | 11.2% (9,298) |
| State: | 10.5% (30,737) |
Number of households with income $75k - 100k:| Snoqualmie Valley: | 12.6% (10,472) |
| Washington: | 14.9% (43,843) |
Number of households with income $100k - 125k:| Snoqualmie Valley: | 12.2% (10,161) |
| State: | 11.1% (32,554) |
Number of households with income $125k - 150k:| Snoqualmie Valley: | 7.7% (6,377) |
| State: | 7.4% (21,624) |
Number of households with income $150k - 200k:| Snoqualmie Valley: | 9.7% (8,056) |
| State: | 7.3% (21,360) |
Number of households with income > $200k:| Snoqualmie Valley: | 15.0% (12,478) |
| State: | 9.2% (27,055) |
Aggregate household income in Snoqualmie Valley in 2022: $140,421,082
Median family income in Snoqualmie Valley in 2022:| Snoqualmie Valley: | $102,877 |
| State: | $76,866 |
Number of families with income < $10k:| Snoqualmie Valley: | 3.3% (40) |
| State: | 4.4% (9,443) |
Number of families with income $10k - 20k:| Snoqualmie Valley: | 2.9% (35) |
| Washington: | 3.5% (7,524) |
Number of families with income $20k - 30k:| Snoqualmie Valley: | 3.3% (41) |
| State: | 5.6% (12,052) |
Number of families with income $30k - 40k:| Snoqualmie Valley: | 6.3% (78) |
| State: | 8.3% (17,803) |
Number of families with income $40k - 50k:| Snoqualmie Valley: | 5.1% (62) |
| State: | 7.7% (16,361) |
Number of families with income $50k - 60k:| Snoqualmie Valley: | 7.7% (94) |
| Washington: | 7.9% (16,852) |
Number of families with income $60k - 75k:| Snoqualmie Valley: | 12.5% (154) |
| State: | 11.4% (24,342) |
Number of families with income $75k - 100k:| Snoqualmie Valley: | 12.5% (154) |
| State: | 14.4% (30,698) |
Number of families with income $100k - 125k:| Snoqualmie Valley: | 16.8% (207) |
| State: | 11.4% (24,331) |
Number of families with income $125k - 150k:| Snoqualmie Valley: | 7.5% (93) |
| State: | 7.5% (16,099) |
Number of families with income $150k - 200k:| Snoqualmie Valley: | 9.7% (120) |
| Washington: | 8.2% (17,551) |
Number of families with income > $200k:| Snoqualmie Valley: | 12.5% (154) |
| State: | 9.7% (20,653) |
Median non-family income in Snoqualmie Valley in 2022:| Snoqualmie Valley: | $148,853 |
| State: | $54,173 |
Change in median non-family income between 2000 and 2022:| Snoqualmie Valley, Washington: | +115.4% |
| Washington: | +105.8% |
Median per capita income in Snoqualmie Valley in 2022:| Snoqualmie Valley: | $44,690 |
| State: | $28,252 |
Change in median per capita income between 2000 and 2022:| Snoqualmie Valley, Washington: | +141.5% |
| Washington: | +150.2% |
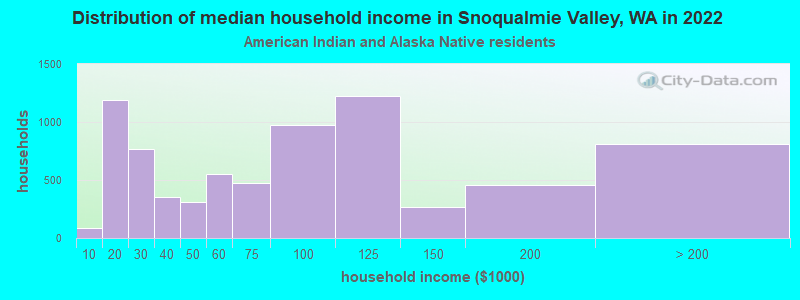
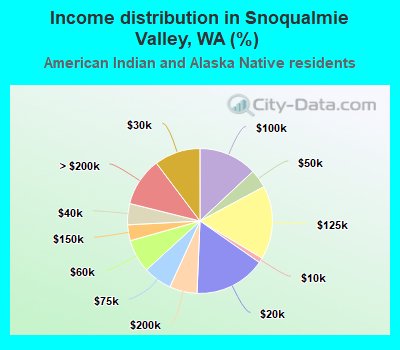
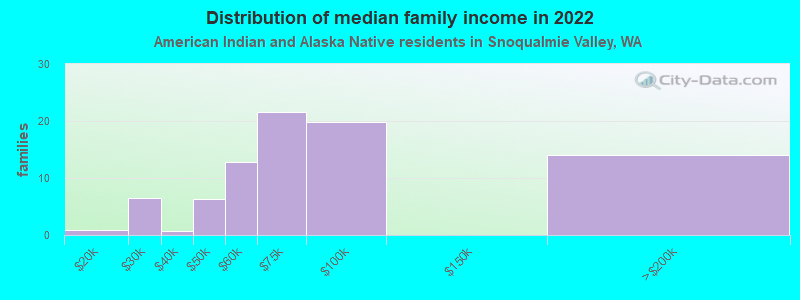
Income statistics for American Indian and Alaska Native residents
Median household income in Snoqualmie Valley, WA in 2022:| Snoqualmie Valley: | $115,828 |
| State: | $71,255 |
Change in median household income between 2000 and 2022:| Snoqualmie Valley, Washington: | +120.6% |
| State: | +118.1% |
Number of households with income < $10k:| Snoqualmie Valley: | 1.1% (84) |
| State: | 5.9% (1,768) |
Number of households with income $10k - 20k:| Snoqualmie Valley: | 15.9% (1,191) |
| State: | 8.9% (2,694) |
Number of households with income $20k - 30k:| Snoqualmie Valley: | 10.3% (768) |
| Washington: | 8.0% (2,412) |
Number of households with income $30k - 40k:| Snoqualmie Valley: | 4.7% (354) |
| State: | 7.7% (2,327) |
Number of households with income $40k - 50k:| Snoqualmie Valley: | 4.1% (309) |
| State: | 5.8% (1,755) |
Number of households with income $50k - 60k:| Snoqualmie Valley: | 7.4% (552) |
| Washington: | 7.5% (2,259) |
Number of households with income $60k - 75k:| Snoqualmie Valley: | 6.4% (478) |
| State: | 8.8% (2,669) |
Number of households with income $75k - 100k:| Snoqualmie Valley: | 13.0% (974) |
| Washington: | 12.8% (3,861) |
Number of households with income $100k - 125k:| Snoqualmie Valley: | 16.4% (1,228) |
| Washington: | 12.0% (3,618) |
Number of households with income $125k - 150k:| Snoqualmie Valley: | 3.5% (265) |
| Washington: | 8.6% (2,580) |
Number of households with income $150k - 200k:| Snoqualmie Valley: | 6.2% (460) |
| Washington: | 5.9% (1,774) |
Number of households with income > $200k:| Snoqualmie Valley: | 10.8% (809) |
| State: | 8.1% (2,447) |
Aggregate household income in Snoqualmie Valley in 2022: $8,969,794
Median family income in Snoqualmie Valley in 2022:| Snoqualmie Valley: | $111,021 |
| Washington: | $79,010 |
Number of families with income $10k - 20k:| Snoqualmie Valley: | 1.2% (1) |
| State: | 5.2% (1,056) |
Number of families with income $20k - 30k:| Snoqualmie Valley: | 7.8% (6) |
| State: | 6.2% (1,258) |
Number of families with income $30k - 40k:| Snoqualmie Valley: | 0.9% (1) |
| State: | 5.9% (1,190) |
Number of families with income $40k - 50k:| Snoqualmie Valley: | 7.5% (6) |
| Washington: | 4.6% (927) |
Number of families with income $50k - 60k:| Snoqualmie Valley: | 15.4% (13) |
| Washington: | 9.7% (1,973) |
Number of families with income $60k - 75k:| Snoqualmie Valley: | 26.1% (22) |
| Washington: | 10.5% (2,124) |
Number of families with income $75k - 100k:| Snoqualmie Valley: | 24.0% (20) |
| State: | 13.1% (2,669) |
Number of families with income $150k - 200k:| Snoqualmie Valley: | 17.0% (14) |
| State: | 7.8% (1,584) |
Median non-family income in Snoqualmie Valley in 2022:| Snoqualmie Valley: | $35,977 |
| State: | $35,591 |
Median per capita income in Snoqualmie Valley in 2022:| Snoqualmie Valley: | $24,478 |
| State: | $27,053 |
Change in median per capita income between 2000 and 2022:| Snoqualmie Valley, Washington: | +68.7% |
| Washington: | +98.6% |
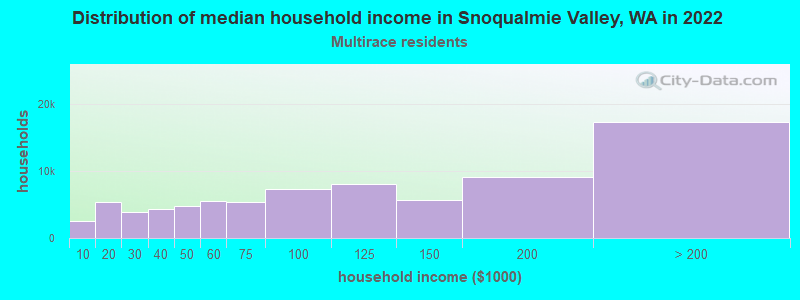
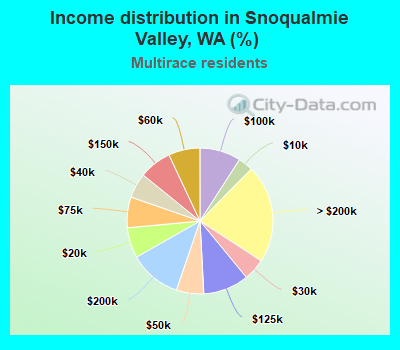
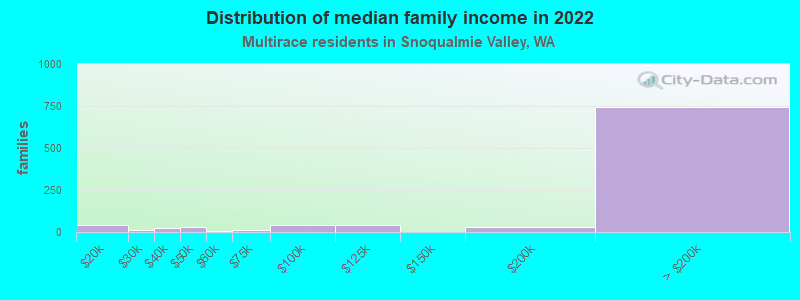
Income statistics for Multirace residents
Median household income in Snoqualmie Valley, WA in 2022:| Snoqualmie Valley: | $102,972 |
| State: | $84,303 |
Change in median household income between 2000 and 2022:| Snoqualmie Valley, Washington: | +146.6% |
| Washington: | +125.7% |
Number of households with income < $10k:| Snoqualmie Valley: | 3.3% (2,609) |
| State: | 4.3% (12,040) |
Number of households with income $10k - 20k:| Snoqualmie Valley: | 6.7% (5,358) |
| State: | 6.6% (18,437) |
Number of households with income $20k - 30k:| Snoqualmie Valley: | 4.9% (3,878) |
| State: | 5.2% (14,559) |
Number of households with income $30k - 40k:| Snoqualmie Valley: | 5.5% (4,410) |
| State: | 6.7% (18,491) |
Number of households with income $40k - 50k:| Snoqualmie Valley: | 6.1% (4,836) |
| State: | 6.3% (17,459) |
Number of households with income $50k - 60k:| Snoqualmie Valley: | 7.0% (5,564) |
| State: | 6.9% (19,086) |
Number of households with income $60k - 75k:| Snoqualmie Valley: | 6.8% (5,428) |
| Washington: | 9.1% (25,310) |
Number of households with income $75k - 100k:| Snoqualmie Valley: | 9.1% (7,268) |
| Washington: | 13.5% (37,493) |
Number of households with income $100k - 125k:| Snoqualmie Valley: | 10.1% (8,064) |
| State: | 10.7% (29,626) |
Number of households with income $125k - 150k:| Snoqualmie Valley: | 7.2% (5,710) |
| State: | 8.6% (23,899) |
Number of households with income $150k - 200k:| Snoqualmie Valley: | 11.5% (9,191) |
| State: | 10.2% (28,214) |
Number of households with income > $200k:| Snoqualmie Valley: | 21.8% (17,372) |
| State: | 11.9% (32,947) |
Aggregate household income in Snoqualmie Valley in 2022: $147,574,001
Median family income in Snoqualmie Valley in 2022:| Snoqualmie Valley: | $119,457 |
| State: | $95,629 |
Number of families with income < $10k:| Snoqualmie Valley: | 0.3% (3) |
| State: | 3.5% (6,121) |
Number of families with income $10k - 20k:| Snoqualmie Valley: | 4.0% (39) |
| State: | 4.3% (7,519) |
Number of families with income $20k - 30k:| Snoqualmie Valley: | 1.1% (11) |
| Washington: | 4.4% (7,775) |
Number of families with income $30k - 40k:| Snoqualmie Valley: | 2.1% (21) |
| State: | 5.8% (10,186) |
Number of families with income $40k - 50k:| Snoqualmie Valley: | 3.0% (29) |
| Washington: | 5.9% (10,412) |
Number of families with income $50k - 60k:| Snoqualmie Valley: | 0.6% (6) |
| State: | 5.6% (9,922) |
Number of families with income $60k - 75k:| Snoqualmie Valley: | 1.2% (11) |
| Washington: | 9.7% (17,113) |
Number of families with income $75k - 100k:| Snoqualmie Valley: | 4.5% (44) |
| State: | 13.6% (23,984) |
Number of families with income $100k - 125k:| Snoqualmie Valley: | 4.2% (41) |
| State: | 10.4% (18,288) |
Number of families with income $150k - 200k:| Snoqualmie Valley: | 2.8% (28) |
| Washington: | 11.9% (20,852) |
Number of families with income > $200k:| Snoqualmie Valley: | 76.1% (743) |
| State: | 14.4% (25,289) |
Median non-family income in Snoqualmie Valley in 2022:| Snoqualmie Valley: | $85,015 |
| Washington: | $56,573 |
Change in median non-family income between 2000 and 2022:| Snoqualmie Valley, Washington: | +106.1% |
| Washington: | +115.0% |
Median per capita income in Snoqualmie Valley in 2022:| Snoqualmie Valley: | $59,390 |
| Washington: | $32,496 |
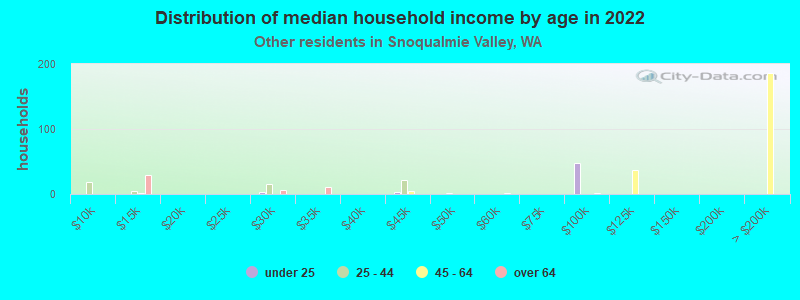
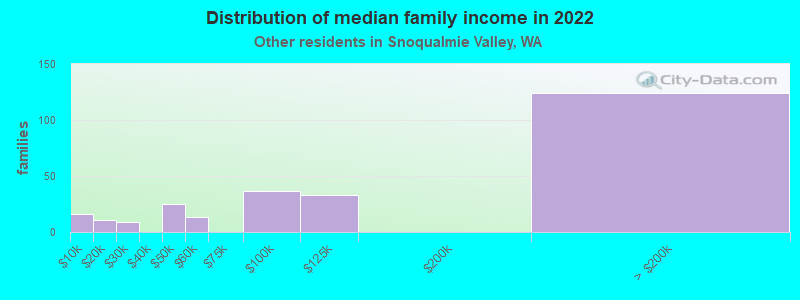
Income statistics for other residents
Number of households with income < $10k:| Snoqualmie Valley: | 7.1% (31) |
| State: | 5.3% (6,540) |
Number of households with income $10k - 20k:| Snoqualmie Valley: | 4.6% (20) |
| State: | 6.0% (7,385) |
Number of households with income $20k - 30k:| Snoqualmie Valley: | 3.0% (13) |
| State: | 7.5% (9,289) |
Number of households with income $30k - 40k:| Snoqualmie Valley: | 6.2% (27) |
| State: | 8.9% (11,015) |
Number of households with income $40k - 50k:| Snoqualmie Valley: | 6.4% (28) |
| State: | 7.6% (9,399) |
Number of households with income $50k - 60k:| Snoqualmie Valley: | 4.1% (18) |
| State: | 7.2% (8,867) |
Number of households with income $60k - 75k:| Snoqualmie Valley: | 13.2% (58) |
| State: | 10.5% (13,032) |
Number of households with income $75k - 100k:| Snoqualmie Valley: | 13.7% (60) |
| State: | 14.6% (18,007) |
Number of households with income $100k - 125k:| Snoqualmie Valley: | 14.6% (64) |
| Washington: | 12.2% (15,128) |
Number of households with income $125k - 150k:| Snoqualmie Valley: | 5.7% (25) |
| Washington: | 5.6% (6,950) |
Number of households with income $150k - 200k:| Snoqualmie Valley: | 10.9% (48) |
| Washington: | 7.1% (8,749) |
Number of households with income > $200k:| Snoqualmie Valley: | 10.7% (47) |
| State: | 7.5% (9,208) |
Aggregate household income in Snoqualmie Valley in 2022: $45,629,948
Median family income in Snoqualmie Valley in 2022:| Snoqualmie Valley: | $58,468 |
| State: | $72,588 |
Number of families with income < $10k:| Snoqualmie Valley: | 6.1% (16) |
| State: | 5.5% (5,287) |
Number of families with income $10k - 20k:| Snoqualmie Valley: | 4.1% (11) |
| State: | 4.0% (3,814) |
Number of families with income $20k - 30k:| Snoqualmie Valley: | 3.4% (9) |
| State: | 6.6% (6,293) |
Number of families with income $40k - 50k:| Snoqualmie Valley: | 9.5% (25) |
| State: | 8.0% (7,634) |
Number of families with income $50k - 60k:| Snoqualmie Valley: | 4.8% (13) |
| State: | 7.7% (7,357) |
Number of families with income $75k - 100k:| Snoqualmie Valley: | 13.9% (37) |
| State: | 14.5% (13,800) |
Number of families with income $100k - 125k:| Snoqualmie Valley: | 12.2% (33) |
| Washington: | 12.9% (12,298) |
Number of families with income > $200k:| Snoqualmie Valley: | 45.9% (124) |
| Washington: | 7.1% (6,764) |
Median non-family income in Snoqualmie Valley in 2022:| Snoqualmie Valley: | $72,575 |
| Washington: | $44,777 |
Change in median non-family income between 2000 and 2022:| Snoqualmie Valley, Washington: | +120.5% |
| State: | +84.2% |
Median per capita income in Snoqualmie Valley in 2022:| Snoqualmie Valley: | $45,788 |
| State: | $27,542 |
Change in median per capita income between 2000 and 2022:| Snoqualmie Valley, Washington: | +128.7% |
| Washington: | +167.8% |