South Benton, Washington (WA) income map, earnings map, and wages data
The median household income in South Benton, WA in 2022 was $65,904, which was 38.5% less than the median annual income of $91,306 across the entire state of Washington. Compared to the median income of $36,250 in 2000 this represents an increase of 45.0%. The per capita income in 2022 was $23,129, which means an increase of 45.7% compared to 2000 when it was $12,566.
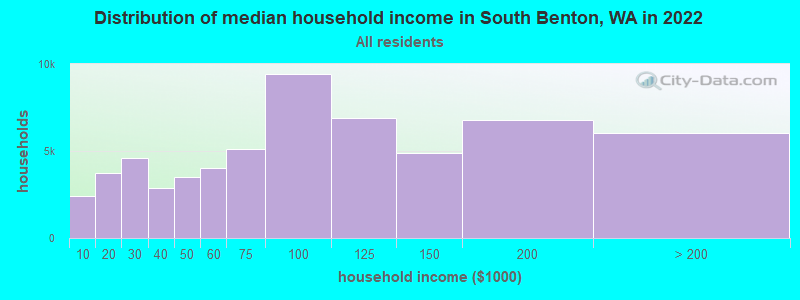
Income statistics for all residents
Median household income in South Benton, WA in 2022:| South Benton: | $65,905 |
| Washington: | $91,306 |
Change in median household income between 2000 and 2022:| South Benton, Washington: | +81.8% |
| State: | +99.5% |
Number of households with income < $10k:| South Benton: | 4.0% (2,414) |
| State: | 4.5% (139,331) |
Number of households with income $10k - 20k:| South Benton: | 6.2% (3,734) |
| Washington: | 5.0% (154,508) |
Number of households with income $20k - 30k:| South Benton: | 7.6% (4,602) |
| State: | 5.4% (166,555) |
Number of households with income $30k - 40k:| South Benton: | 4.7% (2,854) |
| State: | 5.5% (170,324) |
Number of households with income $40k - 50k:| South Benton: | 5.8% (3,489) |
| State: | 6.0% (183,941) |
Number of households with income $50k - 60k:| South Benton: | 6.7% (4,030) |
| Washington: | 6.1% (187,395) |
Number of households with income $60k - 75k:| South Benton: | 8.5% (5,138) |
| State: | 8.7% (266,771) |
Number of households with income $75k - 100k:| South Benton: | 15.7% (9,441) |
| State: | 13.1% (404,672) |
Number of households with income $100k - 125k:| South Benton: | 11.4% (6,882) |
| Washington: | 11.0% (337,911) |
Number of households with income $125k - 150k:| South Benton: | 8.1% (4,885) |
| State: | 8.0% (244,934) |
Number of households with income $150k - 200k:| South Benton: | 11.3% (6,791) |
| State: | 10.5% (323,812) |
Number of households with income > $200k:| South Benton: | 10.0% (6,022) |
| Washington: | 16.2% (499,799) |
Aggregate household income in South Benton in 2022: $40,814,578
Median family income in South Benton in 2022:| South Benton: | $78,738 |
| State: | $109,192 |
Median non-family income in South Benton in 2022:| South Benton: | $42,274 |
| State: | $57,299 |
Change in median non-family income between 2000 and 2022:| South Benton, Washington: | +81.5% |
| Washington: | +94.9% |
Median per capita income in South Benton in 2022:| South Benton: | $23,130 |
| State: | $50,764 |
Change in median per capita income between 2000 and 2022:| South Benton, Washington: | +84.1% |
| Washington: | +121.0% |
Income statistics for White residents
Median household income in South Benton, WA in 2022:| South Benton: | $74,498 |
| State: | $91,916 |
Change in median household income between 2000 and 2022:| South Benton, Washington: | +85.2% |
| State: | +95.4% |
Number of households with income < $10k:| South Benton: | 4.5% (2,192) |
| State: | 4.3% (95,850) |
Number of households with income $10k - 20k:| South Benton: | 6.1% (2,980) |
| Washington: | 4.8% (106,421) |
Number of households with income $20k - 30k:| South Benton: | 7.4% (3,602) |
| Washington: | 5.5% (122,860) |
Number of households with income $30k - 40k:| South Benton: | 4.5% (2,220) |
| State: | 5.4% (119,627) |
Number of households with income $40k - 50k:| South Benton: | 6.5% (3,205) |
| State: | 5.9% (132,276) |
Number of households with income $50k - 60k:| South Benton: | 6.0% (2,937) |
| Washington: | 6.1% (136,212) |
Number of households with income $60k - 75k:| South Benton: | 7.7% (3,747) |
| Washington: | 8.8% (196,086) |
Number of households with income $75k - 100k:| South Benton: | 14.0% (6,871) |
| State: | 13.4% (299,192) |
Number of households with income $100k - 125k:| South Benton: | 11.8% (5,759) |
| Washington: | 11.3% (252,209) |
Number of households with income $125k - 150k:| South Benton: | 8.5% (4,162) |
| Washington: | 7.9% (175,962) |
Number of households with income $150k - 200k:| South Benton: | 11.9% (5,834) |
| State: | 10.7% (239,156) |
Number of households with income > $200k:| South Benton: | 11.1% (5,444) |
| State: | 16.1% (359,917) |
Aggregate household income in South Benton in 2022: $28,818,594
Median family income in South Benton in 2022:| South Benton: | $82,159 |
| Washington: | $112,511 |
Number of families with income < $10k:| South Benton: | 3.4% (4) |
| State: | 2.4% (33,676) |
Number of families with income $10k - 20k:| South Benton: | 2.0% (3) |
| State: | 2.0% (28,228) |
Number of families with income $20k - 30k:| South Benton: | 23.5% (30) |
| State: | 2.9% (39,288) |
Number of families with income $30k - 40k:| South Benton: | 4.1% (5) |
| Washington: | 3.6% (50,190) |
Number of families with income $40k - 50k:| South Benton: | 15.1% (19) |
| State: | 4.6% (63,009) |
Number of families with income $50k - 60k:| South Benton: | 15.7% (20) |
| State: | 5.0% (69,270) |
Number of families with income $60k - 75k:| South Benton: | 4.3% (5) |
| State: | 8.2% (112,369) |
Number of families with income $75k - 100k:| South Benton: | 7.4% (9) |
| State: | 14.1% (194,214) |
Number of families with income $125k - 150k:| South Benton: | 8.7% (11) |
| State: | 9.5% (130,928) |
Number of families with income > $200k:| South Benton: | 15.9% (20) |
| State: | 20.8% (285,982) |
Median non-family income in South Benton in 2022:| South Benton: | $37,470 |
| Washington: | $56,103 |
Change in median non-family income between 2000 and 2022:| South Benton, Washington: | +76.3% |
| State: | +87.7% |
Median per capita income in South Benton in 2022:| South Benton: | $25,923 |
| Washington: | $55,212 |
Change in median per capita income between 2000 and 2022:| South Benton, Washington: | +99.1% |
| Washington: | +123.8% |
Income statistics for Hispanic or Latino residents
Median household income in South Benton, WA in 2022:| South Benton: | $59,584 |
| State: | $74,770 |
Change in median household income between 2000 and 2022:| South Benton, Washington: | +110.9% |
| State: | +128.3% |
Number of households with income < $10k:| South Benton: | 2.7% (345) |
| Washington: | 4.9% (14,456) |
Number of households with income $10k - 20k:| South Benton: | 5.0% (652) |
| State: | 5.3% (15,449) |
Number of households with income $20k - 30k:| South Benton: | 12.8% (1,655) |
| State: | 6.8% (20,016) |
Number of households with income $30k - 40k:| South Benton: | 5.0% (654) |
| State: | 7.7% (22,548) |
Number of households with income $40k - 50k:| South Benton: | 4.5% (585) |
| State: | 7.3% (21,450) |
Number of households with income $50k - 60k:| South Benton: | 12.7% (1,653) |
| State: | 7.7% (22,744) |
Number of households with income $60k - 75k:| South Benton: | 8.5% (1,107) |
| State: | 10.5% (30,737) |
Number of households with income $75k - 100k:| South Benton: | 16.9% (2,195) |
| State: | 14.9% (43,843) |
Number of households with income $100k - 125k:| South Benton: | 11.1% (1,436) |
| State: | 11.1% (32,554) |
Number of households with income $125k - 150k:| South Benton: | 7.0% (903) |
| Washington: | 7.4% (21,624) |
Number of households with income $150k - 200k:| South Benton: | 9.6% (1,239) |
| State: | 7.3% (21,360) |
Number of households with income > $200k:| South Benton: | 4.2% (541) |
| State: | 9.2% (27,055) |
Aggregate household income in South Benton in 2022: $11,035,161
Median family income in South Benton in 2022:| South Benton: | $44,239 |
| State: | $76,866 |
Number of families with income < $10k:| South Benton: | 5.6% (3) |
| State: | 4.4% (9,443) |
Number of families with income $20k - 30k:| South Benton: | 17.4% (8) |
| State: | 5.6% (12,052) |
Number of families with income $30k - 40k:| South Benton: | 4.1% (2) |
| Washington: | 8.3% (17,803) |
Number of families with income $40k - 50k:| South Benton: | 27.7% (13) |
| Washington: | 7.7% (16,361) |
Number of families with income $50k - 60k:| South Benton: | 23.3% (11) |
| State: | 7.9% (16,852) |
Number of families with income $60k - 75k:| South Benton: | 4.7% (2) |
| State: | 11.4% (24,342) |
Number of families with income $75k - 100k:| South Benton: | 8.2% (4) |
| State: | 14.4% (30,698) |
Number of families with income $125k - 150k:| South Benton: | 7.3% (3) |
| State: | 7.5% (16,099) |
Number of families with income > $200k:| South Benton: | 1.8% (1) |
| State: | 9.7% (20,653) |
Median non-family income in South Benton in 2022:| South Benton: | $61,364 |
| State: | $54,173 |
Change in median non-family income between 2000 and 2022:| South Benton, Washington: | +99.8% |
| State: | +105.8% |
Median per capita income in South Benton in 2022:| South Benton: | $18,007 |
| Washington: | $28,252 |
Change in median per capita income between 2000 and 2022:| South Benton, Washington: | +139.7% |
| State: | +150.2% |
Income statistics for Multirace residents
Median household income in South Benton, WA in 2022:| South Benton: | $125,630 |
| Washington: | $84,303 |
Change in median household income between 2000 and 2022:| South Benton, Washington: | +143.6% |
| State: | +125.7% |
Number of households with income < $10k:| South Benton: | 2.7% (375) |
| State: | 4.3% (12,040) |
Number of households with income $10k - 20k:| South Benton: | 7.5% (1,034) |
| Washington: | 6.6% (18,437) |
Number of households with income $20k - 30k:| South Benton: | 6.5% (895) |
| State: | 5.2% (14,559) |
Number of households with income $30k - 40k:| South Benton: | 2.8% (387) |
| State: | 6.7% (18,491) |
Number of households with income $40k - 50k:| South Benton: | 3.6% (501) |
| State: | 6.3% (17,459) |
Number of households with income $50k - 60k:| South Benton: | 5.3% (730) |
| Washington: | 6.9% (19,086) |
Number of households with income $60k - 75k:| South Benton: | 11.7% (1,626) |
| State: | 9.1% (25,310) |
Number of households with income $75k - 100k:| South Benton: | 24.7% (3,422) |
| State: | 13.5% (37,493) |
Number of households with income $100k - 125k:| South Benton: | 15.3% (2,122) |
| State: | 10.7% (29,626) |
Number of households with income $125k - 150k:| South Benton: | 5.2% (725) |
| State: | 8.6% (23,899) |
Number of households with income $150k - 200k:| South Benton: | 10.8% (1,489) |
| State: | 10.2% (28,214) |
Number of households with income > $200k:| South Benton: | 3.9% (541) |
| State: | 11.9% (32,947) |
Aggregate household income in South Benton in 2022: $7,442,513
Median family income in South Benton in 2022:| South Benton: | $120,880 |
| State: | $95,629 |
Number of families with income $50k - 60k:| South Benton: | 100.0% (21) |
| State: | 5.6% (9,922) |
Median non-family income in South Benton in 2022:| South Benton: | $120,408 |
| State: | $56,573 |
Median per capita income in South Benton in 2022:| South Benton: | $41,430 |
| State: | $32,496 |
Change in median per capita income between 2000 and 2022:| South Benton, Washington: | +110.0% |
| State: | +156.8% |
Income statistics for other residents
Number of households with income < $10k:| South Benton: | 5.0% (2) |
| State: | 5.3% (6,540) |
Number of households with income $10k - 20k:| South Benton: | 7.5% (3) |
| State: | 6.0% (7,385) |
Number of households with income $20k - 30k:| South Benton: | 7.5% (3) |
| Washington: | 7.5% (9,289) |
Number of households with income $30k - 40k:| South Benton: | 10.0% (4) |
| State: | 8.9% (11,015) |
Number of households with income $40k - 50k:| South Benton: | 10.0% (4) |
| Washington: | 7.6% (9,399) |
Number of households with income $50k - 60k:| South Benton: | 7.5% (3) |
| State: | 7.2% (8,867) |
Number of households with income $60k - 75k:| South Benton: | 10.0% (4) |
| State: | 10.5% (13,032) |
Number of households with income $75k - 100k:| South Benton: | 12.5% (5) |
| Washington: | 14.6% (18,007) |
Number of households with income $100k - 125k:| South Benton: | 12.5% (5) |
| State: | 12.2% (15,128) |
Number of households with income $125k - 150k:| South Benton: | 5.0% (2) |
| State: | 5.6% (6,950) |
Number of households with income $150k - 200k:| South Benton: | 5.0% (2) |
| Washington: | 7.1% (8,749) |
Number of households with income > $200k:| South Benton: | 7.5% (3) |
| State: | 7.5% (9,208) |
Aggregate household income in South Benton in 2022: $3,297,373
Median family income in South Benton in 2022:| South Benton: | $54,491 |
| State: | $72,588 |
Number of families with income $10k - 20k:| South Benton: | 20.6% (4) |
| Washington: | 4.0% (3,814) |
Number of families with income $20k - 30k:| South Benton: | 26.6% (6) |
| Washington: | 6.6% (6,293) |
Number of families with income $30k - 40k:| South Benton: | 32.8% (7) |
| State: | 9.2% (8,827) |
Number of families with income $40k - 50k:| South Benton: | 20.0% (4) |
| Washington: | 8.0% (7,634) |
Median non-family income in South Benton in 2022:| South Benton: | $38,353 |
| State: | $44,777 |
Change in median non-family income between 2000 and 2022:| South Benton, Washington: | +22.7% |
| State: | +84.2% |
Median per capita income in South Benton in 2022:| South Benton: | $18,028 |
| State: | $27,542 |
Change in median per capita income between 2000 and 2022:| South Benton, Washington: | +126.1% |
| State: | +167.8% |