South and East Osceola, Florida (FL) income map, earnings map, and wages data
The median household income in South and East Osceola, FL in 2022 was $63,888, which was 8.5% less than the median annual income of $69,303 across the entire state of Florida. Compared to the median income of $38,587 in 2000 this represents an increase of 39.6%. The per capita income in 2022 was $30,312, which means an increase of 44.1% compared to 2000 when it was $16,938.
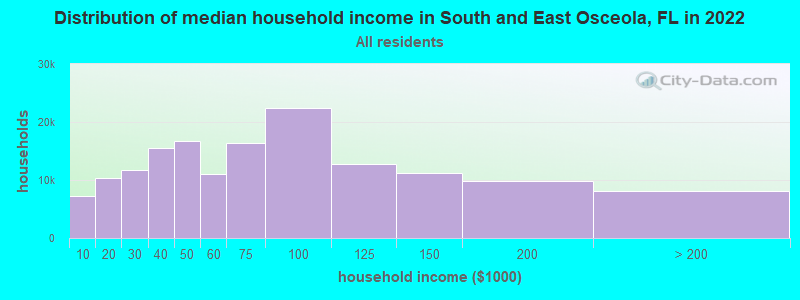
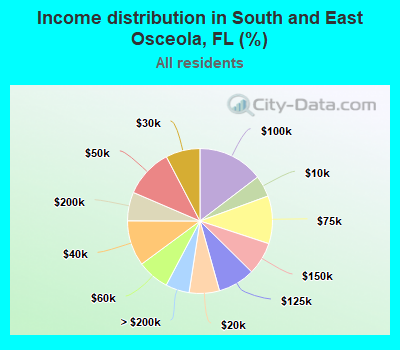
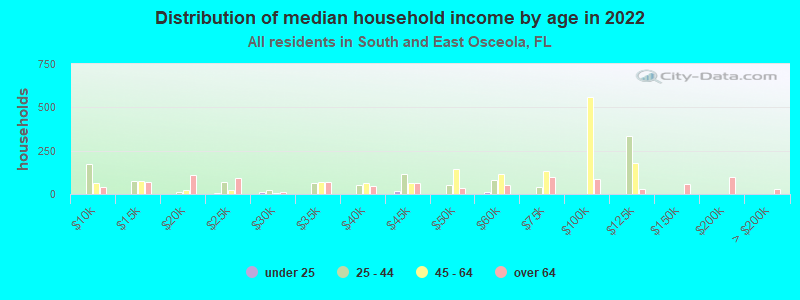
Income statistics for all residents
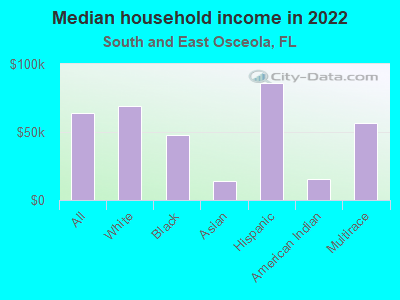
Median household income in South and East Osceola, FL in 2022:| South and East Osceola: | $63,889 |
| State: | $69,303 |
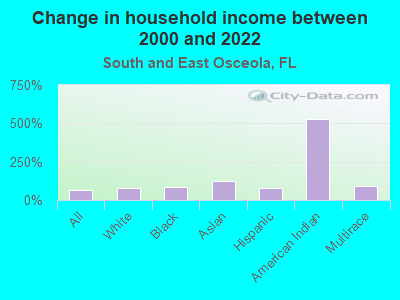
Change in median household income between 2000 and 2022:| South and East Osceola, Florida: | +65.6% |
| State: | +78.5% |
Number of households with income < $10k:| South and East Osceola: | 4.8% (7,295) |
| Florida: | 5.6% (495,572) |
Number of households with income $10k - 20k:| South and East Osceola: | 6.7% (10,327) |
| State: | 6.9% (612,816) |
Number of households with income $20k - 30k:| South and East Osceola: | 7.7% (11,740) |
| Florida: | 7.7% (679,608) |
Number of households with income $30k - 40k:| South and East Osceola: | 10.2% (15,564) |
| State: | 8.0% (710,126) |
Number of households with income $40k - 50k:| South and East Osceola: | 10.9% (16,649) |
| State: | 7.8% (687,940) |
Number of households with income $50k - 60k:| South and East Osceola: | 7.2% (10,970) |
| State: | 7.6% (675,076) |
Number of households with income $60k - 75k:| South and East Osceola: | 10.7% (16,324) |
| State: | 9.7% (858,354) |
Number of households with income $75k - 100k:| South and East Osceola: | 14.6% (22,418) |
| State: | 13.4% (1,181,540) |
Number of households with income $100k - 125k:| South and East Osceola: | 8.3% (12,685) |
| Florida: | 9.6% (851,620) |
Number of households with income $125k - 150k:| South and East Osceola: | 7.3% (11,209) |
| State: | 6.4% (560,854) |
Number of households with income $150k - 200k:| South and East Osceola: | 6.4% (9,809) |
| Florida: | 7.7% (677,227) |
Number of households with income > $200k:| South and East Osceola: | 5.3% (8,109) |
| Florida: | 9.5% (835,661) |
Aggregate household income in South and East Osceola in 2022: $492,749,152
Median family income in South and East Osceola in 2022:| South and East Osceola: | $70,704 |
| Florida: | $83,410 |
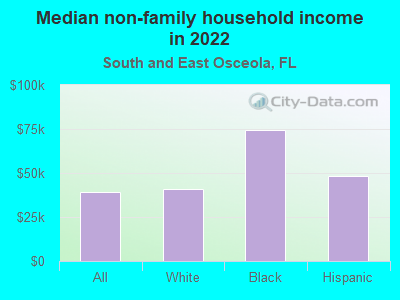
Median non-family income in South and East Osceola in 2022:| South and East Osceola: | $38,921 |
| Florida: | $43,665 |
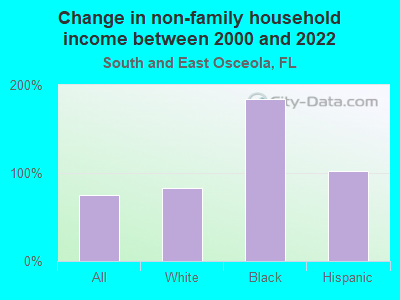
Change in median non-family income between 2000 and 2022:| South and East Osceola, Florida: | +75.3% |
| State: | +76.1% |
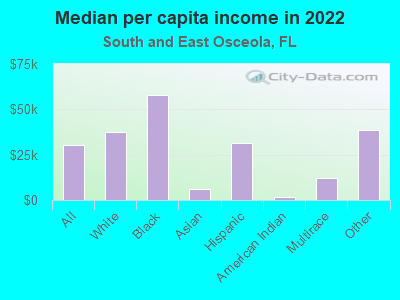
Median per capita income in South and East Osceola in 2022:| South and East Osceola: | $30,313 |
| Florida: | $40,278 |
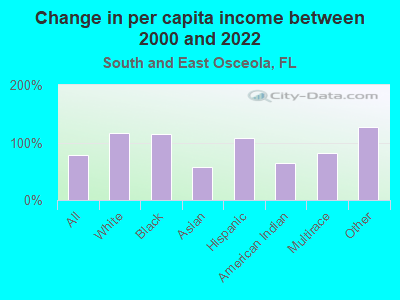
Change in median per capita income between 2000 and 2022:| South and East Osceola, Florida: | +79.0% |
| State: | +86.8% |
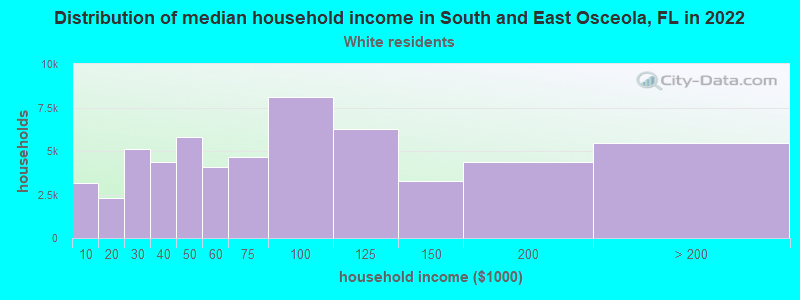
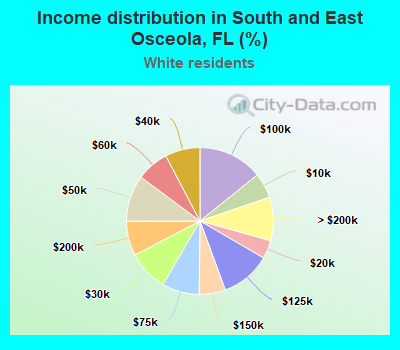
Income statistics for White residents
Median household income in South and East Osceola, FL in 2022:| South and East Osceola: | $69,037 |
| State: | $74,559 |
Change in median household income between 2000 and 2022:| South and East Osceola, Florida: | +77.5% |
| Florida: | +82.7% |
Number of households with income < $10k:| South and East Osceola: | 5.5% (3,155) |
| State: | 4.9% (270,741) |
Number of households with income $10k - 20k:| South and East Osceola: | 4.0% (2,308) |
| Florida: | 6.1% (337,688) |
Number of households with income $20k - 30k:| South and East Osceola: | 9.0% (5,113) |
| Florida: | 7.2% (395,954) |
Number of households with income $30k - 40k:| South and East Osceola: | 7.7% (4,374) |
| State: | 7.5% (411,553) |
Number of households with income $40k - 50k:| South and East Osceola: | 10.2% (5,821) |
| State: | 7.5% (410,613) |
Number of households with income $50k - 60k:| South and East Osceola: | 7.1% (4,076) |
| State: | 7.6% (416,709) |
Number of households with income $60k - 75k:| South and East Osceola: | 8.2% (4,682) |
| State: | 9.5% (523,639) |
Number of households with income $75k - 100k:| South and East Osceola: | 14.2% (8,122) |
| State: | 13.3% (732,030) |
Number of households with income $100k - 125k:| South and East Osceola: | 11.0% (6,288) |
| State: | 10.2% (559,463) |
Number of households with income $125k - 150k:| South and East Osceola: | 5.8% (3,284) |
| Florida: | 6.9% (379,323) |
Number of households with income $150k - 200k:| South and East Osceola: | 7.6% (4,346) |
| Florida: | 8.3% (456,076) |
Number of households with income > $200k:| South and East Osceola: | 9.6% (5,453) |
| Florida: | 11.1% (610,258) |
Aggregate household income in South and East Osceola in 2022: $217,466,187
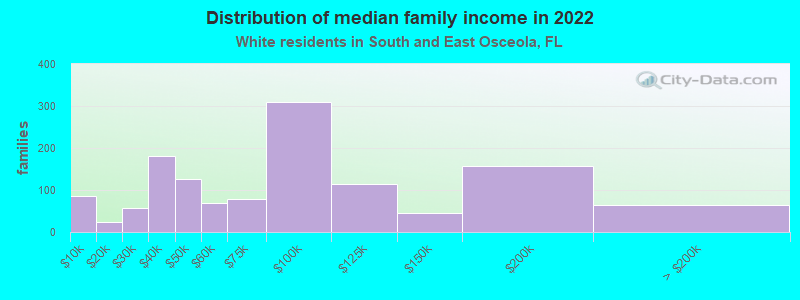
Median family income in South and East Osceola in 2022:| South and East Osceola: | $79,712 |
| State: | $93,222 |
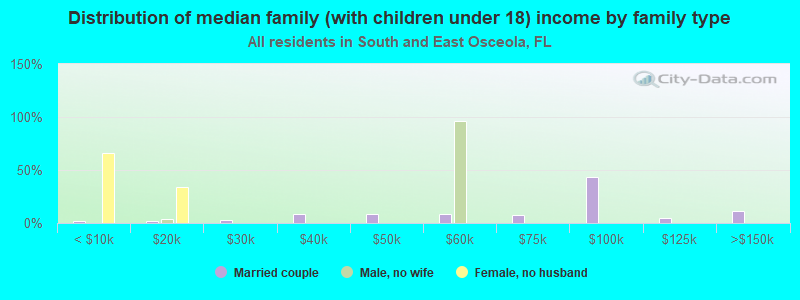
Number of families with income < $10k:| South and East Osceola: | 6.6% (86) |
| State: | 2.6% (89,721) |
Number of families with income $10k - 20k:| South and East Osceola: | 1.7% (23) |
| State: | 3.0% (101,720) |
Number of families with income $20k - 30k:| South and East Osceola: | 4.4% (57) |
| Florida: | 4.5% (154,795) |
Number of families with income $30k - 40k:| South and East Osceola: | 13.7% (180) |
| State: | 5.7% (194,218) |
Number of families with income $40k - 50k:| South and East Osceola: | 9.7% (127) |
| State: | 6.4% (219,550) |
Number of families with income $50k - 60k:| South and East Osceola: | 5.3% (69) |
| Florida: | 7.0% (238,045) |
Number of families with income $60k - 75k:| South and East Osceola: | 6.0% (79) |
| State: | 9.6% (328,141) |
Number of families with income $75k - 100k:| South and East Osceola: | 23.6% (309) |
| Florida: | 14.8% (503,988) |
Number of families with income $100k - 125k:| South and East Osceola: | 8.7% (114) |
| State: | 12.0% (409,184) |
Number of families with income $125k - 150k:| South and East Osceola: | 3.5% (45) |
| State: | 8.8% (298,895) |
Number of families with income $150k - 200k:| South and East Osceola: | 12.0% (158) |
| State: | 10.6% (359,290) |
Number of families with income > $200k:| South and East Osceola: | 4.9% (64) |
| State: | 14.9% (507,279) |
Median non-family income in South and East Osceola in 2022:| South and East Osceola: | $40,789 |
| State: | $46,674 |
Change in median non-family income between 2000 and 2022:| South and East Osceola, Florida: | +83.0% |
| Florida: | +81.2% |
Median per capita income in South and East Osceola in 2022:| South and East Osceola: | $37,575 |
| State: | $48,094 |
Change in median per capita income between 2000 and 2022:| South and East Osceola, Florida: | +117.4% |
| State: | +101.1% |
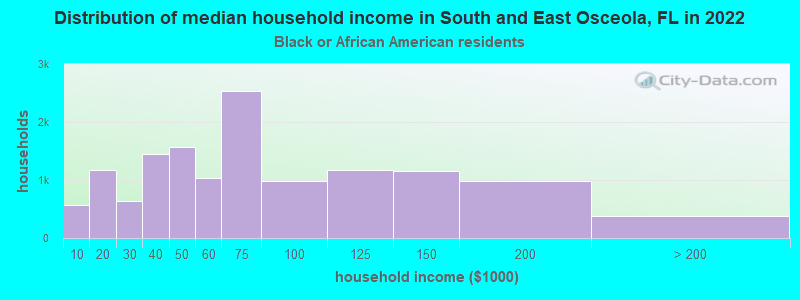
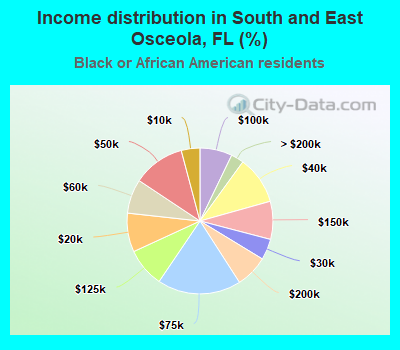
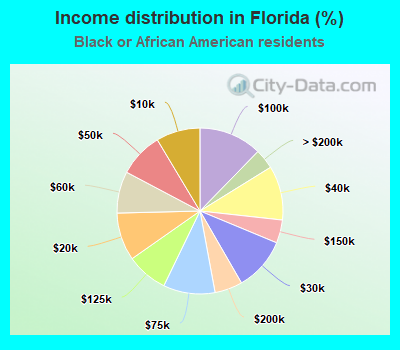
Income statistics for Black or African American residents
Median household income in South and East Osceola, FL in 2022:| South and East Osceola: | $47,869 |
| State: | $52,796 |
Change in median household income between 2000 and 2022:| South and East Osceola, Florida: | +82.4% |
| State: | +88.3% |
Number of households with income < $10k:| South and East Osceola: | 4.1% (562) |
| State: | 8.6% (101,054) |
Number of households with income $10k - 20k:| South and East Osceola: | 8.6% (1,172) |
| State: | 9.3% (110,079) |
Number of households with income $20k - 30k:| South and East Osceola: | 4.6% (631) |
| State: | 10.4% (122,525) |
Number of households with income $30k - 40k:| South and East Osceola: | 10.7% (1,452) |
| State: | 10.6% (124,619) |
Number of households with income $40k - 50k:| South and East Osceola: | 11.5% (1,571) |
| Florida: | 8.7% (102,300) |
Number of households with income $50k - 60k:| South and East Osceola: | 7.6% (1,035) |
| State: | 8.1% (95,745) |
Number of households with income $60k - 75k:| South and East Osceola: | 18.6% (2,528) |
| Florida: | 10.1% (118,757) |
Number of households with income $75k - 100k:| South and East Osceola: | 7.2% (975) |
| State: | 12.3% (144,919) |
Number of households with income $100k - 125k:| South and East Osceola: | 8.7% (1,178) |
| State: | 8.1% (95,395) |
Number of households with income $125k - 150k:| South and East Osceola: | 8.4% (1,148) |
| Florida: | 4.5% (53,276) |
Number of households with income $150k - 200k:| South and East Osceola: | 7.2% (981) |
| Florida: | 5.4% (63,827) |
Number of households with income > $200k:| South and East Osceola: | 2.8% (385) |
| Florida: | 3.9% (45,695) |
Aggregate household income in South and East Osceola in 2022: $1,421,771
Median non-family income in South and East Osceola in 2022:| South and East Osceola: | $74,638 |
| State: | $34,782 |
Median per capita income in South and East Osceola in 2022:| South and East Osceola: | $58,144 |
| State: | $26,700 |
Change in median per capita income between 2000 and 2022:| South and East Osceola, Florida: | +115.2% |
| State: | +112.2% |
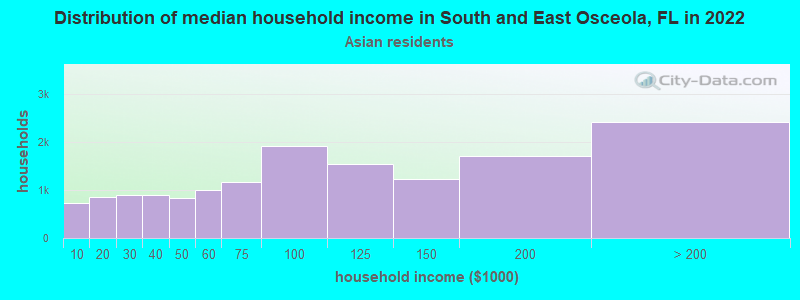
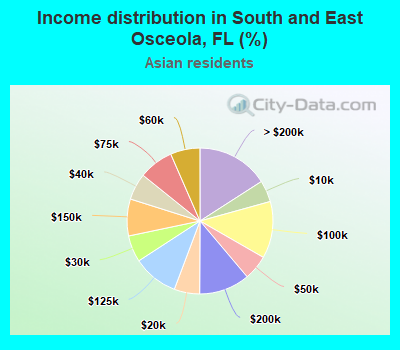
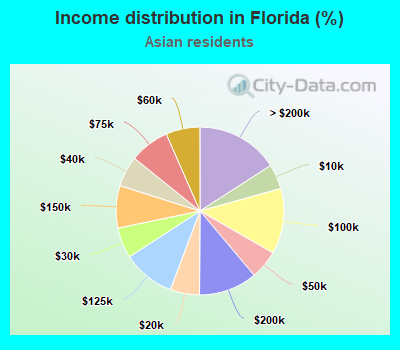
Income statistics for Asian residents
Median household income in South and East Osceola, FL in 2022:| South and East Osceola: | $14,160 |
| State: | $89,645 |
Change in median household income between 2000 and 2022:| South and East Osceola, Florida: | +126.6% |
| Florida: | +100.2% |
Number of households with income < $10k:| South and East Osceola: | 4.8% (725) |
| State: | 4.8% (10,378) |
Number of households with income $10k - 20k:| South and East Osceola: | 5.7% (857) |
| Florida: | 5.7% (12,222) |
Number of households with income $20k - 30k:| South and East Osceola: | 5.9% (892) |
| State: | 5.9% (12,739) |
Number of households with income $30k - 40k:| South and East Osceola: | 5.9% (895) |
| State: | 5.9% (12,759) |
Number of households with income $40k - 50k:| South and East Osceola: | 5.5% (839) |
| Florida: | 5.6% (12,009) |
Number of households with income $50k - 60k:| South and East Osceola: | 6.6% (993) |
| Florida: | 6.5% (14,158) |
Number of households with income $60k - 75k:| South and East Osceola: | 7.7% (1,162) |
| Florida: | 7.7% (16,568) |
Number of households with income $75k - 100k:| South and East Osceola: | 12.6% (1,910) |
| Florida: | 12.6% (27,273) |
Number of households with income $100k - 125k:| South and East Osceola: | 10.1% (1,530) |
| State: | 10.1% (21,821) |
Number of households with income $125k - 150k:| South and East Osceola: | 8.2% (1,235) |
| State: | 8.2% (17,650) |
Number of households with income $150k - 200k:| South and East Osceola: | 11.2% (1,702) |
| State: | 11.2% (24,296) |
Number of households with income > $200k:| South and East Osceola: | 15.9% (2,411) |
| State: | 15.9% (34,363) |
Aggregate household income in South and East Osceola in 2022: $212,714
Median family income in South and East Osceola in 2022:| South and East Osceola: | $15,032 |
| State: | $101,833 |
Median per capita income in South and East Osceola in 2022:| South and East Osceola: | $6,155 |
| Florida: | $46,365 |
Change in median per capita income between 2000 and 2022:| South and East Osceola, Florida: | +57.5% |
| Florida: | +127.0% |
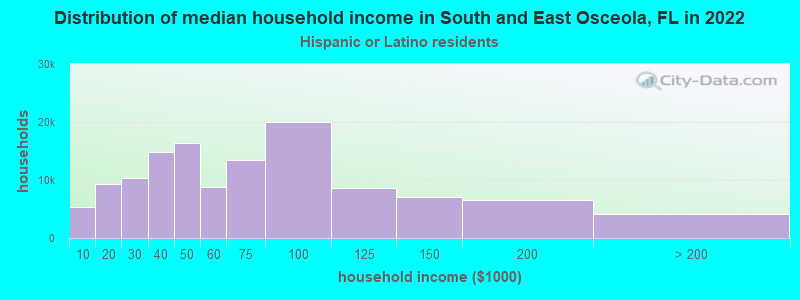
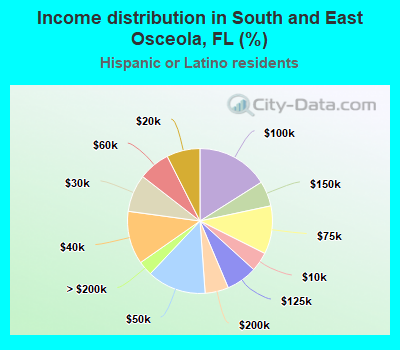
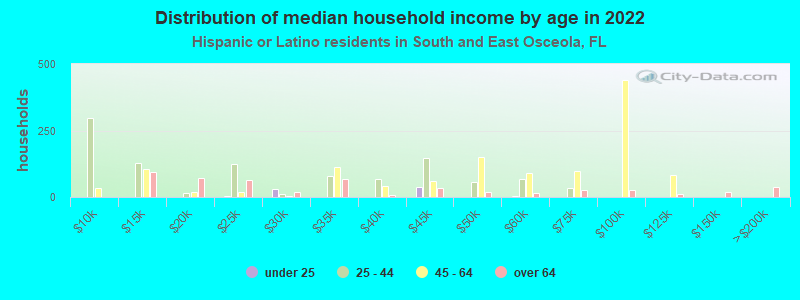
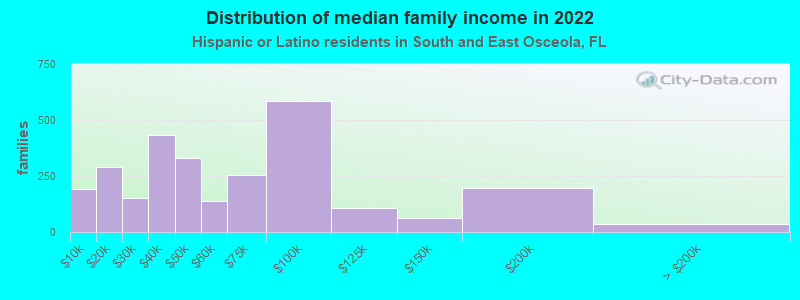
Income statistics for Hispanic or Latino residents
Median household income in South and East Osceola, FL in 2022:| South and East Osceola: | $85,927 |
| Florida: | $64,482 |
Change in median household income between 2000 and 2022:| South and East Osceola, Florida: | +77.4% |
| Florida: | +87.8% |
Number of households with income < $10k:| South and East Osceola: | 4.3% (5,386) |
| State: | 5.9% (120,841) |
Number of households with income $10k - 20k:| South and East Osceola: | 7.4% (9,289) |
| Florida: | 7.8% (158,824) |
Number of households with income $20k - 30k:| South and East Osceola: | 8.4% (10,426) |
| State: | 7.8% (158,797) |
Number of households with income $30k - 40k:| South and East Osceola: | 11.9% (14,783) |
| State: | 8.4% (171,736) |
Number of households with income $40k - 50k:| South and East Osceola: | 13.2% (16,409) |
| State: | 8.5% (174,397) |
Number of households with income $50k - 60k:| South and East Osceola: | 7.0% (8,790) |
| Florida: | 7.9% (160,816) |
Number of households with income $60k - 75k:| South and East Osceola: | 10.7% (13,403) |
| State: | 10.6% (215,567) |
Number of households with income $75k - 100k:| South and East Osceola: | 16.0% (20,005) |
| State: | 14.1% (288,590) |
Number of households with income $100k - 125k:| South and East Osceola: | 6.9% (8,635) |
| State: | 9.4% (192,146) |
Number of households with income $125k - 150k:| South and East Osceola: | 5.6% (7,008) |
| State: | 5.7% (115,883) |
Number of households with income $150k - 200k:| South and East Osceola: | 5.2% (6,524) |
| Florida: | 6.8% (139,384) |
Number of households with income > $200k:| South and East Osceola: | 3.3% (4,076) |
| State: | 7.0% (143,116) |
Aggregate household income in South and East Osceola in 2022: $46,518,650
Median family income in South and East Osceola in 2022:| South and East Osceola: | $98,474 |
| State: | $70,631 |
Number of families with income < $10k:| South and East Osceola: | 6.9% (193) |
| State: | 4.3% (62,648) |
Number of families with income $10k - 20k:| South and East Osceola: | 10.4% (288) |
| State: | 4.8% (70,980) |
Number of families with income $20k - 30k:| South and East Osceola: | 5.5% (154) |
| State: | 7.7% (112,768) |
Number of families with income $30k - 40k:| South and East Osceola: | 15.6% (433) |
| State: | 8.3% (121,408) |
Number of families with income $40k - 50k:| South and East Osceola: | 12.0% (332) |
| State: | 8.6% (127,058) |
Number of families with income $50k - 60k:| South and East Osceola: | 4.9% (137) |
| State: | 8.2% (121,066) |
Number of families with income $60k - 75k:| South and East Osceola: | 9.1% (254) |
| State: | 11.3% (165,746) |
Number of families with income $75k - 100k:| South and East Osceola: | 21.1% (587) |
| State: | 14.5% (213,504) |
Number of families with income $100k - 125k:| South and East Osceola: | 3.8% (106) |
| Florida: | 10.3% (151,829) |
Number of families with income $125k - 150k:| South and East Osceola: | 2.2% (62) |
| State: | 6.4% (93,499) |
Number of families with income $150k - 200k:| South and East Osceola: | 7.1% (198) |
| State: | 7.5% (109,536) |
Number of families with income > $200k:| South and East Osceola: | 1.2% (35) |
| State: | 8.1% (118,912) |
Median non-family income in South and East Osceola in 2022:| South and East Osceola: | $48,069 |
| State: | $40,313 |
Change in median non-family income between 2000 and 2022:| South and East Osceola, Florida: | +102.4% |
| State: | +106.7% |
Median per capita income in South and East Osceola in 2022:| South and East Osceola: | $31,574 |
| Florida: | $30,491 |
Change in median per capita income between 2000 and 2022:| South and East Osceola, Florida: | +106.8% |
| State: | +100.6% |
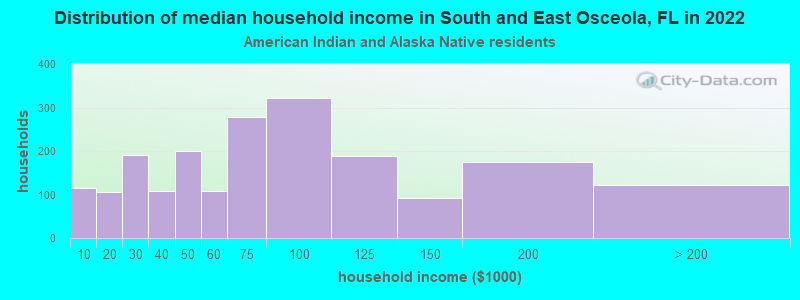
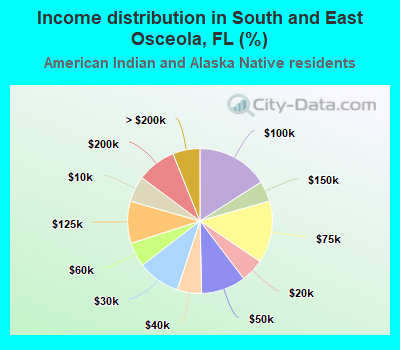
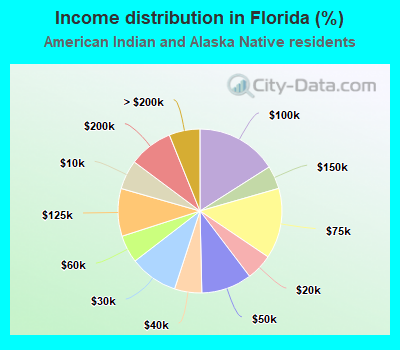
Income statistics for American Indian and Alaska Native residents
Median household income in South and East Osceola, FL in 2022:| South and East Osceola: | $15,684 |
| Florida: | $70,243 |
Number of households with income < $10k:| South and East Osceola: | 5.8% (116) |
| State: | 5.8% (1,524) |
Number of households with income $10k - 20k:| South and East Osceola: | 5.2% (105) |
| State: | 5.2% (1,374) |
Number of households with income $20k - 30k:| South and East Osceola: | 9.5% (191) |
| State: | 9.5% (2,512) |
Number of households with income $30k - 40k:| South and East Osceola: | 5.4% (109) |
| Florida: | 5.4% (1,420) |
Number of households with income $40k - 50k:| South and East Osceola: | 10.0% (200) |
| State: | 10.0% (2,632) |
Number of households with income $50k - 60k:| South and East Osceola: | 5.4% (109) |
| State: | 5.5% (1,437) |
Number of households with income $60k - 75k:| South and East Osceola: | 13.9% (279) |
| State: | 13.9% (3,664) |
Number of households with income $75k - 100k:| South and East Osceola: | 16.0% (321) |
| State: | 16.0% (4,217) |
Number of households with income $100k - 125k:| South and East Osceola: | 9.4% (189) |
| Florida: | 9.4% (2,483) |
Number of households with income $125k - 150k:| South and East Osceola: | 4.6% (92) |
| State: | 4.6% (1,204) |
Number of households with income $150k - 200k:| South and East Osceola: | 8.7% (175) |
| State: | 8.7% (2,294) |
Number of households with income > $200k:| South and East Osceola: | 6.1% (122) |
| Florida: | 6.1% (1,604) |
Aggregate household income in South and East Osceola in 2022: $18,010
Median per capita income in South and East Osceola in 2022:| South and East Osceola: | $1,649 |
| State: | $25,874 |
Change in median per capita income between 2000 and 2022:| South and East Osceola, Florida: | +64.9% |
| State: | +55.9% |
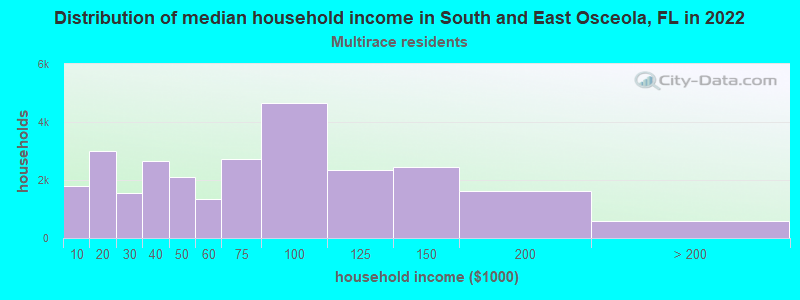
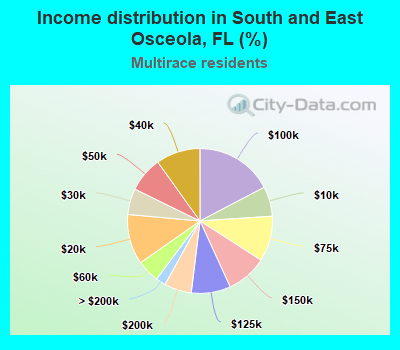
Income statistics for Multirace residents
Median household income in South and East Osceola, FL in 2022:| South and East Osceola: | $56,813 |
| State: | $66,563 |
Change in median household income between 2000 and 2022:| South and East Osceola, Florida: | +94.0% |
| State: | +110.9% |
Number of households with income < $10k:| South and East Osceola: | 6.6% (1,786) |
| State: | 5.8% (83,509) |
Number of households with income $10k - 20k:| South and East Osceola: | 11.2% (3,009) |
| State: | 8.3% (119,018) |
Number of households with income $20k - 30k:| South and East Osceola: | 5.8% (1,563) |
| State: | 7.6% (108,964) |
Number of households with income $30k - 40k:| South and East Osceola: | 9.9% (2,660) |
| State: | 7.8% (112,273) |
Number of households with income $40k - 50k:| South and East Osceola: | 7.9% (2,113) |
| Florida: | 8.1% (116,736) |
Number of households with income $50k - 60k:| South and East Osceola: | 5.0% (1,358) |
| State: | 7.5% (108,182) |
Number of households with income $60k - 75k:| South and East Osceola: | 10.2% (2,733) |
| State: | 10.0% (142,830) |
Number of households with income $75k - 100k:| South and East Osceola: | 17.3% (4,661) |
| State: | 14.3% (205,066) |
Number of households with income $100k - 125k:| South and East Osceola: | 8.8% (2,362) |
| State: | 9.1% (130,357) |
Number of households with income $125k - 150k:| South and East Osceola: | 9.1% (2,439) |
| State: | 5.8% (83,865) |
Number of households with income $150k - 200k:| South and East Osceola: | 6.1% (1,636) |
| Florida: | 7.2% (103,107) |
Number of households with income > $200k:| South and East Osceola: | 2.2% (593) |
| State: | 8.4% (120,637) |
Aggregate household income in South and East Osceola in 2022: $22,909,059
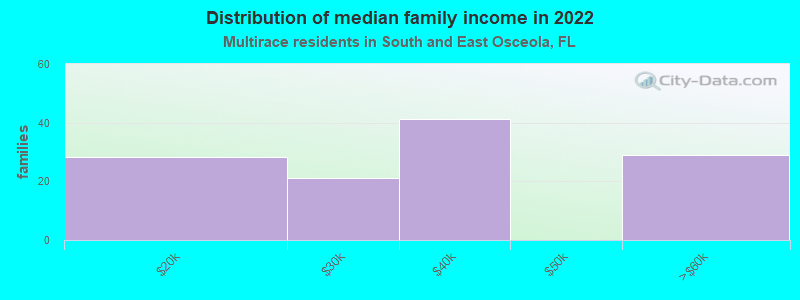
Median family income in South and East Osceola in 2022:| South and East Osceola: | $64,623 |
| Florida: | $74,522 |
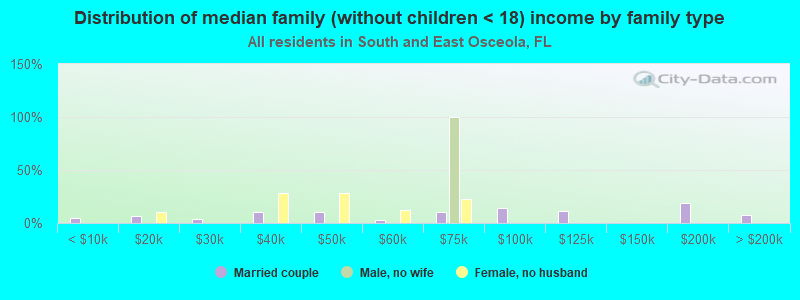
Number of families with income $10k - 20k:| South and East Osceola: | 23.7% (28) |
| Florida: | 4.8% (48,964) |
Number of families with income $20k - 30k:| South and East Osceola: | 17.6% (21) |
| Florida: | 7.2% (73,049) |
Number of families with income $30k - 40k:| South and East Osceola: | 34.5% (41) |
| State: | 7.5% (76,278) |
Number of families with income $50k - 60k:| South and East Osceola: | 24.2% (29) |
| Florida: | 7.8% (78,864) |
Median per capita income in South and East Osceola in 2022:| South and East Osceola: | $11,885 |
| State: | $31,893 |
Change in median per capita income between 2000 and 2022:| South and East Osceola, Florida: | +82.2% |
| State: | +136.0% |
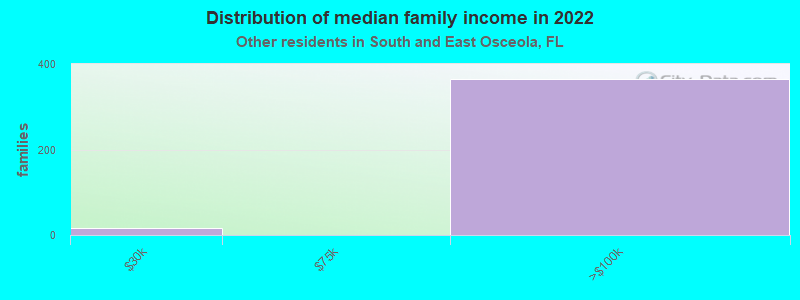
Income statistics for other residents
Number of households with income < $10k:| South and East Osceola: | 3.0% (6) |
| Florida: | 6.1% (28,059) |
Number of households with income $10k - 20k:| South and East Osceola: | 7.0% (14) |
| State: | 7.0% (32,348) |
Number of households with income $20k - 30k:| South and East Osceola: | 9.0% (18) |
| Florida: | 8.0% (36,819) |
Number of households with income $30k - 40k:| South and East Osceola: | 14.0% (28) |
| State: | 10.2% (47,209) |
Number of households with income $40k - 50k:| South and East Osceola: | 14.5% (29) |
| State: | 9.3% (43,006) |
Number of households with income $50k - 60k:| South and East Osceola: | 8.0% (16) |
| Florida: | 8.2% (38,018) |
Number of households with income $60k - 75k:| South and East Osceola: | 12.0% (24) |
| Florida: | 11.4% (52,577) |
Number of households with income $75k - 100k:| South and East Osceola: | 16.0% (32) |
| State: | 14.6% (67,588) |
Number of households with income $100k - 125k:| South and East Osceola: | 4.0% (8) |
| State: | 9.0% (41,737) |
Number of households with income $125k - 150k:| South and East Osceola: | 6.5% (13) |
| State: | 5.4% (24,841) |
Number of households with income $150k - 200k:| South and East Osceola: | 3.0% (6) |
| Florida: | 5.9% (27,334) |
Number of households with income > $200k:| South and East Osceola: | 3.0% (6) |
| State: | 5.0% (22,928) |
Aggregate household income in South and East Osceola in 2022: $13,212,984
Median family income in South and East Osceola in 2022:| South and East Osceola: | $154,259 |
| Florida: | $63,742 |
Number of families with income $20k - 30k:| South and East Osceola: | 4.5% (17) |
| State: | 7.7% (26,250) |
Number of families with income $75k - 100k:| South and East Osceola: | 95.5% (366) |
| State: | 14.5% (49,136) |
Median per capita income in South and East Osceola in 2022:| South and East Osceola: | $38,756 |
| Florida: | $27,276 |
Change in median per capita income between 2000 and 2022:| South and East Osceola, Florida: | +127.0% |
| State: | +138.6% |