Spring Valley, Texas (TX) income map, earnings map, and wages data
The median household income in Spring Valley, TX in 2022 was $155,469, which was 53.5% greater than the median annual income of $72,284 across the entire state of Texas. Compared to the median income of $96,392 in 2000 this represents an increase of 38.0%. The per capita income in 2022 was $79,301, which means an increase of 43.4% compared to 2000 when it was $44,912.
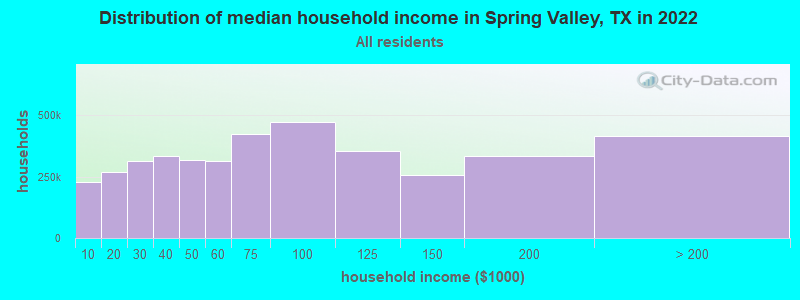
Income statistics for all residents
Median household income in Spring Valley, TX in 2022:| Spring Valley: | $155,470 |
| State: | $72,284 |
Change in median household income between 2000 and 2022:| Spring Valley, Texas: | +61.3% |
| State: | +81.0% |
Number of households with income < $10k:| Spring Valley: | 5.6% (226,521) |
| State: | 5.5% (611,011) |
Number of households with income $10k - 20k:| Spring Valley: | 6.7% (270,050) |
| State: | 6.7% (743,157) |
Number of households with income $20k - 30k:| Spring Valley: | 7.8% (313,483) |
| Texas: | 7.2% (803,381) |
Number of households with income $30k - 40k:| Spring Valley: | 8.3% (332,912) |
| Texas: | 7.8% (866,080) |
Number of households with income $40k - 50k:| Spring Valley: | 7.9% (316,827) |
| State: | 7.3% (810,440) |
Number of households with income $50k - 60k:| Spring Valley: | 7.8% (314,271) |
| State: | 7.2% (799,783) |
Number of households with income $60k - 75k:| Spring Valley: | 10.5% (421,667) |
| Texas: | 9.9% (1,095,384) |
Number of households with income $75k - 100k:| Spring Valley: | 11.7% (472,443) |
| State: | 12.8% (1,419,057) |
Number of households with income $100k - 125k:| Spring Valley: | 8.8% (356,285) |
| State: | 9.5% (1,054,577) |
Number of households with income $125k - 150k:| Spring Valley: | 6.4% (256,188) |
| State: | 6.7% (741,518) |
Number of households with income $150k - 200k:| Spring Valley: | 8.3% (332,428) |
| State: | 8.7% (961,776) |
Number of households with income > $200k:| Spring Valley: | 10.3% (414,716) |
| State: | 10.7% (1,181,544) |
Aggregate household income in Spring Valley in 2022: $13,369,060,465
Median family income in Spring Valley in 2022:| Spring Valley: | $176,823 |
| State: | $86,267 |
Median non-family income in Spring Valley in 2022:| Spring Valley: | $71,040 |
| State: | $45,999 |
Change in median non-family income between 2000 and 2022:| Spring Valley, Texas: | +63.7% |
| Texas: | +79.5% |
Median per capita income in Spring Valley in 2022:| Spring Valley: | $79,302 |
| Texas: | $38,123 |
Change in median per capita income between 2000 and 2022:| Spring Valley, Texas: | +76.6% |
| Texas: | +94.3% |
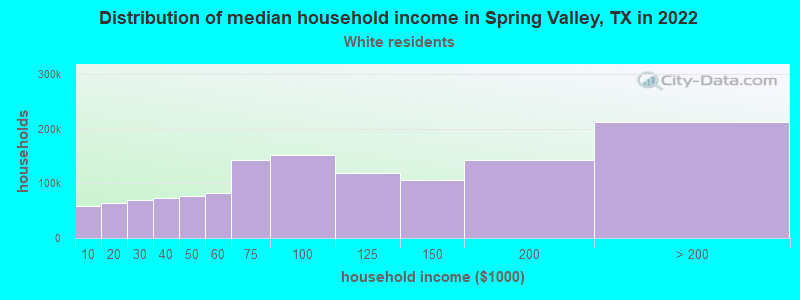
Income statistics for White residents
Median household income in Spring Valley, TX in 2022:| Spring Valley: | $167,968 |
| Texas: | $82,032 |
Change in median household income between 2000 and 2022:| Spring Valley, Texas: | +72.8% |
| State: | +91.0% |
Number of households with income < $10k:| Spring Valley: | 4.5% (58,360) |
| Texas: | 4.7% (273,716) |
Number of households with income $10k - 20k:| Spring Valley: | 4.9% (63,488) |
| State: | 5.5% (322,702) |
Number of households with income $20k - 30k:| Spring Valley: | 5.3% (69,261) |
| State: | 6.2% (363,947) |
Number of households with income $30k - 40k:| Spring Valley: | 5.6% (72,466) |
| State: | 6.8% (399,275) |
Number of households with income $40k - 50k:| Spring Valley: | 5.9% (75,941) |
| State: | 6.5% (383,417) |
Number of households with income $50k - 60k:| Spring Valley: | 6.4% (82,568) |
| State: | 6.6% (388,535) |
Number of households with income $60k - 75k:| Spring Valley: | 11.1% (143,447) |
| Texas: | 9.7% (566,295) |
Number of households with income $75k - 100k:| Spring Valley: | 11.7% (151,426) |
| State: | 13.0% (760,276) |
Number of households with income $100k - 125k:| Spring Valley: | 9.2% (118,924) |
| Texas: | 10.2% (597,596) |
Number of households with income $125k - 150k:| Spring Valley: | 8.2% (106,282) |
| Texas: | 7.4% (436,830) |
Number of households with income $150k - 200k:| Spring Valley: | 10.9% (141,936) |
| State: | 9.9% (583,067) |
Number of households with income > $200k:| Spring Valley: | 16.4% (212,222) |
| Texas: | 13.5% (792,647) |
Aggregate household income in Spring Valley in 2022: $6,422,786,501
Median family income in Spring Valley in 2022:| Spring Valley: | $203,813 |
| Texas: | $101,788 |
Number of families with income < $10k:| Spring Valley: | 0.5% (7) |
| Texas: | 2.8% (108,142) |
Number of families with income $10k - 20k:| Spring Valley: | 0.6% (9) |
| State: | 2.9% (113,421) |
Number of families with income $20k - 30k:| Spring Valley: | 0.6% (9) |
| State: | 4.1% (157,688) |
Number of families with income $30k - 40k:| Spring Valley: | 0.8% (13) |
| State: | 5.2% (198,847) |
Number of families with income $40k - 50k:| Spring Valley: | 2.0% (31) |
| State: | 5.6% (216,490) |
Number of families with income $50k - 60k:| Spring Valley: | 0.9% (14) |
| Texas: | 5.7% (220,689) |
Number of families with income $60k - 75k:| Spring Valley: | 3.1% (47) |
| State: | 9.0% (346,106) |
Number of families with income $75k - 100k:| Spring Valley: | 7.8% (120) |
| State: | 13.7% (527,363) |
Number of families with income $100k - 125k:| Spring Valley: | 7.0% (107) |
| State: | 11.6% (448,411) |
Number of families with income $125k - 150k:| Spring Valley: | 14.2% (217) |
| State: | 9.2% (355,798) |
Number of families with income $150k - 200k:| Spring Valley: | 26.5% (406) |
| Texas: | 12.5% (480,185) |
Number of families with income > $200k:| Spring Valley: | 36.1% (553) |
| State: | 17.6% (677,490) |
Median non-family income in Spring Valley in 2022:| Spring Valley: | $76,158 |
| State: | $50,587 |
Change in median non-family income between 2000 and 2022:| Spring Valley, Texas: | +72.7% |
| State: | +87.7% |
Median per capita income in Spring Valley in 2022:| Spring Valley: | $93,711 |
| State: | $47,740 |
Change in median per capita income between 2000 and 2022:| Spring Valley, Texas: | +108.3% |
| Texas: | +114.3% |
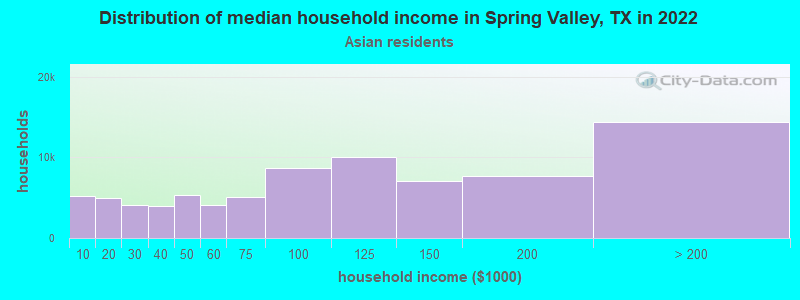
Income statistics for Asian residents
Median household income in Spring Valley, TX in 2022:| Spring Valley: | $60,622 |
| State: | $107,673 |
Change in median household income between 2000 and 2022:| Spring Valley, Texas: | +105.5% |
| Texas: | +115.1% |
Number of households with income < $10k:| Spring Valley: | 6.5% (5,242) |
| Texas: | 5.2% (29,885) |
Number of households with income $10k - 20k:| Spring Valley: | 6.2% (5,007) |
| State: | 4.7% (27,044) |
Number of households with income $20k - 30k:| Spring Valley: | 5.1% (4,091) |
| State: | 4.1% (23,363) |
Number of households with income $30k - 40k:| Spring Valley: | 4.9% (3,931) |
| State: | 4.1% (23,309) |
Number of households with income $40k - 50k:| Spring Valley: | 6.7% (5,373) |
| Texas: | 5.2% (29,826) |
Number of households with income $50k - 60k:| Spring Valley: | 5.1% (4,126) |
| State: | 4.7% (26,512) |
Number of households with income $60k - 75k:| Spring Valley: | 6.3% (5,117) |
| State: | 6.5% (36,905) |
Number of households with income $75k - 100k:| Spring Valley: | 10.8% (8,677) |
| Texas: | 11.3% (64,350) |
Number of households with income $100k - 125k:| Spring Valley: | 12.5% (10,088) |
| State: | 11.4% (64,714) |
Number of households with income $125k - 150k:| Spring Valley: | 8.7% (7,037) |
| Texas: | 9.3% (52,719) |
Number of households with income $150k - 200k:| Spring Valley: | 9.5% (7,628) |
| Texas: | 12.5% (70,953) |
Number of households with income > $200k:| Spring Valley: | 17.8% (14,366) |
| State: | 21.1% (120,260) |
Aggregate household income in Spring Valley in 2022: $22,680,814
Median family income in Spring Valley in 2022:| Spring Valley: | $62,023 |
| State: | $123,328 |
Number of families with income $10k - 20k:| Spring Valley: | 12.7% (16) |
| State: | 3.0% (13,043) |
Number of families with income $20k - 30k:| Spring Valley: | 4.3% (5) |
| State: | 3.4% (14,738) |
Number of families with income $150k - 200k:| Spring Valley: | 83.1% (104) |
| Texas: | 14.7% (64,203) |
Median per capita income in Spring Valley in 2022:| Spring Valley: | $87,525 |
| State: | $48,626 |
Change in median per capita income between 2000 and 2022:| Spring Valley, Texas: | +134.5% |
| State: | +132.0% |
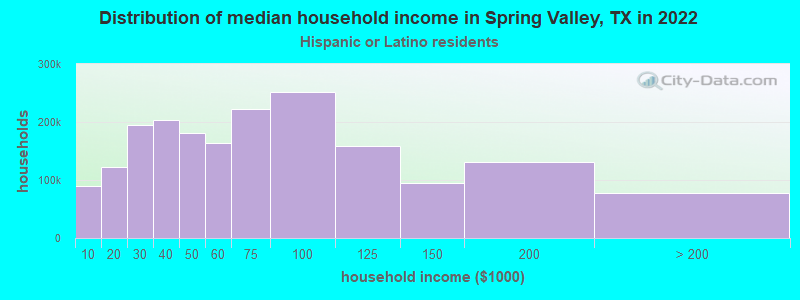
Income statistics for Hispanic or Latino residents
Median household income in Spring Valley, TX in 2022:| Spring Valley: | $171,145 |
| State: | $60,504 |
Change in median household income between 2000 and 2022:| Spring Valley, Texas: | +85.3% |
| Texas: | +102.5% |
Number of households with income < $10k:| Spring Valley: | 4.7% (88,875) |
| Texas: | 5.8% (213,953) |
Number of households with income $10k - 20k:| Spring Valley: | 6.4% (121,655) |
| State: | 8.0% (297,456) |
Number of households with income $20k - 30k:| Spring Valley: | 10.3% (195,605) |
| Texas: | 9.2% (340,166) |
Number of households with income $30k - 40k:| Spring Valley: | 10.7% (202,861) |
| State: | 9.5% (354,336) |
Number of households with income $40k - 50k:| Spring Valley: | 9.6% (181,731) |
| State: | 8.8% (327,013) |
Number of households with income $50k - 60k:| Spring Valley: | 8.7% (164,574) |
| Texas: | 8.3% (308,818) |
Number of households with income $60k - 75k:| Spring Valley: | 11.8% (222,856) |
| Texas: | 10.9% (405,109) |
Number of households with income $75k - 100k:| Spring Valley: | 13.3% (252,394) |
| State: | 13.8% (511,639) |
Number of households with income $100k - 125k:| Spring Valley: | 8.4% (158,098) |
| Texas: | 8.6% (319,728) |
Number of households with income $125k - 150k:| Spring Valley: | 5.0% (94,780) |
| State: | 5.7% (210,932) |
Number of households with income $150k - 200k:| Spring Valley: | 6.9% (130,408) |
| State: | 6.4% (236,055) |
Number of households with income > $200k:| Spring Valley: | 4.1% (77,595) |
| Texas: | 5.1% (189,259) |
Aggregate household income in Spring Valley in 2022: $85,602,689
Median family income in Spring Valley in 2022:| Spring Valley: | $175,277 |
| State: | $65,080 |
Number of families with income < $10k:| Spring Valley: | 2.7% (33) |
| Texas: | 5.3% (147,493) |
Number of families with income $10k - 20k:| Spring Valley: | 4.0% (48) |
| State: | 6.3% (174,531) |
Number of families with income $20k - 30k:| Spring Valley: | 4.5% (54) |
| Texas: | 8.6% (238,528) |
Number of families with income $30k - 40k:| Spring Valley: | 3.4% (41) |
| State: | 9.1% (251,999) |
Number of families with income $40k - 50k:| Spring Valley: | 7.5% (90) |
| State: | 8.6% (240,188) |
Number of families with income $50k - 60k:| Spring Valley: | 2.4% (28) |
| State: | 8.0% (223,566) |
Number of families with income $60k - 75k:| Spring Valley: | 6.7% (81) |
| Texas: | 10.9% (302,688) |
Number of families with income $75k - 100k:| Spring Valley: | 13.4% (162) |
| Texas: | 14.3% (398,554) |
Number of families with income $100k - 125k:| Spring Valley: | 9.7% (117) |
| State: | 9.5% (264,007) |
Number of families with income $125k - 150k:| Spring Valley: | 12.6% (152) |
| Texas: | 6.2% (171,274) |
Number of families with income $150k - 200k:| Spring Valley: | 20.9% (251) |
| State: | 7.3% (202,259) |
Number of families with income > $200k:| Spring Valley: | 12.1% (145) |
| State: | 5.9% (165,129) |
Median per capita income in Spring Valley in 2022:| Spring Valley: | $57,908 |
| State: | $24,862 |
Change in median per capita income between 2000 and 2022:| Spring Valley, Texas: | +112.6% |
| State: | +130.8% |
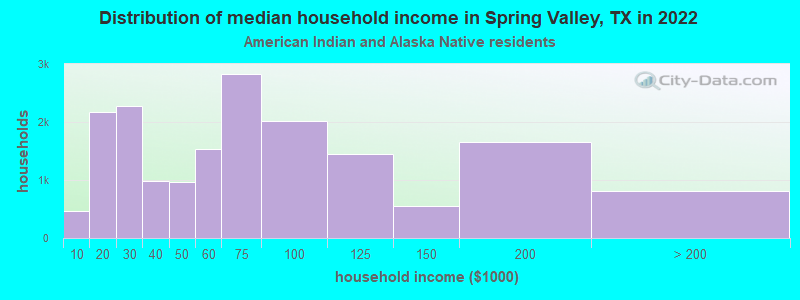
Income statistics for American Indian and Alaska Native residents
Median household income in Spring Valley, TX in 2022:| Spring Valley: | $53,632 |
| State: | $65,765 |
Change in median household income between 2000 and 2022:| Spring Valley, Texas: | +53.2% |
| State: | +88.3% |
Number of households with income < $10k:| Spring Valley: | 2.6% (459) |
| State: | 4.1% (3,398) |
Number of households with income $10k - 20k:| Spring Valley: | 12.3% (2,176) |
| Texas: | 8.3% (6,949) |
Number of households with income $20k - 30k:| Spring Valley: | 12.8% (2,275) |
| State: | 9.3% (7,742) |
Number of households with income $30k - 40k:| Spring Valley: | 5.6% (984) |
| State: | 9.1% (7,627) |
Number of households with income $40k - 50k:| Spring Valley: | 5.5% (967) |
| State: | 7.1% (5,922) |
Number of households with income $50k - 60k:| Spring Valley: | 8.6% (1,529) |
| Texas: | 8.1% (6,761) |
Number of households with income $60k - 75k:| Spring Valley: | 16.0% (2,832) |
| State: | 12.7% (10,588) |
Number of households with income $75k - 100k:| Spring Valley: | 11.4% (2,024) |
| State: | 13.0% (10,903) |
Number of households with income $100k - 125k:| Spring Valley: | 8.2% (1,449) |
| State: | 9.9% (8,256) |
Number of households with income $125k - 150k:| Spring Valley: | 3.1% (546) |
| Texas: | 5.2% (4,355) |
Number of households with income $150k - 200k:| Spring Valley: | 9.3% (1,655) |
| State: | 6.7% (5,623) |
Number of households with income > $200k:| Spring Valley: | 4.6% (818) |
| Texas: | 6.6% (5,522) |
Aggregate household income in Spring Valley in 2022: $5,177,142
Median family income in Spring Valley in 2022:| Spring Valley: | $57,526 |
| State: | $72,369 |
Number of families with income $30k - 40k:| Spring Valley: | 100.0% (27) |
| State: | 7.5% (4,592) |
Median non-family income in Spring Valley in 2022:| Spring Valley: | $56,858 |
| State: | $40,351 |
Change in median non-family income between 2000 and 2022:| Spring Valley, Texas: | +81.9% |
| State: | +71.9% |
Median per capita income in Spring Valley in 2022:| Spring Valley: | $27,694 |
| State: | $28,166 |
Change in median per capita income between 2000 and 2022:| Spring Valley, Texas: | +42.2% |
| State: | +77.2% |
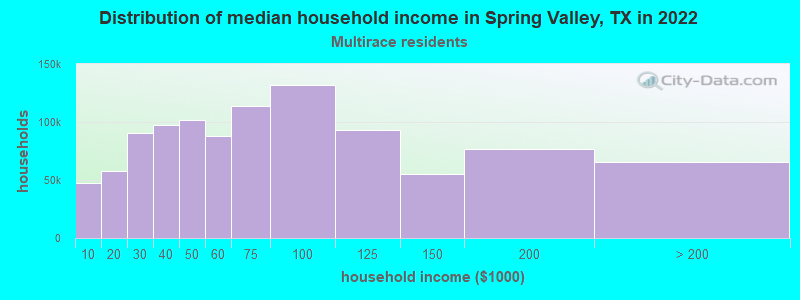
Income statistics for Multirace residents
Median household income in Spring Valley, TX in 2022:| Spring Valley: | $187,559 |
| Texas: | $62,748 |
Change in median household income between 2000 and 2022:| Spring Valley, Texas: | +83.4% |
| State: | +92.3% |
Number of households with income < $10k:| Spring Valley: | 4.6% (47,338) |
| Texas: | 5.5% (122,324) |
Number of households with income $10k - 20k:| Spring Valley: | 5.7% (58,052) |
| State: | 8.2% (182,232) |
Number of households with income $20k - 30k:| Spring Valley: | 8.9% (90,361) |
| State: | 8.5% (189,456) |
Number of households with income $30k - 40k:| Spring Valley: | 9.5% (97,260) |
| Texas: | 8.9% (197,499) |
Number of households with income $40k - 50k:| Spring Valley: | 10.0% (102,013) |
| Texas: | 8.7% (191,735) |
Number of households with income $50k - 60k:| Spring Valley: | 8.6% (88,069) |
| Texas: | 8.0% (177,535) |
Number of households with income $60k - 75k:| Spring Valley: | 11.2% (114,170) |
| State: | 10.5% (232,479) |
Number of households with income $75k - 100k:| Spring Valley: | 12.9% (131,888) |
| State: | 13.1% (290,448) |
Number of households with income $100k - 125k:| Spring Valley: | 9.1% (92,739) |
| State: | 8.6% (191,595) |
Number of households with income $125k - 150k:| Spring Valley: | 5.4% (55,358) |
| State: | 6.0% (133,361) |
Number of households with income $150k - 200k:| Spring Valley: | 7.5% (76,303) |
| State: | 7.2% (159,195) |
Number of households with income > $200k:| Spring Valley: | 6.4% (65,646) |
| State: | 6.7% (148,064) |
Aggregate household income in Spring Valley in 2022: $33,061,722
Median family income in Spring Valley in 2022:| Spring Valley: | $194,429 |
| Texas: | $69,780 |
Number of families with income $100k - 125k:| Spring Valley: | 100.0% (409) |
| Texas: | 9.5% (153,597) |
Median per capita income in Spring Valley in 2022:| Spring Valley: | $163,439 |
| State: | $26,785 |
Change in median per capita income between 2000 and 2022:| Spring Valley, Texas: | +96.3% |
| Texas: | +110.9% |
Income statistics for other residents
Number of households with income < $10k:| Spring Valley: | 4.2% (3) |
| State: | 5.9% (54,162) |
Number of households with income $10k - 20k:| Spring Valley: | 6.9% (5) |
| State: | 6.8% (62,891) |
Number of households with income $20k - 30k:| Spring Valley: | 13.9% (10) |
| State: | 10.6% (97,294) |
Number of households with income $30k - 40k:| Spring Valley: | 13.9% (10) |
| Texas: | 10.8% (99,670) |
Number of households with income $40k - 50k:| Spring Valley: | 9.7% (7) |
| Texas: | 9.3% (85,548) |
Number of households with income $50k - 60k:| Spring Valley: | 8.3% (6) |
| Texas: | 9.0% (82,757) |
Number of households with income $60k - 75k:| Spring Valley: | 9.7% (7) |
| State: | 10.9% (100,326) |
Number of households with income $75k - 100k:| Spring Valley: | 13.9% (10) |
| State: | 14.0% (128,767) |
Number of households with income $100k - 125k:| Spring Valley: | 6.9% (5) |
| State: | 8.2% (75,218) |
Number of households with income $125k - 150k:| Spring Valley: | 4.2% (3) |
| State: | 4.8% (44,223) |
Number of households with income $150k - 200k:| Spring Valley: | 5.6% (4) |
| Texas: | 5.6% (51,376) |
Number of households with income > $200k:| Spring Valley: | 2.8% (2) |
| Texas: | 4.0% (36,393) |
Aggregate household income in Spring Valley in 2022: $5,004,707
Median family income in Spring Valley in 2022:| Spring Valley: | $148,004 |
| State: | $60,064 |
Number of families with income $75k - 100k:| Spring Valley: | 100.0% (28) |
| Texas: | 14.5% (101,032) |
Median per capita income in Spring Valley in 2022:| Spring Valley: | $39,917 |
| State: | $23,899 |
Change in median per capita income between 2000 and 2022:| Spring Valley, Texas: | +103.9% |
| Texas: | +135.2% |