The median household income in Stallings, NC in 2022 was $98,030, which was 31.2% greater than the median annual income of $67,481 across the entire state of North Carolina. Compared to the median income of $51,419 in 2000 this represents an increase of 47.5%. The per capita income in 2022 was $45,360, which means an increase of 50.7% compared to 2000 when it was $22,352.
Whole page based on the data from 2000 / 2022 when the population of Stallings, North Carolina was 3,189 / 16,797
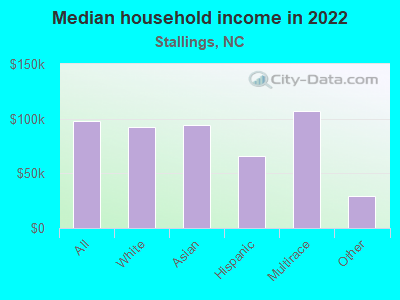
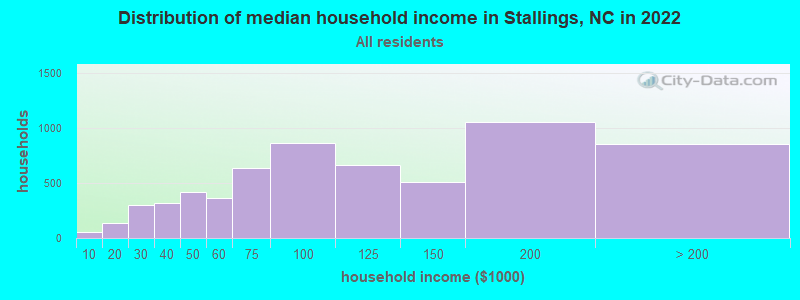
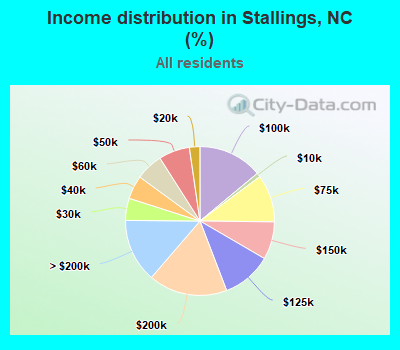
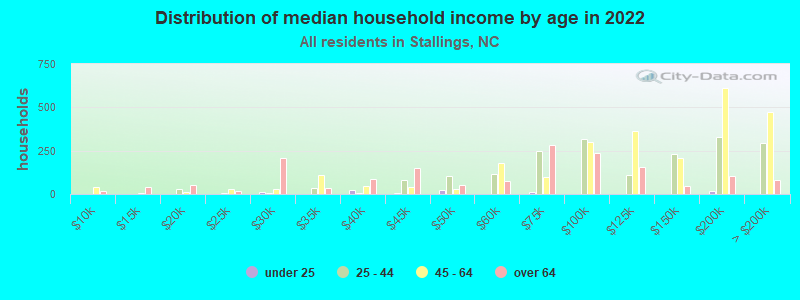
Income statistics for all residents
Median household income in Stallings, NC in 2022:
Stallings:
$98,030
North Carolina:
$67,481
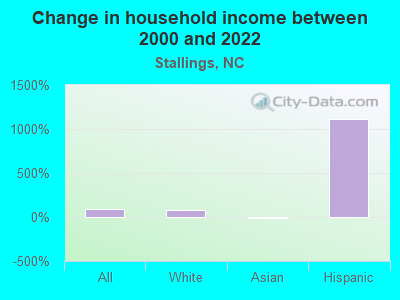
Change in median household income between 2000 and 2022:
Stallings, North Carolina:
+90.6%
State:
+72.2%
Number of households with income < $10k:
Stallings:
0.9% (54)
North Carolina:
5.4% (232,212)
Number of households with income $10k - 20k:
Stallings:
2.3% (140)
State:
7.7% (331,976)
Number of households with income $20k - 30k:
Stallings:
4.8% (296)
State:
7.5% (321,882)
Number of households with income $30k - 40k:
Stallings:
5.1% (314)
State:
8.3% (358,489)
Number of households with income $40k - 50k:
Stallings:
6.7% (415)
State:
8.2% (350,907)
Number of households with income $50k - 60k:
Stallings:
5.9% (365)
State:
7.6% (326,126)
Number of households with income $60k - 75k:
Stallings:
10.4% (637)
State:
10.1% (435,678)
Number of households with income $75k - 100k:
Stallings:
14.0% (859)
North Carolina:
13.0% (558,943)
Number of households with income $100k - 125k:
Stallings:
10.8% (663)
State:
9.6% (411,954)
Number of households with income $125k - 150k:
Stallings:
8.2% (505)
State:
6.4% (276,370)
Number of households with income $150k - 200k:
Stallings:
17.1% (1,054)
State:
7.4% (319,173)
Number of households with income > $200k:
Stallings:
13.8% (850)
North Carolina:
8.7% (375,556)
Aggregate household income in Stallings in 2022: $756,527,863
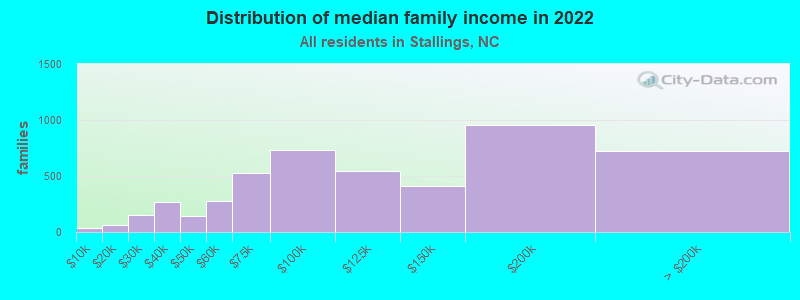
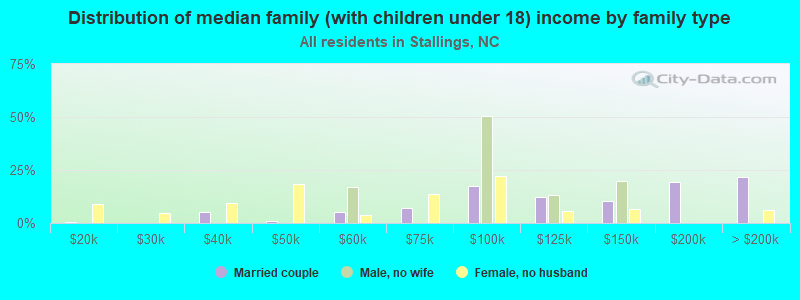
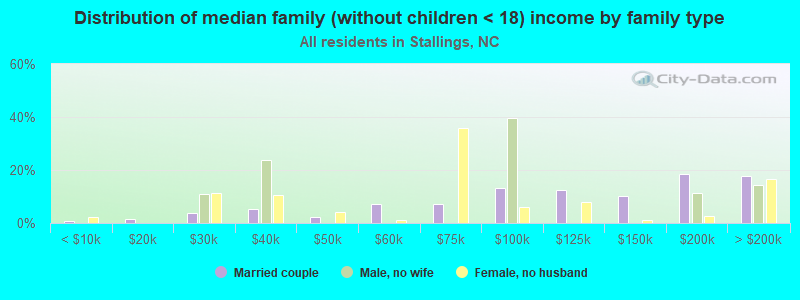
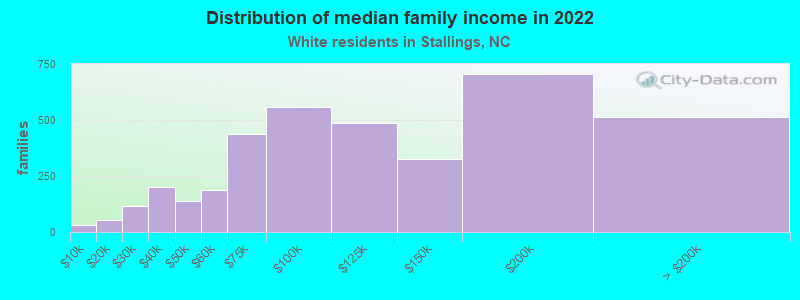
Median family income in Stallings in 2022:
Stallings:
$106,404
State:
$83,448
Number of families with income < $10k:
Stallings:
0.8% (37)
State:
3.4% (94,598)
Number of families with income $10k - 20k:
Stallings:
1.2% (60)
State:
4.2% (117,182)
Number of families with income $20k - 30k:
Stallings:
3.2% (153)
State:
5.4% (150,808)
Number of families with income $30k - 40k:
Stallings:
5.6% (269)
North Carolina:
7.0% (194,360)
Number of families with income $40k - 50k:
Stallings:
3.0% (144)
State:
7.1% (197,428)
Number of families with income $50k - 60k:
Stallings:
5.7% (274)
State:
7.0% (195,435)
Number of families with income $60k - 75k:
Stallings:
10.9% (529)
North Carolina:
10.5% (292,273)
Number of families with income $75k - 100k:
Stallings:
15.1% (732)
State:
14.7% (409,674)
Number of families with income $100k - 125k:
Stallings:
11.3% (547)
North Carolina:
11.3% (314,995)
Number of families with income $125k - 150k:
Stallings:
8.6% (415)
State:
8.0% (222,491)
Number of families with income $150k - 200k:
Stallings:
19.7% (955)
State:
9.6% (268,367)
Number of families with income > $200k:
Stallings:
15.0% (726)
State:
11.8% (327,886)
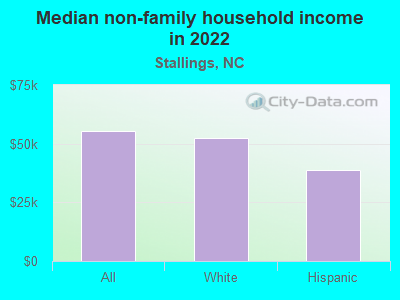
Median non-family income in Stallings in 2022:
Stallings:
$55,449
State:
$41,534
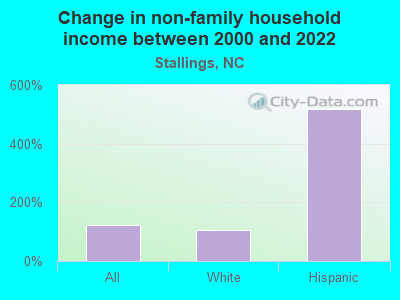
Change in median non-family income between 2000 and 2022:
Stallings, North Carolina:
+123.6%
North Carolina:
+78.7%
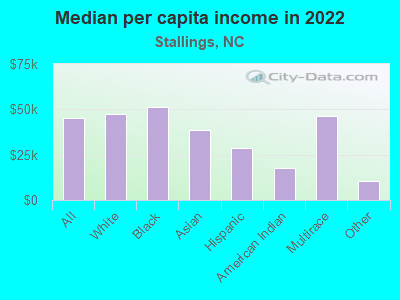
Median per capita income in Stallings in 2022:
Stallings:
$45,360
State:
$38,701
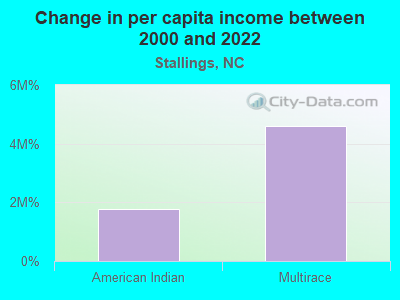
Change in median per capita income between 2000 and 2022:
Stallings, North Carolina:
+102.9%
State:
+90.6%
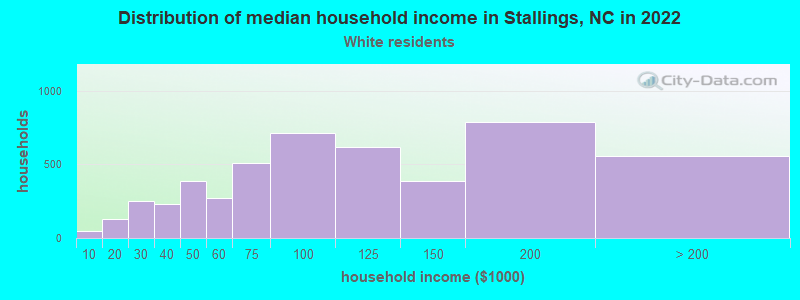
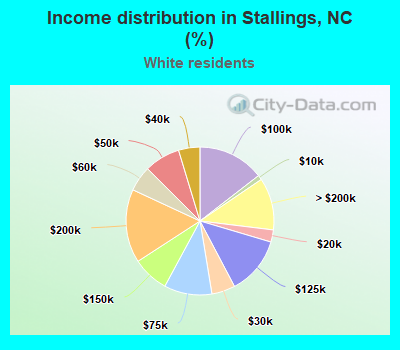
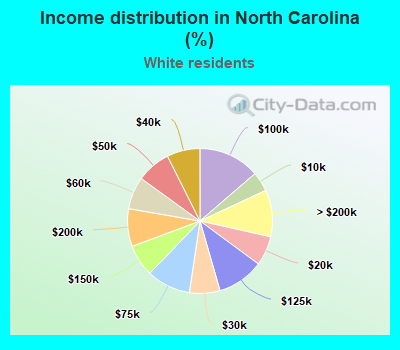
Income statistics for White residents
Median household income in Stallings, NC in 2022:
Stallings:
$92,030
State:
$75,197
Change in median household income between 2000 and 2022:
Stallings, North Carolina:
+78.1%
North Carolina:
+76.8%
Number of households with income < $10k:
Stallings:
1.0% (50)
North Carolina:
4.4% (125,166)
Number of households with income $10k - 20k:
Stallings:
2.7% (130)
North Carolina:
6.6% (187,893)
Number of households with income $20k - 30k:
Stallings:
5.1% (251)
State:
6.8% (194,490)
Number of households with income $30k - 40k:
Stallings:
4.7% (228)
State:
7.4% (210,508)
Number of households with income $40k - 50k:
Stallings:
7.9% (384)
State:
7.6% (217,521)
Number of households with income $50k - 60k:
Stallings:
5.5% (271)
North Carolina:
7.2% (206,197)
Number of households with income $60k - 75k:
Stallings:
10.5% (511)
State:
9.8% (279,732)
Number of households with income $75k - 100k:
Stallings:
14.5% (709)
North Carolina:
13.7% (390,042)
Number of households with income $100k - 125k:
Stallings:
12.7% (620)
State:
10.4% (297,273)
Number of households with income $125k - 150k:
Stallings:
8.0% (389)
North Carolina:
7.2% (203,852)
Number of households with income $150k - 200k:
Stallings:
16.1% (787)
State:
8.4% (239,971)
Number of households with income > $200k:
Stallings:
11.4% (558)
State:
10.4% (297,649)
Aggregate household income in Stallings in 2022: $582,901,757
Median family income in Stallings in 2022:
Stallings:
$105,067
State:
$93,403
Number of families with income < $10k:
Stallings:
0.9% (33)
State:
2.4% (45,246)
Number of families with income $10k - 20k:
Stallings:
1.4% (54)
State:
3.2% (59,132)
Number of families with income $20k - 30k:
Stallings:
3.1% (117)
State:
4.3% (80,482)
Number of families with income $30k - 40k:
Stallings:
5.3% (199)
North Carolina:
5.6% (103,621)
Number of families with income $40k - 50k:
Stallings:
3.7% (140)
North Carolina:
6.4% (118,099)
Number of families with income $50k - 60k:
Stallings:
5.0% (187)
State:
6.6% (122,527)
Number of families with income $60k - 75k:
Stallings:
11.7% (439)
State:
9.8% (182,594)
Number of families with income $75k - 100k:
Stallings:
14.8% (558)
State:
15.5% (287,614)
Number of families with income $100k - 125k:
Stallings:
12.9% (486)
State:
12.5% (231,962)
Number of families with income $125k - 150k:
Stallings:
8.7% (325)
State:
8.9% (165,136)
Number of families with income $150k - 200k:
Stallings:
18.8% (706)
State:
10.9% (201,776)
Number of families with income > $200k:
Stallings:
13.7% (515)
State:
14.1% (261,328)
Median non-family income in Stallings in 2022:
Stallings:
$52,541
North Carolina:
$44,158
Change in median non-family income between 2000 and 2022:
Stallings, North Carolina:
+105.0%
State:
+76.3%
Median per capita income in Stallings in 2022:
Stallings:
$47,274
North Carolina:
$44,946
Change in median per capita income between 2000 and 2022:
Stallings, North Carolina:
+96.2%
State:
+95.8%
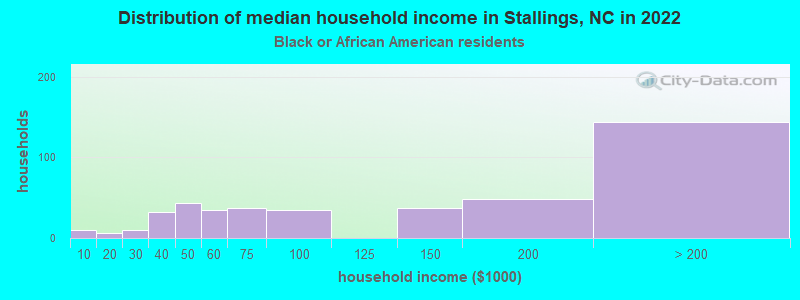
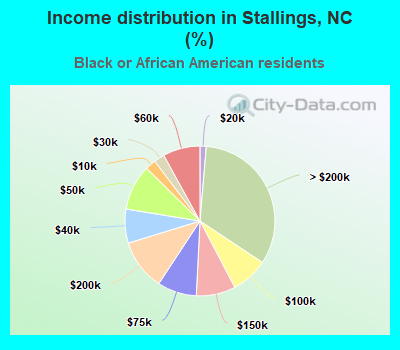
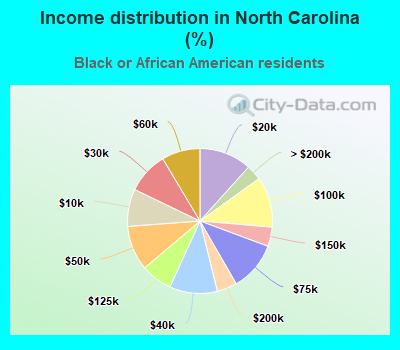
Income statistics for Black or African American residents
Number of households with income < $10k:
Stallings:
2.3% (10)
North Carolina:
8.3% (74,698)
Number of households with income $10k - 20k:
Stallings:
1.4% (6)
State:
11.7% (104,693)
Number of households with income $20k - 30k:
Stallings:
2.3% (10)
State:
9.3% (82,966)
Number of households with income $30k - 40k:
Stallings:
7.3% (32)
North Carolina:
10.7% (95,641)
Number of households with income $40k - 50k:
Stallings:
9.8% (43)
State:
10.0% (89,655)
Number of households with income $50k - 60k:
Stallings:
8.0% (35)
North Carolina:
8.6% (76,854)
Number of households with income $60k - 75k:
Stallings:
8.5% (37)
North Carolina:
11.0% (98,582)
Number of households with income $75k - 100k:
Stallings:
8.0% (35)
North Carolina:
11.3% (101,044)
Number of households with income $100k - 125k:
Stallings:
0.0% (0)
State:
7.0% (62,890)
Number of households with income $125k - 150k:
Stallings:
8.5% (37)
State:
4.3% (38,737)
Number of households with income $150k - 200k:
Stallings:
11.0% (48)
State:
4.5% (39,994)
Number of households with income > $200k:
Stallings:
33.0% (144)
State:
3.4% (30,594)
Aggregate household income in Stallings in 2022: $71,426,277
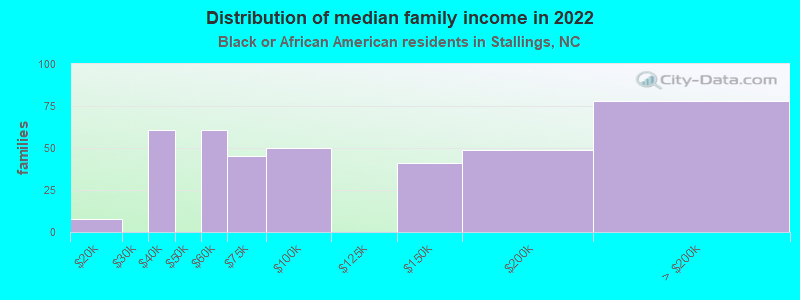
Median family income in Stallings in 2022:
Stallings:
$93,508
State:
$61,678
Number of families with income $10k - 20k:
Stallings:
2.0% (8)
State:
7.5% (39,405)
Number of families with income $30k - 40k:
Stallings:
15.5% (61)
State:
10.5% (55,158)
Number of families with income $50k - 60k:
Stallings:
15.5% (61)
State:
7.9% (41,389)
Number of families with income $60k - 75k:
Stallings:
11.5% (45)
North Carolina:
12.8% (67,311)
Number of families with income $75k - 100k:
Stallings:
12.7% (50)
North Carolina:
13.4% (70,556)
Number of families with income $125k - 150k:
Stallings:
10.5% (41)
North Carolina:
5.6% (29,608)
Number of families with income $150k - 200k:
Stallings:
12.4% (49)
State:
6.5% (34,355)
Number of families with income > $200k:
Stallings:
19.9% (78)
State:
4.6% (24,420)
Median per capita income in Stallings in 2022:
Stallings:
$51,230
State:
$28,411
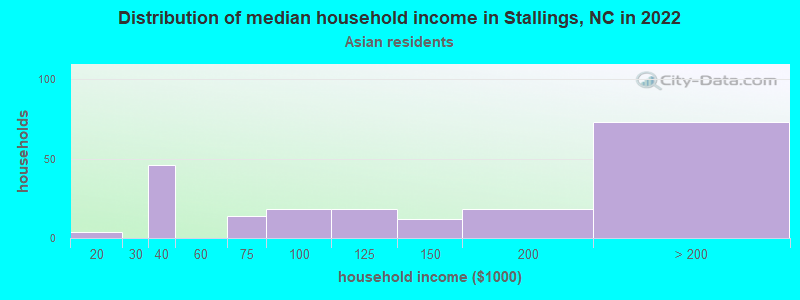
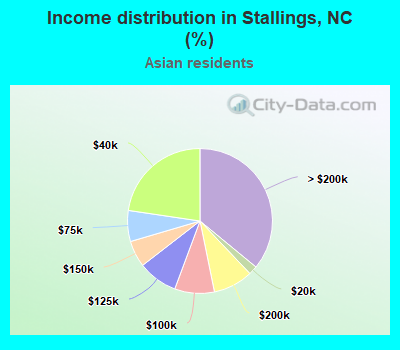
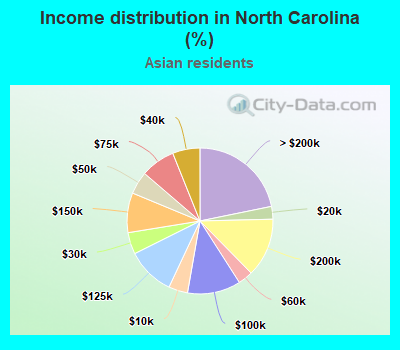
Income statistics for Asian residents
Median household income in Stallings, NC in 2022:
Stallings:
$94,493
State:
$108,332
Change in median household income between 2000 and 2022:: -7.6%
Stallings, North Carolina:
-7.6%
State:
+118.9%
Number of households with income < $10k:
Stallings:
0.0% (0)
State:
4.2% (4,787)
Number of households with income $10k - 20k:
Stallings:
2.0% (4)
State:
2.8% (3,193)
Number of households with income $20k - 30k:
Stallings:
0.0% (0)
State:
4.8% (5,456)
Number of households with income $30k - 40k:
Stallings:
22.7% (46)
North Carolina:
6.1% (6,888)
Number of households with income $40k - 50k:
Stallings:
0.0% (0)
North Carolina:
5.0% (5,707)
Number of households with income $50k - 60k:
Stallings:
0.0% (0)
North Carolina:
3.3% (3,747)
Number of households with income $60k - 75k:
Stallings:
6.9% (14)
State:
7.6% (8,647)
Number of households with income $75k - 100k:
Stallings:
8.9% (18)
State:
11.8% (13,386)
Number of households with income $100k - 125k:
Stallings:
8.9% (18)
North Carolina:
10.7% (12,074)
Number of households with income $125k - 150k:
Stallings:
5.9% (12)
State:
8.8% (9,987)
Number of households with income $150k - 200k:
Stallings:
8.9% (18)
North Carolina:
13.0% (14,781)
Number of households with income > $200k:
Stallings:
36.0% (73)
State:
21.8% (24,705)
Aggregate household income in Stallings in 2022: $42,845,200
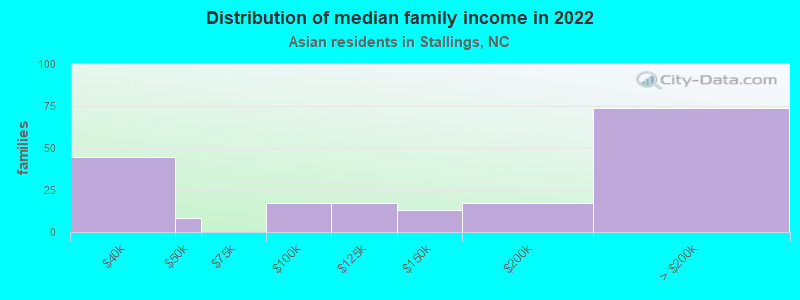
Median family income in Stallings in 2022:
Stallings:
$109,526
North Carolina:
$127,984
Number of families with income $30k - 40k:
Stallings:
23.4% (45)
State:
5.1% (4,337)
Number of families with income $40k - 50k:
Stallings:
4.4% (8)
State:
3.7% (3,123)
Number of families with income $75k - 100k:
Stallings:
9.0% (17)
North Carolina:
11.6% (9,795)
Number of families with income $100k - 125k:
Stallings:
9.0% (17)
State:
10.4% (8,792)
Number of families with income $125k - 150k:
Stallings:
6.7% (13)
State:
10.2% (8,667)
Number of families with income $150k - 200k:
Stallings:
9.1% (17)
State:
13.9% (11,783)
Number of families with income > $200k:
Stallings:
38.5% (74)
North Carolina:
27.3% (23,109)
Median per capita income in Stallings in 2022:
Stallings:
$38,486
State:
$49,485
Change in median per capita income between 2000 and 2022:
Stallings, North Carolina:
+85.9%
State:
+149.7%
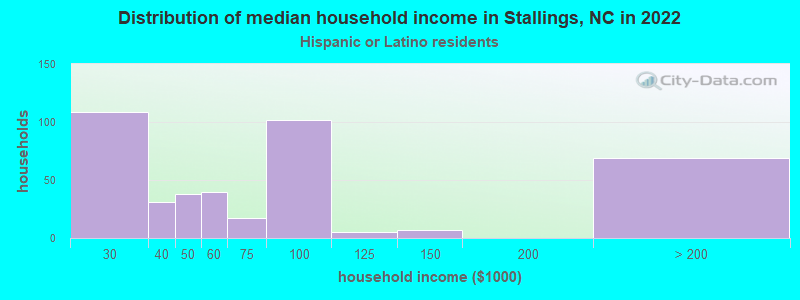
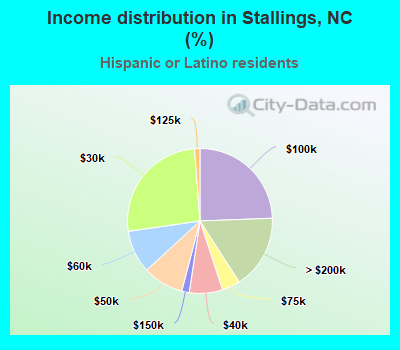
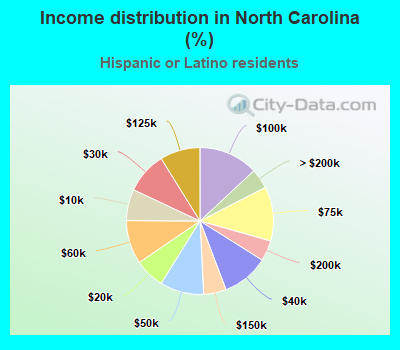
Income statistics for Hispanic or Latino residents
Median household income in Stallings, NC in 2022:
Stallings:
$66,306
North Carolina:
$57,348
Number of households with income < $10k:
Stallings:
0.0% (0)
State:
6.9% (21,164)
Number of households with income $10k - 20k:
Stallings:
0.0% (0)
State:
6.6% (20,272)
Number of households with income $20k - 30k:
Stallings:
26.1% (109)
North Carolina:
9.2% (28,070)
Number of households with income $30k - 40k:
Stallings:
7.4% (31)
North Carolina:
10.3% (31,524)
Number of households with income $40k - 50k:
Stallings:
9.1% (38)
State:
9.6% (29,552)
Number of households with income $50k - 60k:
Stallings:
9.6% (40)
North Carolina:
9.6% (29,493)
Number of households with income $60k - 75k:
Stallings:
4.1% (17)
State:
11.9% (36,598)
Number of households with income $75k - 100k:
Stallings:
24.4% (102)
North Carolina:
13.1% (40,020)
Number of households with income $100k - 125k:
Stallings:
1.2% (5)
North Carolina:
8.8% (27,080)
Number of households with income $125k - 150k:
Stallings:
1.7% (7)
State:
5.0% (15,248)
Number of households with income $150k - 200k:
Stallings:
0.0% (0)
State:
4.6% (13,955)
Number of households with income > $200k:
Stallings:
16.5% (69)
State:
4.4% (13,490)
Aggregate household income in Stallings in 2022: $32,089,161
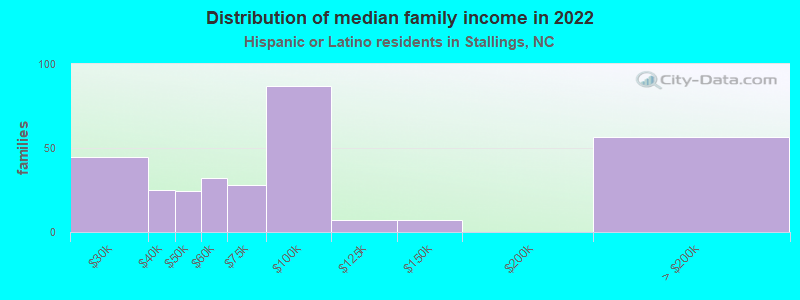
Median family income in Stallings in 2022:
Stallings:
$71,660
State:
$59,574
Number of families with income $20k - 30k:
Stallings:
14.2% (44)
State:
10.0% (23,695)
Number of families with income $30k - 40k:
Stallings:
8.0% (25)
State:
9.9% (23,486)
Number of families with income $40k - 50k:
Stallings:
7.8% (24)
State:
9.4% (22,120)
Number of families with income $50k - 60k:
Stallings:
10.3% (32)
North Carolina:
9.9% (23,438)
Number of families with income $60k - 75k:
Stallings:
9.0% (28)
State:
12.5% (29,589)
Number of families with income $75k - 100k:
Stallings:
28.0% (87)
State:
12.9% (30,509)
Number of families with income $100k - 125k:
Stallings:
2.2% (7)
State:
8.8% (20,750)
Number of families with income $125k - 150k:
Stallings:
2.3% (7)
North Carolina:
5.3% (12,411)
Number of families with income > $200k:
Stallings:
18.1% (56)
State:
5.0% (11,770)
Median non-family income in Stallings in 2022:
Stallings:
$38,717
State:
$39,761
Median per capita income in Stallings in 2022:
Stallings:
$28,582
North Carolina:
$21,631
Income statistics for American Indian and Alaska Native residents
Aggregate household income in Stallings in 2022: $7,327,868
Median per capita income in Stallings in 2022:
Stallings:
$17,754
State:
$23,134
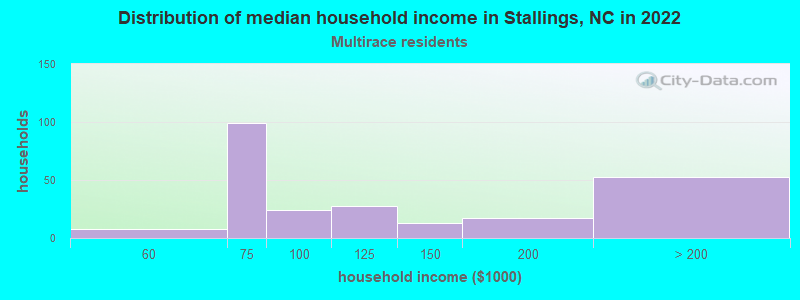
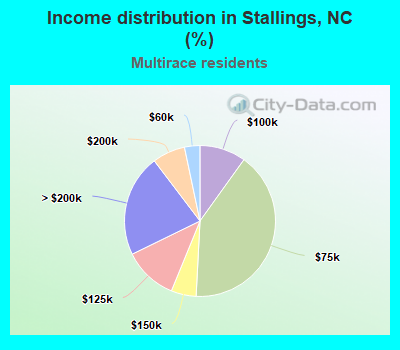
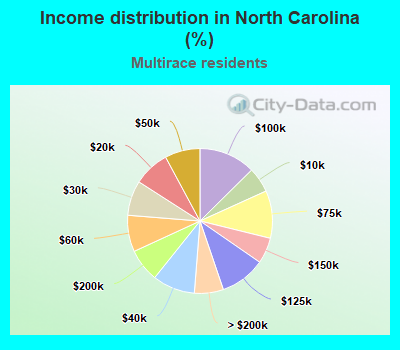
Income statistics for Multirace residents
Median household income in Stallings, NC in 2022:
Stallings:
$106,923
State:
$63,861
Number of households with income < $10k:
Stallings:
0.0% (0)
State:
5.6% (13,531)
Number of households with income $10k - 20k:
Stallings:
0.0% (0)
North Carolina:
8.1% (19,419)
Number of households with income $20k - 30k:
Stallings:
0.0% (0)
North Carolina:
7.8% (18,737)
Number of households with income $30k - 40k:
Stallings:
0.0% (0)
State:
9.5% (22,818)
Number of households with income $40k - 50k:
Stallings:
0.0% (0)
State:
7.9% (18,914)
Number of households with income $50k - 60k:
Stallings:
3.3% (8)
North Carolina:
8.1% (19,613)
Number of households with income $60k - 75k:
Stallings:
40.9% (99)
State:
10.6% (25,534)
Number of households with income $75k - 100k:
Stallings:
9.9% (24)
North Carolina:
12.6% (30,364)
Number of households with income $100k - 125k:
Stallings:
11.6% (28)
State:
10.1% (24,418)
Number of households with income $125k - 150k:
Stallings:
5.4% (13)
State:
5.8% (13,918)
Number of households with income $150k - 200k:
Stallings:
7.0% (17)
North Carolina:
7.4% (17,791)
Number of households with income > $200k:
Stallings:
21.9% (53)
State:
6.5% (15,614)
Aggregate household income in Stallings in 2022: $26,461,915
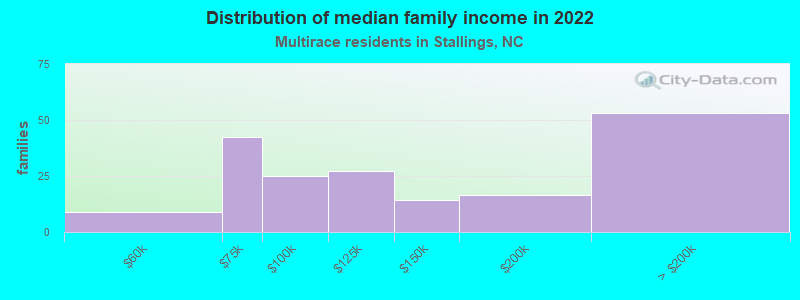
Median family income in Stallings in 2022:
Stallings:
$114,412
State:
$73,318
Number of families with income $50k - 60k:
Stallings:
4.7% (9)
State:
8.1% (13,342)
Number of families with income $60k - 75k:
Stallings:
22.7% (42)
State:
10.5% (17,278)
Number of families with income $75k - 100k:
Stallings:
13.3% (25)
North Carolina:
14.2% (23,413)
Number of families with income $100k - 125k:
Stallings:
14.5% (27)
North Carolina:
10.8% (17,807)
Number of families with income $125k - 150k:
Stallings:
7.7% (14)
State:
6.7% (11,133)
Number of families with income $150k - 200k:
Stallings:
8.8% (16)
State:
8.8% (14,514)
Number of families with income > $200k:
Stallings:
28.4% (53)
North Carolina:
8.4% (13,806)
Median per capita income in Stallings in 2022:
Stallings:
$46,061
State:
$25,945
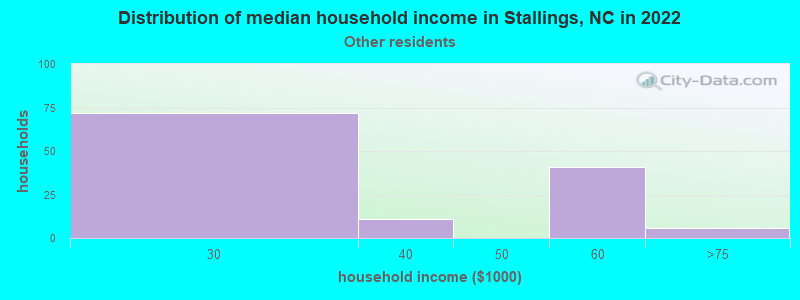
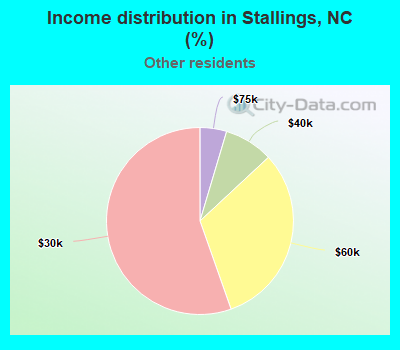
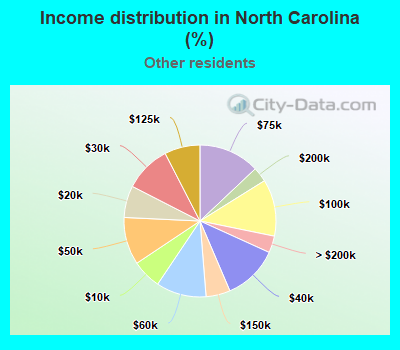
Income statistics for other residents
Median household income in Stallings, NC in 2022:
Stallings:
$29,706
State:
$53,762
Number of households with income < $10k:
Stallings:
0.0% (0)
State:
6.2% (9,504)
Number of households with income $10k - 20k:
Stallings:
0.0% (0)
State:
6.8% (10,369)
Number of households with income $20k - 30k:
Stallings:
55.4% (72)
North Carolina:
9.9% (15,154)
Number of households with income $30k - 40k:
Stallings:
8.5% (11)
State:
11.8% (18,031)
Number of households with income $40k - 50k:
Stallings:
0.0% (0)
State:
10.1% (15,496)
Number of households with income $50k - 60k:
Stallings:
31.5% (41)
North Carolina:
10.7% (16,341)
Number of households with income $60k - 75k:
Stallings:
4.6% (6)
State:
13.0% (19,842)
Number of households with income $75k - 100k:
Stallings:
0.0% (0)
State:
12.1% (18,518)
Number of households with income $100k - 125k:
Stallings:
0.0% (0)
State:
7.6% (11,567)
Number of households with income $125k - 150k:
Stallings:
0.0% (0)
State:
5.2% (7,883)
Number of households with income $150k - 200k:
Stallings:
0.0% (0)
North Carolina:
3.1% (4,814)
Number of households with income > $200k:
Stallings:
0.0% (0)
North Carolina:
3.6% (5,469)
Aggregate household income in Stallings in 2022: $7,180,287
Median per capita income in Stallings in 2022:
Stallings:
$10,519
State:
$20,252
Discuss Stallings, North Carolina (NC) on our hugely popular North Carolina forum.