The median household income in Stanford, MT in 2022 was $47,149, which was 43.4% less than the median annual income of $67,631 across the entire state of Montana. Compared to the median income of $22,679 in 2000 this represents an increase of 51.9%. The per capita income in 2022 was $49,951, which means an increase of 69.5% compared to 2000 when it was $15,253.
Whole page based on the data from 2000 / 2022 when the population of Stanford, Montana was 454 / 236
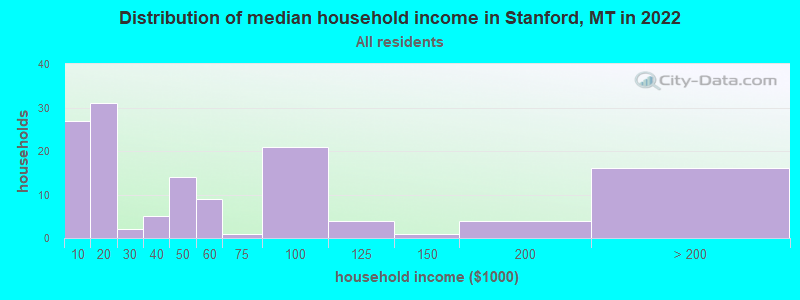
Income statistics for all residents
Median household income in Stanford, MT in 2022:
Stanford:
$47,149
State:
$67,631
Change in median household income between 2000 and 2022:
Stanford, Montana:
+107.9%
State:
+104.8%
Number of households with income < $10k:
Stanford:
20.0% (27)
State:
5.0% (23,231)
Number of households with income $10k - 20k:
Stanford:
23.0% (31)
State:
8.1% (37,478)
Number of households with income $20k - 30k:
Stanford:
1.5% (2)
Montana:
7.3% (33,880)
Number of households with income $30k - 40k:
Stanford:
3.7% (5)
State:
8.4% (38,912)
Number of households with income $40k - 50k:
Stanford:
10.4% (14)
State:
8.3% (38,441)
Number of households with income $50k - 60k:
Stanford:
6.7% (9)
Montana:
7.4% (34,172)
Number of households with income $60k - 75k:
Stanford:
0.7% (1)
State:
10.5% (48,783)
Number of households with income $75k - 100k:
Stanford:
15.6% (21)
State:
15.0% (69,571)
Number of households with income $100k - 125k:
Stanford:
3.0% (4)
Montana:
9.9% (45,889)
Number of households with income $125k - 150k:
Stanford:
0.7% (1)
State:
6.1% (28,538)
Number of households with income $150k - 200k:
Stanford:
3.0% (4)
State:
6.6% (30,552)
Number of households with income > $200k:
Stanford:
11.9% (16)
State:
7.5% (34,625)
Aggregate household income in Stanford in 2022: $11,665,709
Median family income in Stanford in 2022:
Stanford:
$87,968
State:
$83,580
Number of families with income < $10k:
Stanford:
4.1% (2)
Montana:
2.6% (7,229)
Number of families with income $10k - 20k:
Stanford:
11.8% (6)
State:
3.4% (9,550)
Number of families with income $30k - 40k:
Stanford:
4.2% (2)
Montana:
6.5% (18,237)
Number of families with income $40k - 50k:
Stanford:
6.2% (3)
State:
6.8% (19,174)
Number of families with income $50k - 60k:
Stanford:
2.0% (1)
State:
7.4% (20,843)
Number of families with income $75k - 100k:
Stanford:
39.6% (20)
State:
17.1% (48,328)
Number of families with income $100k - 125k:
Stanford:
8.3% (4)
Montana:
12.8% (36,048)
Number of families with income $125k - 150k:
Stanford:
1.9% (1)
State:
8.3% (23,444)
Number of families with income $150k - 200k:
Stanford:
3.9% (2)
State:
9.3% (26,290)
Number of families with income > $200k:
Stanford:
18.0% (9)
Montana:
9.5% (26,804)
Median income for 3 person families:
Stanford:
$82,275
State:
$81,241
Median per capita income in Stanford in 2022:
Stanford:
$49,951
State:
$38,329
Income statistics for White residents
Median household income in Stanford, MT in 2022:
Stanford:
$43,587
State:
$69,744
Change in median household income between 2000 and 2022:
Stanford, Montana:
+92.2%
State:
+106.5%
Number of households with income < $10k:
Stanford:
20.6% (27)
State:
4.5% (18,406)
Number of households with income $10k - 20k:
Stanford:
23.7% (31)
Montana:
7.8% (32,061)
Number of households with income $20k - 30k:
Stanford:
1.5% (2)
Montana:
7.0% (28,825)
Number of households with income $30k - 40k:
Stanford:
3.8% (5)
State:
8.2% (33,552)
Number of households with income $40k - 50k:
Stanford:
8.4% (11)
Montana:
8.2% (33,446)
Number of households with income $50k - 60k:
Stanford:
6.9% (9)
Montana:
7.3% (29,753)
Number of households with income $60k - 75k:
Stanford:
0.8% (1)
State:
10.7% (44,051)
Number of households with income $75k - 100k:
Stanford:
15.3% (20)
Montana:
15.0% (61,580)
Number of households with income $100k - 125k:
Stanford:
3.1% (4)
State:
10.4% (42,636)
Number of households with income $125k - 150k:
Stanford:
0.8% (1)
State:
6.3% (25,938)
Number of households with income $150k - 200k:
Stanford:
3.1% (4)
Montana:
6.8% (27,704)
Number of households with income > $200k:
Stanford:
12.2% (16)
State:
7.8% (32,101)
Aggregate household income in Stanford in 2022: $11,350,623
Median family income in Stanford in 2022:
Stanford:
$88,074
State:
$86,163
Number of families with income < $10k:
Stanford:
4.0% (2)
Montana:
2.0% (4,963)
Number of families with income $10k - 20k:
Stanford:
11.4% (6)
Montana:
2.8% (7,063)
Number of families with income $30k - 40k:
Stanford:
4.3% (2)
State:
6.0% (14,834)
Number of families with income $40k - 50k:
Stanford:
6.4% (3)
Montana:
6.8% (16,997)
Number of families with income $50k - 60k:
Stanford:
2.0% (1)
State:
7.3% (18,007)
Number of families with income $75k - 100k:
Stanford:
39.2% (20)
State:
17.2% (42,622)
Number of families with income $100k - 125k:
Stanford:
8.6% (4)
Montana:
13.5% (33,620)
Number of families with income $125k - 150k:
Stanford:
2.0% (1)
Montana:
8.7% (21,654)
Number of families with income $150k - 200k:
Stanford:
3.8% (2)
State:
9.6% (23,873)
Number of families with income > $200k:
Stanford:
18.3% (9)
State:
10.0% (24,758)
Median per capita income in Stanford in 2022:
Stanford:
$54,302
State:
$40,453
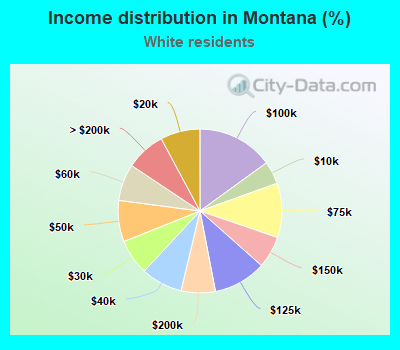
Income statistics for Hispanic or Latino residents
Median per capita income in Stanford in 2022:
Stanford:
$5,747
Montana:
$23,068
Change in median per capita income between 2000 and 2022:
Stanford, Montana:
+112.9%
State:
+122.4%
Discuss Stanford, Montana (MT) on our hugely popular Montana forum.