The median household income in Stockton, CA in 2022 was $76,231, which was 20.1% less than the median annual income of $91,551 across the entire state of California. Compared to the median income of $35,453 in 2000 this represents an increase of 53.5%. The per capita income in 2022 was $31,510, which means an increase of 51.1% compared to 2000 when it was $15,405.
Whole page based on the data from 2000 / 2022 when the population of Stockton, California was 243,771 / 321,796
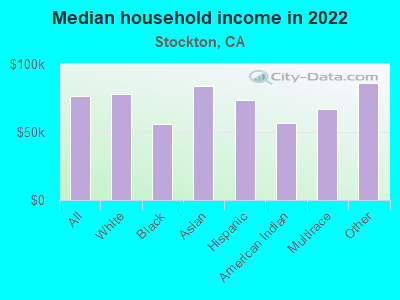
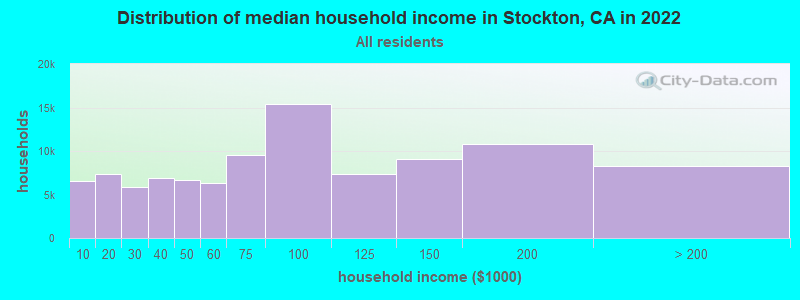
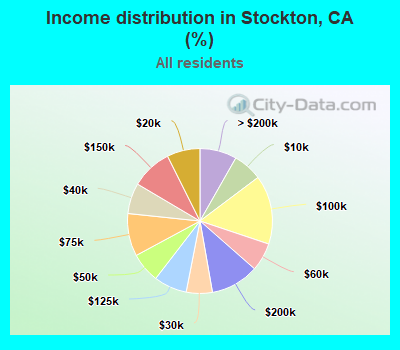
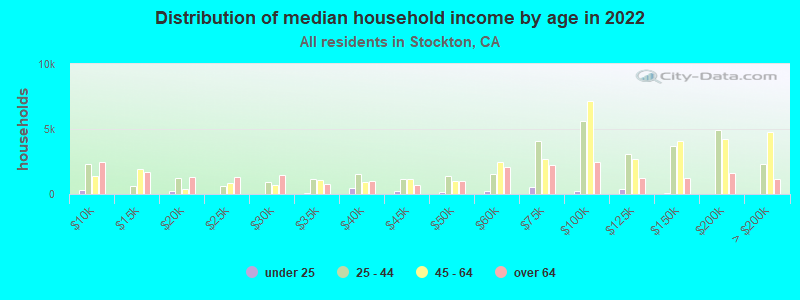
Income statistics for all residents
Median household income in Stockton, CA in 2022:
Stockton:
$76,231
State:
$91,551
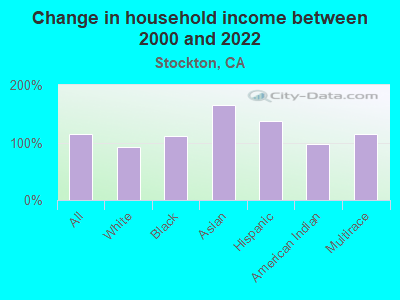
Change in median household income between 2000 and 2022:
Stockton, California:
+115.0%
State:
+92.8%
Number of households with income < $10k:
Stockton:
6.5% (6,512)
State:
4.8% (654,370)
Number of households with income $10k - 20k:
Stockton:
7.4% (7,364)
State:
5.8% (789,493)
Number of households with income $20k - 30k:
Stockton:
5.8% (5,819)
State:
5.7% (778,318)
Number of households with income $30k - 40k:
Stockton:
6.8% (6,840)
California:
5.8% (783,170)
Number of households with income $40k - 50k:
Stockton:
6.7% (6,672)
State:
5.8% (781,352)
Number of households with income $50k - 60k:
Stockton:
6.3% (6,315)
California:
5.6% (760,175)
Number of households with income $60k - 75k:
Stockton:
9.5% (9,528)
State:
8.2% (1,104,699)
Number of households with income $75k - 100k:
Stockton:
15.4% (15,398)
State:
12.0% (1,627,633)
Number of households with income $100k - 125k:
Stockton:
7.4% (7,383)
State:
10.0% (1,358,619)
Number of households with income $125k - 150k:
Stockton:
9.1% (9,113)
California:
7.6% (1,027,455)
Number of households with income $150k - 200k:
Stockton:
10.8% (10,761)
California:
10.6% (1,439,811)
Number of households with income > $200k:
Stockton:
8.2% (8,232)
State:
18.0% (2,445,491)
Aggregate household income in Stockton in 2022: $9,745,191,000
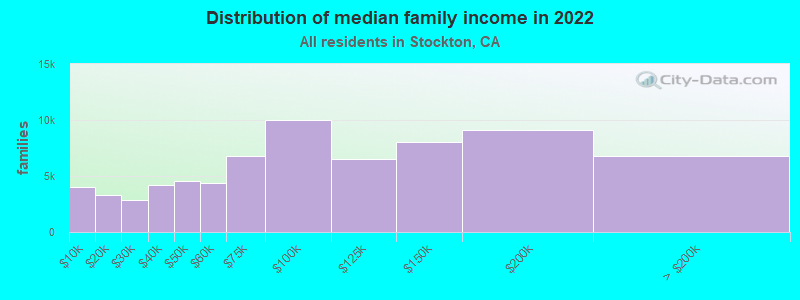
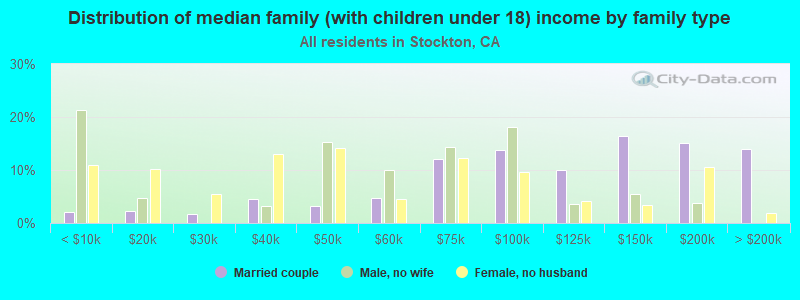
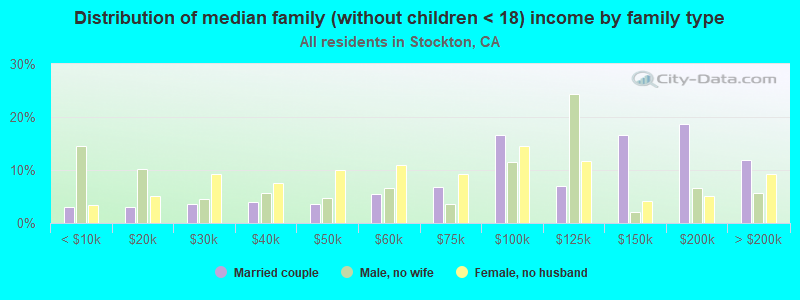
Median family income in Stockton in 2022:
Stockton:
$88,891
California:
$104,823
Number of families with income < $10k:
Stockton:
5.6% (3,977)
State:
3.1% (280,184)
Number of families with income $10k - 20k:
Stockton:
4.7% (3,294)
State:
3.5% (322,064)
Number of families with income $20k - 30k:
Stockton:
4.0% (2,820)
State:
4.7% (433,722)
Number of families with income $30k - 40k:
Stockton:
6.0% (4,232)
California:
5.2% (478,213)
Number of families with income $40k - 50k:
Stockton:
6.5% (4,569)
State:
5.6% (511,647)
Number of families with income $50k - 60k:
Stockton:
6.2% (4,337)
State:
5.5% (498,926)
Number of families with income $60k - 75k:
Stockton:
9.6% (6,788)
State:
8.0% (731,094)
Number of families with income $75k - 100k:
Stockton:
14.2% (9,986)
California:
12.2% (1,115,621)
Number of families with income $100k - 125k:
Stockton:
9.3% (6,545)
State:
10.5% (959,600)
Number of families with income $125k - 150k:
Stockton:
11.4% (8,011)
State:
8.4% (768,725)
Number of families with income $150k - 200k:
Stockton:
12.9% (9,115)
State:
11.9% (1,087,239)
Number of families with income > $200k:
Stockton:
9.7% (6,808)
State:
21.5% (1,963,769)
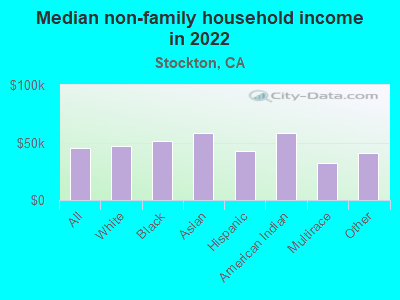
Median non-family income in Stockton in 2022:
Stockton:
$45,195
California:
$59,348
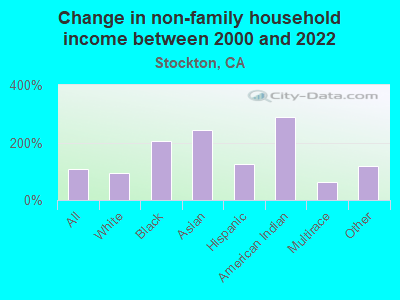
Change in median non-family income between 2000 and 2022:
Stockton, California:
+107.4%
State:
+85.3%
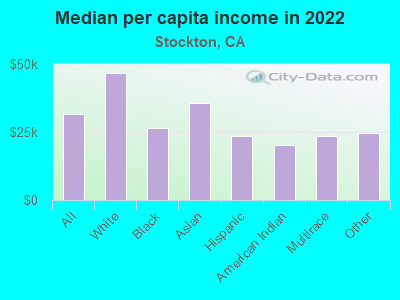
Median per capita income in Stockton in 2022:
Stockton:
$31,510
California:
$46,661
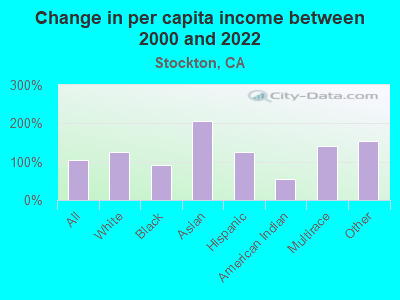
Change in median per capita income between 2000 and 2022:
Stockton, California:
+104.5%
State:
+105.5%
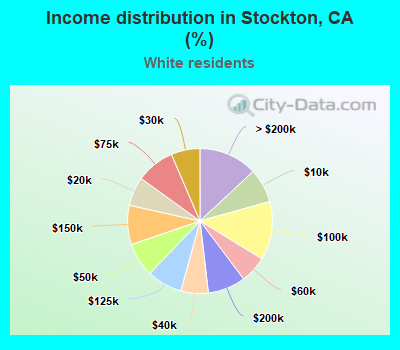
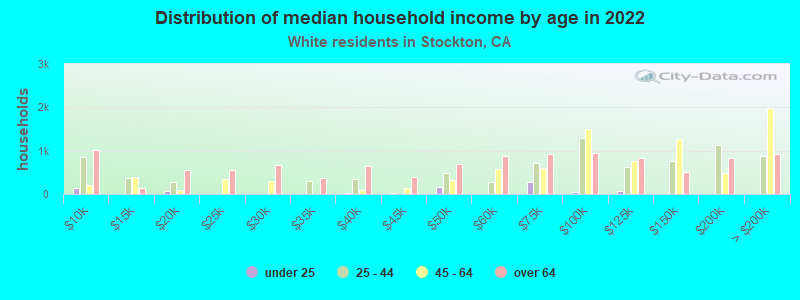
Income statistics for White residents
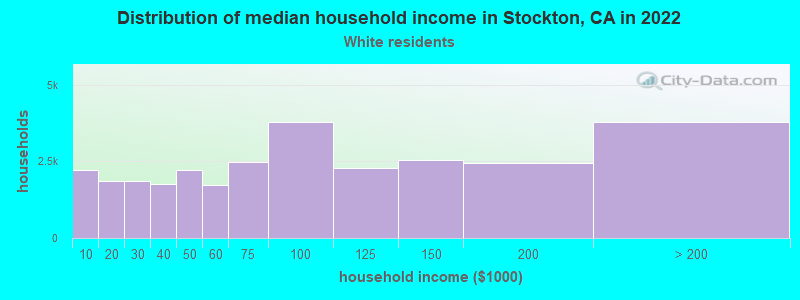
Median household income in Stockton, CA in 2022:
Stockton:
$77,778
State:
$100,917
Change in median household income between 2000 and 2022:
Stockton, California:
+91.6%
State:
+96.8%
Number of households with income < $10k:
Stockton:
7.6% (2,204)
State:
4.4% (284,109)
Number of households with income $10k - 20k:
Stockton:
6.5% (1,870)
State:
5.3% (340,330)
Number of households with income $20k - 30k:
Stockton:
6.4% (1,866)
California:
5.3% (343,145)
Number of households with income $30k - 40k:
Stockton:
6.1% (1,773)
State:
5.1% (330,146)
Number of households with income $40k - 50k:
Stockton:
7.6% (2,206)
State:
5.2% (335,310)
Number of households with income $50k - 60k:
Stockton:
6.0% (1,746)
State:
5.1% (326,299)
Number of households with income $60k - 75k:
Stockton:
8.6% (2,491)
State:
7.6% (487,640)
Number of households with income $75k - 100k:
Stockton:
13.1% (3,784)
State:
11.5% (736,578)
Number of households with income $100k - 125k:
Stockton:
7.9% (2,278)
California:
10.1% (648,782)
Number of households with income $125k - 150k:
Stockton:
8.8% (2,538)
California:
7.8% (499,671)
Number of households with income $150k - 200k:
Stockton:
8.4% (2,434)
State:
11.4% (729,603)
Number of households with income > $200k:
Stockton:
13.1% (3,786)
State:
21.2% (1,364,246)
Aggregate household income in Stockton in 2022: $3,198,101,600
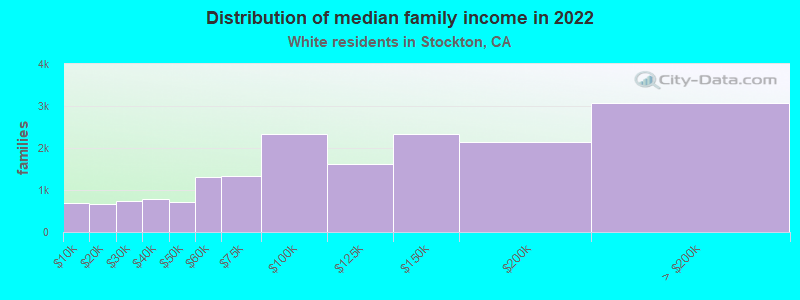
Median family income in Stockton in 2022:
Stockton:
$106,783
State:
$125,379
Number of families with income < $10k:
Stockton:
3.9% (700)
State:
2.2% (87,079)
Number of families with income $10k - 20k:
Stockton:
3.7% (660)
California:
2.5% (97,716)
Number of families with income $20k - 30k:
Stockton:
4.2% (738)
State:
3.5% (137,295)
Number of families with income $30k - 40k:
Stockton:
4.4% (788)
State:
3.9% (152,947)
Number of families with income $40k - 50k:
Stockton:
4.0% (714)
California:
4.3% (169,197)
Number of families with income $50k - 60k:
Stockton:
7.4% (1,317)
State:
4.5% (176,192)
Number of families with income $60k - 75k:
Stockton:
7.5% (1,339)
California:
7.0% (274,752)
Number of families with income $75k - 100k:
Stockton:
13.1% (2,328)
California:
11.3% (445,632)
Number of families with income $100k - 125k:
Stockton:
9.1% (1,615)
State:
10.7% (423,630)
Number of families with income $125k - 150k:
Stockton:
13.2% (2,345)
State:
9.1% (357,408)
Number of families with income $150k - 200k:
Stockton:
12.0% (2,131)
State:
13.5% (532,693)
Number of families with income > $200k:
Stockton:
17.3% (3,062)
State:
27.6% (1,086,948)
Median non-family income in Stockton in 2022:
Stockton:
$46,765
State:
$62,819
Change in median non-family income between 2000 and 2022:
Stockton, California:
+93.6%
State:
+84.4%
Median per capita income in Stockton in 2022:
Stockton:
$46,681
State:
$61,706
Change in median per capita income between 2000 and 2022:
Stockton, California:
+123.6%
State:
+122.7%
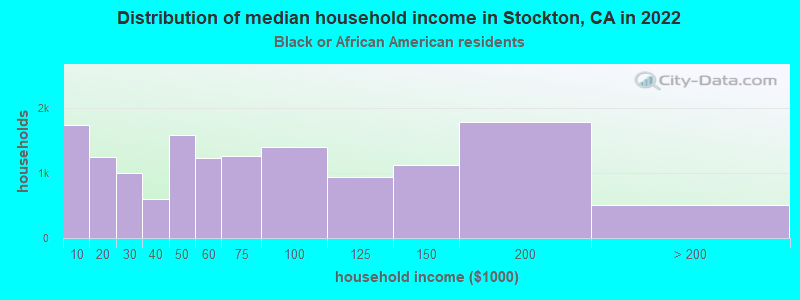
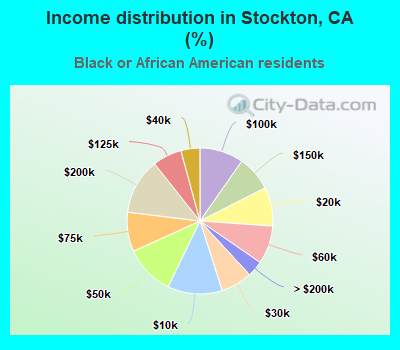
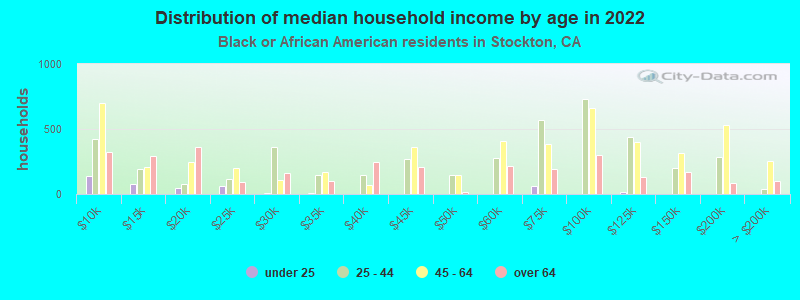
Income statistics for Black or African American residents
Median household income in Stockton, CA in 2022:
Stockton:
$56,168
California:
$63,268
Change in median household income between 2000 and 2022:
Stockton, California:
+110.9%
State:
+81.0%
Number of households with income < $10k:
Stockton:
12.1% (1,737)
California:
9.0% (73,219)
Number of households with income $10k - 20k:
Stockton:
8.6% (1,235)
California:
10.6% (86,666)
Number of households with income $20k - 30k:
Stockton:
7.0% (1,000)
State:
7.1% (57,719)
Number of households with income $30k - 40k:
Stockton:
4.2% (605)
State:
7.2% (58,714)
Number of households with income $40k - 50k:
Stockton:
11.0% (1,584)
California:
7.1% (58,075)
Number of households with income $50k - 60k:
Stockton:
8.5% (1,223)
State:
6.8% (55,229)
Number of households with income $60k - 75k:
Stockton:
8.7% (1,252)
State:
8.8% (71,895)
Number of households with income $75k - 100k:
Stockton:
9.7% (1,397)
State:
11.9% (96,893)
Number of households with income $100k - 125k:
Stockton:
6.5% (928)
State:
8.7% (70,729)
Number of households with income $125k - 150k:
Stockton:
7.8% (1,119)
State:
6.3% (51,211)
Number of households with income $150k - 200k:
Stockton:
12.4% (1,779)
California:
7.2% (58,687)
Number of households with income > $200k:
Stockton:
3.5% (504)
State:
9.3% (75,487)
Aggregate household income in Stockton in 2022: $1,107,620,100
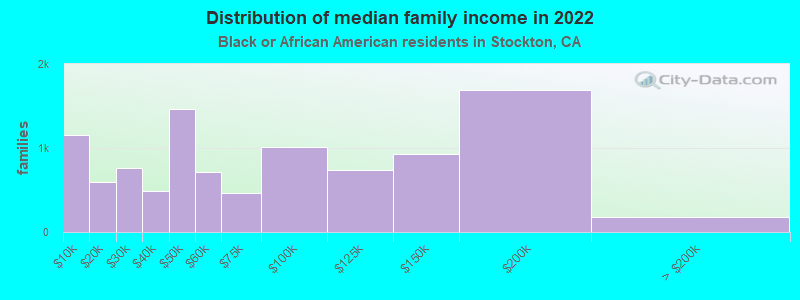
Median family income in Stockton in 2022:
Stockton:
$55,910
California:
$77,263
Number of families with income < $10k:
Stockton:
11.4% (1,156)
State:
5.9% (27,037)
Number of families with income $10k - 20k:
Stockton:
5.8% (594)
California:
6.4% (29,505)
Number of families with income $20k - 30k:
Stockton:
7.5% (767)
State:
5.6% (25,755)
Number of families with income $30k - 40k:
Stockton:
4.8% (493)
State:
6.8% (30,948)
Number of families with income $40k - 50k:
Stockton:
14.4% (1,464)
State:
8.3% (38,171)
Number of families with income $50k - 60k:
Stockton:
7.1% (720)
California:
7.0% (31,860)
Number of families with income $60k - 75k:
Stockton:
4.6% (464)
California:
8.7% (40,021)
Number of families with income $75k - 100k:
Stockton:
9.9% (1,006)
California:
12.4% (56,846)
Number of families with income $100k - 125k:
Stockton:
7.2% (733)
State:
9.8% (44,911)
Number of families with income $125k - 150k:
Stockton:
9.1% (923)
State:
7.5% (34,434)
Number of families with income $150k - 200k:
Stockton:
16.6% (1,687)
California:
9.3% (42,807)
Number of families with income > $200k:
Stockton:
1.7% (175)
State:
12.2% (56,093)
Median non-family income in Stockton in 2022:
Stockton:
$51,097
California:
$41,942
Median per capita income in Stockton in 2022:
Stockton:
$26,430
California:
$36,708
Change in median per capita income between 2000 and 2022:
Stockton, California:
+92.5%
State:
+110.4%
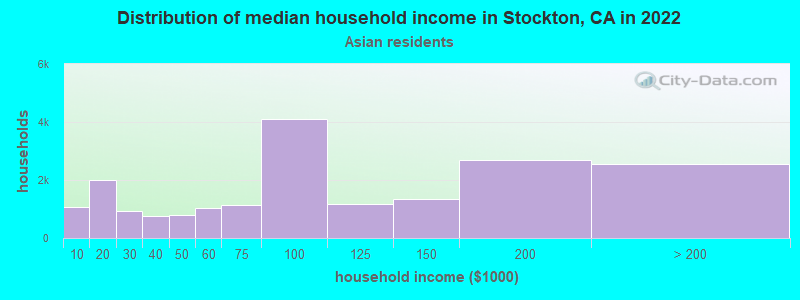
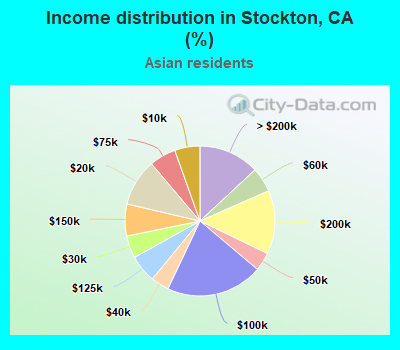
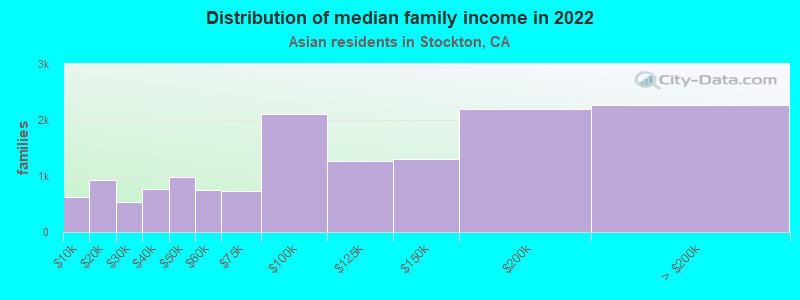
Income statistics for Asian residents
Median household income in Stockton, CA in 2022:
Stockton:
$84,044
California:
$119,861
Number of households with income < $10k:
Stockton:
5.4% (1,067)
California:
5.1% (106,273)
Number of households with income $10k - 20k:
Stockton:
10.2% (1,992)
California:
4.9% (101,815)
Number of households with income $20k - 30k:
Stockton:
4.8% (948)
State:
4.6% (94,414)
Number of households with income $30k - 40k:
Stockton:
3.9% (770)
California:
4.1% (84,491)
Number of households with income $40k - 50k:
Stockton:
4.0% (784)
State:
4.0% (81,758)
Number of households with income $50k - 60k:
Stockton:
5.3% (1,048)
State:
3.9% (80,971)
Number of households with income $60k - 75k:
Stockton:
5.7% (1,125)
California:
6.0% (124,194)
Number of households with income $75k - 100k:
Stockton:
20.9% (4,090)
State:
9.7% (200,337)
Number of households with income $100k - 125k:
Stockton:
6.0% (1,172)
State:
9.4% (193,488)
Number of households with income $125k - 150k:
Stockton:
6.9% (1,346)
State:
7.7% (158,253)
Number of households with income $150k - 200k:
Stockton:
13.7% (2,690)
State:
12.2% (252,139)
Number of households with income > $200k:
Stockton:
13.1% (2,564)
California:
28.4% (586,641)
Aggregate household income in Stockton in 2022: $2,263,254,800
Median family income in Stockton in 2022:
Stockton:
$98,829
State:
$136,040
Number of families with income < $10k:
Stockton:
4.3% (621)
State:
2.8% (42,046)
Number of families with income $10k - 20k:
Stockton:
6.4% (926)
State:
3.1% (46,821)
Number of families with income $20k - 30k:
Stockton:
3.8% (544)
State:
4.1% (61,519)
Number of families with income $30k - 40k:
Stockton:
5.3% (764)
State:
3.7% (55,234)
Number of families with income $40k - 50k:
Stockton:
6.8% (985)
State:
3.9% (58,471)
Number of families with income $50k - 60k:
Stockton:
5.2% (752)
California:
3.9% (58,911)
Number of families with income $60k - 75k:
Stockton:
5.1% (735)
California:
5.9% (88,675)
Number of families with income $75k - 100k:
Stockton:
14.5% (2,099)
State:
9.5% (143,103)
Number of families with income $100k - 125k:
Stockton:
8.8% (1,276)
California:
9.4% (142,085)
Number of families with income $125k - 150k:
Stockton:
9.1% (1,311)
State:
8.0% (120,635)
Number of families with income $150k - 200k:
Stockton:
15.1% (2,191)
California:
13.2% (198,099)
Number of families with income > $200k:
Stockton:
15.6% (2,264)
State:
32.5% (489,303)
Median non-family income in Stockton in 2022:
Stockton:
$58,112
State:
$74,216
Median per capita income in Stockton in 2022:
Stockton:
$35,538
State:
$58,824
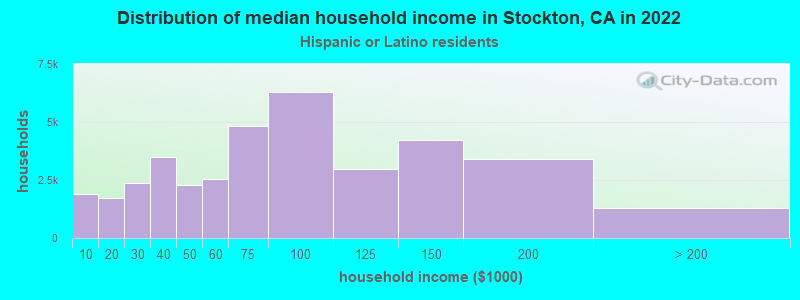
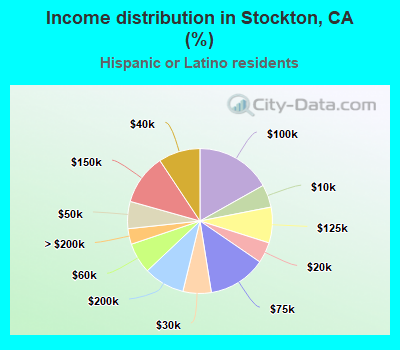
Income statistics for Hispanic or Latino residents
Median household income in Stockton, CA in 2022:
Stockton:
$73,444
State:
$75,698
Change in median household income between 2000 and 2022:
Stockton, California:
+138.1%
State:
+107.2%
Number of households with income < $10k:
Stockton:
5.1% (1,892)
State:
4.3% (183,294)
Number of households with income $10k - 20k:
Stockton:
4.7% (1,739)
State:
6.0% (253,903)
Number of households with income $20k - 30k:
Stockton:
6.3% (2,357)
California:
6.8% (286,386)
Number of households with income $30k - 40k:
Stockton:
9.3% (3,482)
California:
7.4% (313,728)
Number of households with income $40k - 50k:
Stockton:
6.1% (2,264)
State:
7.4% (313,199)
Number of households with income $50k - 60k:
Stockton:
6.9% (2,560)
California:
7.2% (305,366)
Number of households with income $60k - 75k:
Stockton:
12.9% (4,828)
State:
10.3% (434,937)
Number of households with income $75k - 100k:
Stockton:
16.9% (6,295)
State:
14.4% (607,302)
Number of households with income $100k - 125k:
Stockton:
8.0% (2,981)
State:
10.6% (447,424)
Number of households with income $125k - 150k:
Stockton:
11.3% (4,225)
State:
7.5% (316,022)
Number of households with income $150k - 200k:
Stockton:
9.2% (3,421)
State:
9.2% (386,269)
Number of households with income > $200k:
Stockton:
3.5% (1,301)
State:
8.8% (372,651)
Aggregate household income in Stockton in 2022: $3,158,462,200
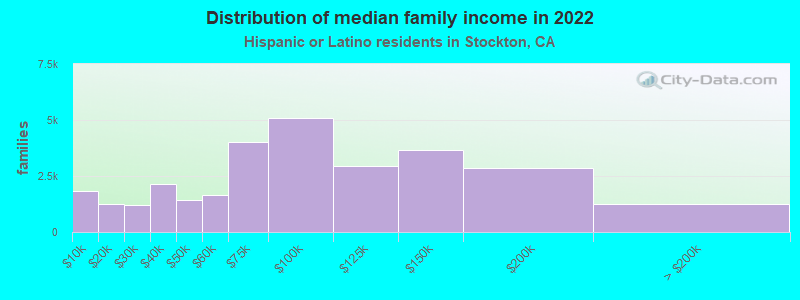
Median family income in Stockton in 2022:
Stockton:
$79,896
California:
$77,589
Number of families with income < $10k:
Stockton:
6.2% (1,826)
State:
3.9% (129,468)
Number of families with income $10k - 20k:
Stockton:
4.3% (1,272)
State:
4.6% (151,997)
Number of families with income $20k - 30k:
Stockton:
4.1% (1,206)
State:
6.6% (216,764)
Number of families with income $30k - 40k:
Stockton:
7.3% (2,140)
California:
7.6% (249,849)
Number of families with income $40k - 50k:
Stockton:
4.9% (1,430)
State:
7.7% (254,822)
Number of families with income $50k - 60k:
Stockton:
5.6% (1,631)
State:
7.4% (244,815)
Number of families with income $60k - 75k:
Stockton:
13.7% (4,009)
State:
10.5% (345,838)
Number of families with income $75k - 100k:
Stockton:
17.3% (5,070)
State:
14.9% (491,589)
Number of families with income $100k - 125k:
Stockton:
10.0% (2,940)
State:
10.7% (355,400)
Number of families with income $125k - 150k:
Stockton:
12.5% (3,664)
State:
7.8% (259,317)
Number of families with income $150k - 200k:
Stockton:
9.8% (2,860)
California:
9.3% (306,566)
Number of families with income > $200k:
Stockton:
4.3% (1,252)
California:
9.1% (299,984)
Median non-family income in Stockton in 2022:
Stockton:
$42,976
California:
$49,746
Change in median non-family income between 2000 and 2022:
Stockton, California:
+124.8%
State:
+100.7%
Median per capita income in Stockton in 2022:
Stockton:
$23,380
State:
$27,240
Change in median per capita income between 2000 and 2022:
Stockton, California:
+125.3%
California:
+133.3%
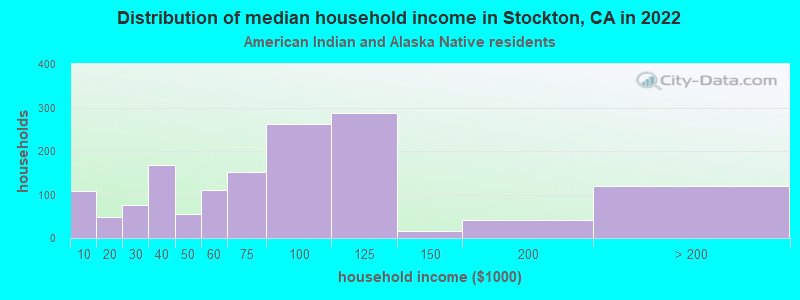
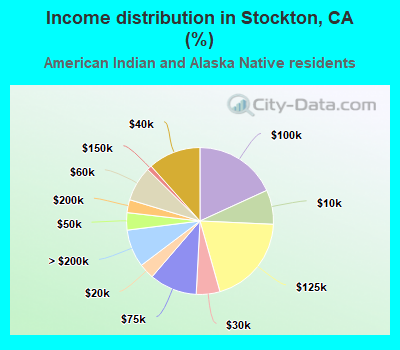
Income statistics for American Indian and Alaska Native residents
Median household income in Stockton, CA in 2022:
Stockton:
$56,845
California:
$76,752
Change in median household income between 2000 and 2022:
Stockton, California:
+97.0%
California:
+110.0%
Number of households with income < $10k:
Stockton:
7.6% (109)
State:
5.4% (8,471)
Number of households with income $10k - 20k:
Stockton:
3.4% (49)
State:
6.0% (9,381)
Number of households with income $20k - 30k:
Stockton:
5.2% (75)
State:
5.5% (8,668)
Number of households with income $30k - 40k:
Stockton:
11.6% (167)
California:
8.3% (13,030)
Number of households with income $40k - 50k:
Stockton:
3.8% (55)
California:
6.9% (10,908)
Number of households with income $50k - 60k:
Stockton:
7.7% (111)
State:
7.1% (11,198)
Number of households with income $60k - 75k:
Stockton:
10.5% (151)
State:
9.6% (15,190)
Number of households with income $75k - 100k:
Stockton:
18.2% (262)
State:
14.1% (22,274)
Number of households with income $100k - 125k:
Stockton:
19.9% (287)
State:
11.2% (17,643)
Number of households with income $125k - 150k:
Stockton:
1.0% (15)
California:
8.3% (13,117)
Number of households with income $150k - 200k:
Stockton:
2.8% (41)
State:
8.8% (13,853)
Number of households with income > $200k:
Stockton:
8.3% (120)
California:
8.8% (13,925)
Aggregate household income in Stockton in 2022: $131,227,800
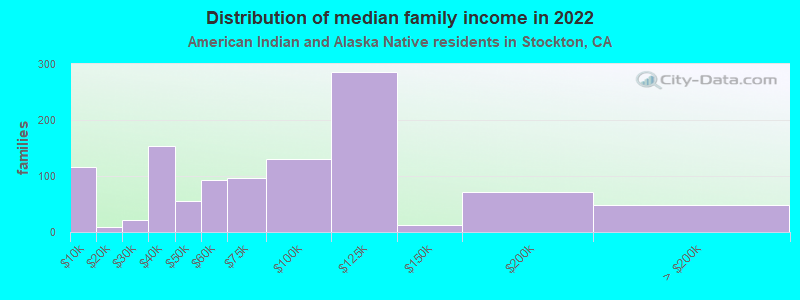
Median family income in Stockton in 2022:
Stockton:
$56,905
State:
$81,108
Number of families with income < $10k:
Stockton:
10.6% (116)
California:
5.0% (5,711)
Number of families with income $10k - 20k:
Stockton:
0.8% (9)
State:
3.7% (4,148)
Number of families with income $20k - 30k:
Stockton:
2.0% (22)
State:
4.3% (4,876)
Number of families with income $30k - 40k:
Stockton:
14.0% (153)
State:
8.8% (9,994)
Number of families with income $40k - 50k:
Stockton:
5.0% (55)
State:
7.8% (8,776)
Number of families with income $50k - 60k:
Stockton:
8.5% (93)
State:
6.9% (7,834)
Number of families with income $60k - 75k:
Stockton:
8.8% (97)
California:
9.1% (10,247)
Number of families with income $75k - 100k:
Stockton:
12.0% (131)
State:
14.8% (16,731)
Number of families with income $100k - 125k:
Stockton:
26.0% (285)
State:
12.0% (13,609)
Number of families with income $125k - 150k:
Stockton:
1.2% (13)
California:
8.0% (9,104)
Number of families with income $150k - 200k:
Stockton:
6.6% (72)
State:
9.5% (10,721)
Number of families with income > $200k:
Stockton:
4.4% (48)
California:
10.1% (11,409)
Median non-family income in Stockton in 2022:
Stockton:
$58,125
State:
$51,296
Median per capita income in Stockton in 2022:
Stockton:
$20,085
California:
$30,289
Change in median per capita income between 2000 and 2022:
Stockton, California:
+55.2%
California:
+98.9%
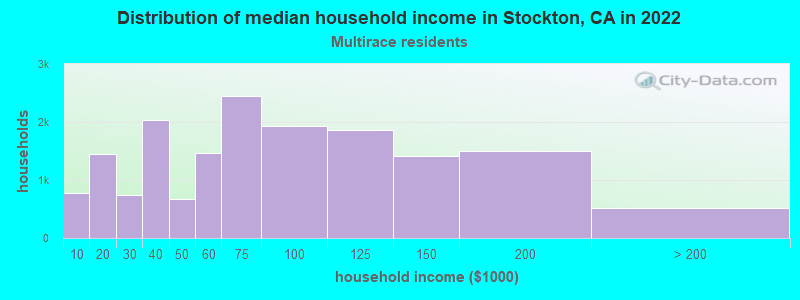
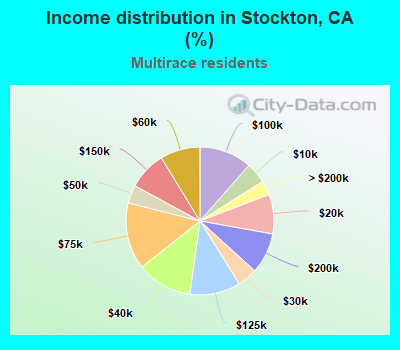
Income statistics for Multirace residents
Median household income in Stockton, CA in 2022:
Stockton:
$67,190
State:
$83,153
Change in median household income between 2000 and 2022:
Stockton, California:
+115.5%
California:
+106.0%
Number of households with income < $10k:
Stockton:
4.6% (770)
State:
4.2% (85,299)
Number of households with income $10k - 20k:
Stockton:
8.6% (1,451)
California:
6.1% (122,966)
Number of households with income $20k - 30k:
Stockton:
4.4% (736)
State:
6.4% (129,328)
Number of households with income $30k - 40k:
Stockton:
12.1% (2,036)
State:
6.4% (130,070)
Number of households with income $40k - 50k:
Stockton:
3.9% (664)
State:
6.5% (131,254)
Number of households with income $50k - 60k:
Stockton:
8.7% (1,467)
State:
6.5% (132,382)
Number of households with income $60k - 75k:
Stockton:
14.6% (2,456)
State:
9.4% (191,472)
Number of households with income $75k - 100k:
Stockton:
11.5% (1,934)
California:
13.3% (269,691)
Number of households with income $100k - 125k:
Stockton:
11.1% (1,867)
State:
10.2% (207,286)
Number of households with income $125k - 150k:
Stockton:
8.4% (1,409)
California:
7.8% (158,259)
Number of households with income $150k - 200k:
Stockton:
8.9% (1,504)
State:
10.3% (209,227)
Number of households with income > $200k:
Stockton:
3.1% (523)
State:
13.0% (263,210)
Aggregate household income in Stockton in 2022: $1,336,100,700
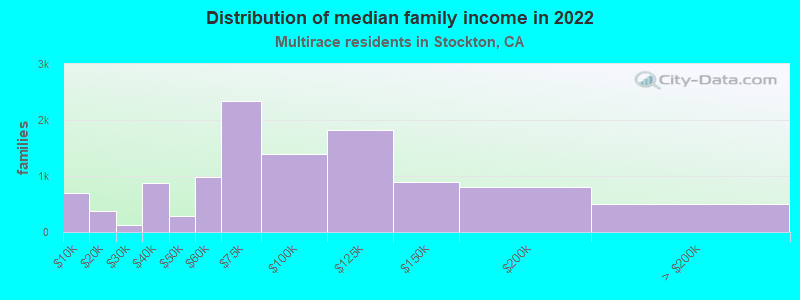
Median family income in Stockton in 2022:
Stockton:
$74,298
State:
$87,642
Number of families with income < $10k:
Stockton:
6.2% (690)
State:
3.2% (48,017)
Number of families with income $10k - 20k:
Stockton:
3.4% (377)
California:
4.1% (60,419)
Number of families with income $20k - 30k:
Stockton:
1.2% (131)
California:
6.1% (89,742)
Number of families with income $30k - 40k:
Stockton:
7.9% (872)
State:
6.2% (91,415)
Number of families with income $40k - 50k:
Stockton:
2.6% (282)
State:
6.8% (100,085)
Number of families with income $50k - 60k:
Stockton:
8.8% (974)
California:
6.7% (98,298)
Number of families with income $60k - 75k:
Stockton:
21.2% (2,344)
State:
9.5% (140,131)
Number of families with income $75k - 100k:
Stockton:
12.5% (1,385)
State:
13.8% (203,439)
Number of families with income $100k - 125k:
Stockton:
16.4% (1,817)
State:
10.4% (153,515)
Number of families with income $125k - 150k:
Stockton:
8.0% (887)
State:
8.4% (124,115)
Number of families with income $150k - 200k:
Stockton:
7.2% (798)
State:
10.9% (161,643)
Number of families with income > $200k:
Stockton:
4.5% (501)
State:
14.0% (207,317)
Median non-family income in Stockton in 2022:
Stockton:
$32,390
State:
$56,558
Change in median non-family income between 2000 and 2022:
Stockton, California:
+64.4%
State:
+100.2%
Median per capita income in Stockton in 2022:
Stockton:
$23,408
California:
$32,124
Change in median per capita income between 2000 and 2022:
Stockton, California:
+139.6%
State:
+120.4%
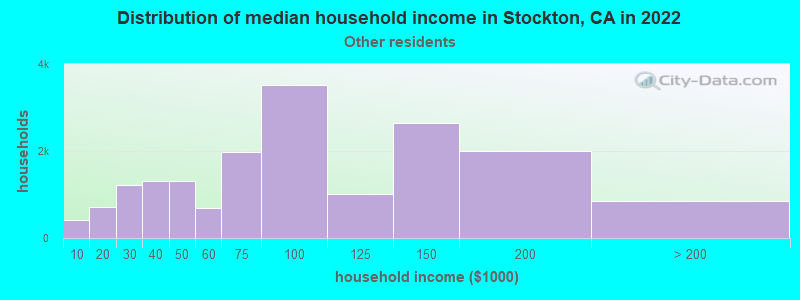
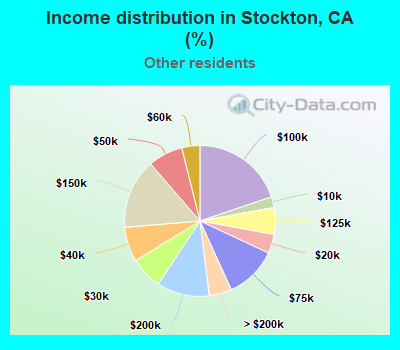
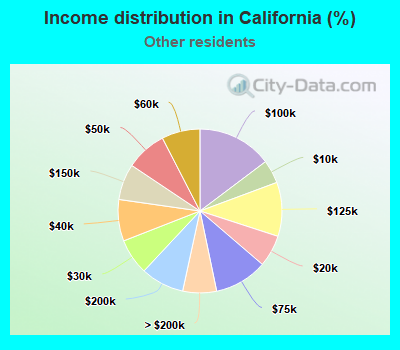
Income statistics for other residents
Median household income in Stockton, CA in 2022:
Stockton:
$85,933
State:
$71,383
Number of households with income < $10k:
Stockton:
2.3% (410)
State:
4.6% (93,035)
Number of households with income $10k - 20k:
Stockton:
4.1% (721)
California:
6.3% (126,222)
Number of households with income $20k - 30k:
Stockton:
6.9% (1,225)
State:
7.1% (142,656)
Number of households with income $30k - 40k:
Stockton:
7.5% (1,320)
State:
8.2% (165,018)
Number of households with income $40k - 50k:
Stockton:
7.4% (1,316)
California:
8.0% (161,732)
Number of households with income $50k - 60k:
Stockton:
3.9% (686)
State:
7.6% (152,152)
Number of households with income $60k - 75k:
Stockton:
11.2% (1,988)
State:
10.4% (209,951)
Number of households with income $75k - 100k:
Stockton:
19.8% (3,508)
State:
14.7% (296,102)
Number of households with income $100k - 125k:
Stockton:
5.7% (1,016)
California:
10.7% (214,281)
Number of households with income $125k - 150k:
Stockton:
15.0% (2,653)
California:
7.1% (143,092)
Number of households with income $150k - 200k:
Stockton:
11.3% (1,992)
California:
8.6% (172,215)
Number of households with income > $200k:
Stockton:
4.8% (855)
State:
6.7% (134,102)
Aggregate household income in Stockton in 2022: $1,657,506,600
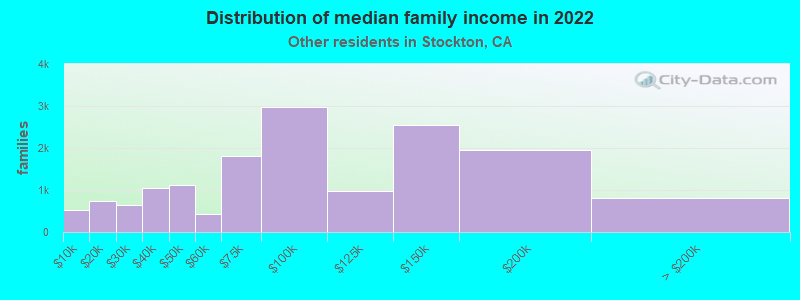
Median family income in Stockton in 2022:
Stockton:
$90,075
California:
$72,756
Number of families with income < $10k:
Stockton:
3.4% (535)
California:
4.3% (69,090)
Number of families with income $10k - 20k:
Stockton:
4.7% (737)
State:
5.1% (82,116)
Number of families with income $20k - 30k:
Stockton:
4.1% (640)
State:
7.0% (112,854)
Number of families with income $30k - 40k:
Stockton:
6.7% (1,046)
State:
8.4% (135,938)
Number of families with income $40k - 50k:
Stockton:
7.2% (1,124)
State:
8.4% (135,353)
Number of families with income $50k - 60k:
Stockton:
2.8% (429)
State:
7.7% (124,826)
Number of families with income $60k - 75k:
Stockton:
11.6% (1,800)
State:
10.7% (173,628)
Number of families with income $75k - 100k:
Stockton:
19.1% (2,972)
State:
15.2% (245,724)
Number of families with income $100k - 125k:
Stockton:
6.3% (982)
State:
10.9% (176,716)
Number of families with income $125k - 150k:
Stockton:
16.4% (2,545)
California:
7.4% (119,985)
Number of families with income $150k - 200k:
Stockton:
12.5% (1,946)
California:
8.5% (137,332)
Number of families with income > $200k:
Stockton:
5.2% (806)
State:
6.6% (106,346)
Median non-family income in Stockton in 2022:
Stockton:
$40,765
California:
$43,881
Change in median non-family income between 2000 and 2022:
Stockton, California:
+117.6%
State:
+84.6%
Median per capita income in Stockton in 2022:
Stockton:
$24,485
State:
$25,164
Discuss Stockton, California (CA) on our hugely popular California forum.