The median household income in Stony Brook, NY in 2022 was $142,327, which was 44.1% greater than the median annual income of $79,557 across the entire state of New York. Compared to the median income of $90,009 in 2000 this represents an increase of 36.8%. The per capita income in 2022 was $70,930, which means an increase of 50.3% compared to 2000 when it was $35,247.
Whole page based on the data from 2000 / 2022 when the population of Stony Brook, New York was 13,727 / 12,509
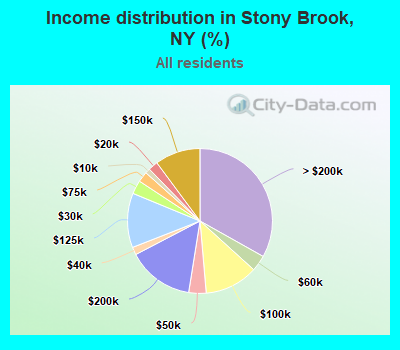
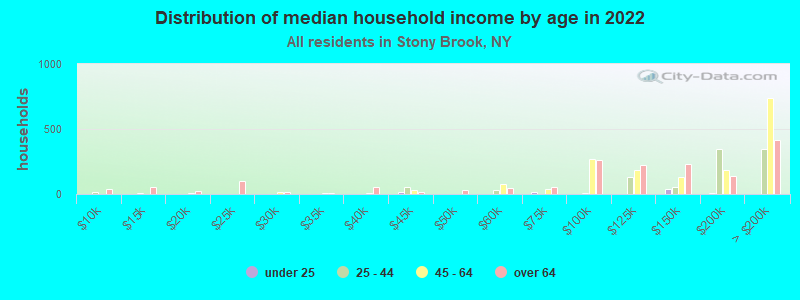
Income statistics for all residents
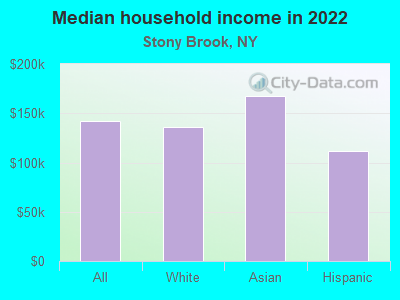
Median household income in Stony Brook, NY in 2022:
Stony Brook:
$142,328
New York:
$79,557
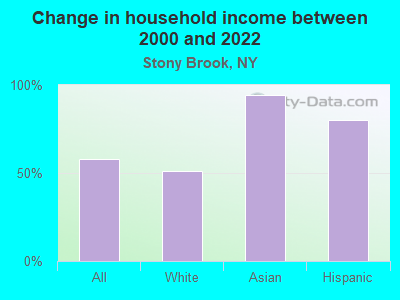
Change in median household income between 2000 and 2022:
Stony Brook, New York:
+58.1%
State:
+83.3%
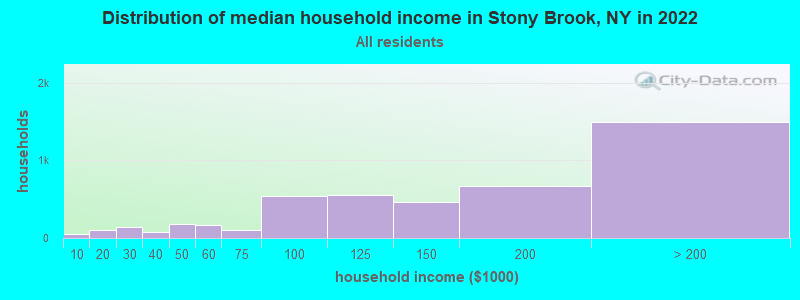
Number of households with income < $10k:
Stony Brook:
1.1% (50)
State:
6.8% (527,598)
Number of households with income $10k - 20k:
Stony Brook:
2.2% (97)
State:
7.4% (574,940)
Number of households with income $20k - 30k:
Stony Brook:
3.0% (137)
New York:
6.7% (517,718)
Number of households with income $30k - 40k:
Stony Brook:
1.7% (77)
New York:
6.5% (506,674)
Number of households with income $40k - 50k:
Stony Brook:
3.9% (175)
State:
6.1% (470,439)
Number of households with income $50k - 60k:
Stony Brook:
3.6% (161)
New York:
5.8% (454,042)
Number of households with income $60k - 75k:
Stony Brook:
2.3% (104)
New York:
8.5% (657,508)
Number of households with income $75k - 100k:
Stony Brook:
11.9% (536)
State:
11.6% (899,824)
Number of households with income $100k - 125k:
Stony Brook:
12.2% (548)
State:
9.3% (723,825)
Number of households with income $125k - 150k:
Stony Brook:
10.1% (457)
New York:
7.1% (552,420)
Number of households with income $150k - 200k:
Stony Brook:
14.8% (668)
State:
9.4% (727,051)
Number of households with income > $200k:
Stony Brook:
33.2% (1,493)
New York:
15.0% (1,162,269)
Aggregate household income in Stony Brook in 2022: $858,044,273
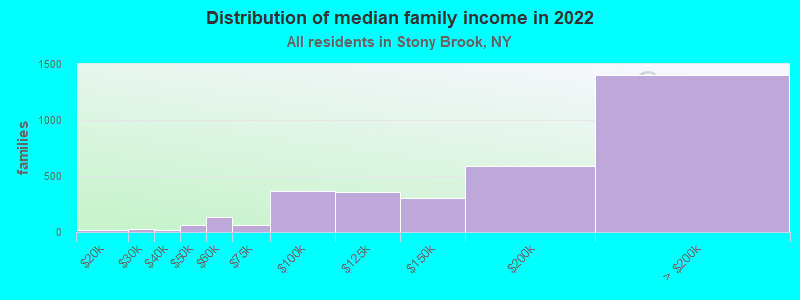
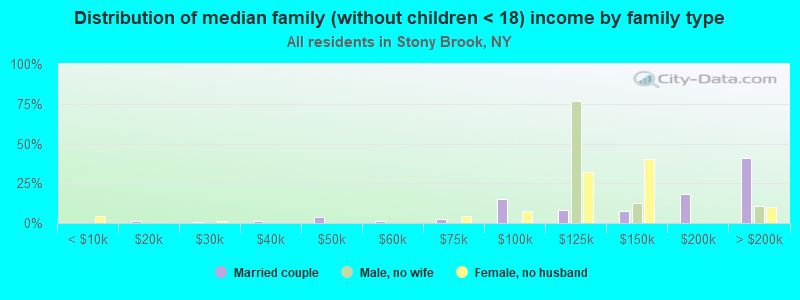
Median family income in Stony Brook in 2022:
Stony Brook:
$167,257
State:
$99,066
Number of families with income < $10k:
Stony Brook:
0.3% (9)
State:
4.2% (197,409)
Number of families with income $10k - 20k:
Stony Brook:
0.5% (17)
New York:
4.3% (205,373)
Number of families with income $20k - 30k:
Stony Brook:
0.8% (25)
State:
5.1% (241,229)
Number of families with income $30k - 40k:
Stony Brook:
0.6% (19)
New York:
5.5% (259,233)
Number of families with income $40k - 50k:
Stony Brook:
1.8% (59)
State:
5.5% (259,113)
Number of families with income $50k - 60k:
Stony Brook:
3.9% (130)
New York:
5.4% (255,320)
Number of families with income $60k - 75k:
Stony Brook:
1.9% (63)
New York:
8.2% (388,624)
Number of families with income $75k - 100k:
Stony Brook:
10.9% (366)
State:
12.3% (583,110)
Number of families with income $100k - 125k:
Stony Brook:
10.7% (359)
New York:
10.6% (500,579)
Number of families with income $125k - 150k:
Stony Brook:
9.2% (308)
State:
8.5% (400,594)
Number of families with income $150k - 200k:
Stony Brook:
17.6% (589)
New York:
11.6% (551,650)
Number of families with income > $200k:
Stony Brook:
41.9% (1,405)
State:
18.9% (895,998)
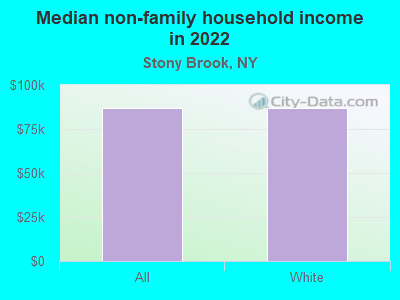
Median non-family income in Stony Brook in 2022:
Stony Brook:
$87,094
State:
$50,181
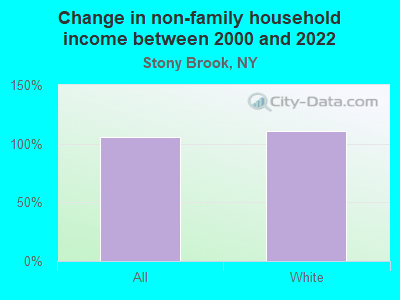
Change in median non-family income between 2000 and 2022:
Stony Brook, New York:
+106.0%
State:
+85.4%
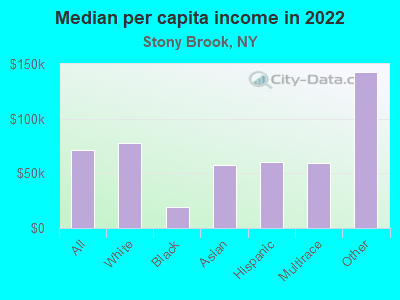
Median per capita income in Stony Brook in 2022:
Stony Brook:
$70,930
State:
$47,421
Change in median per capita income between 2000 and 2022:
Stony Brook, New York:
+101.2%
State:
+102.7%
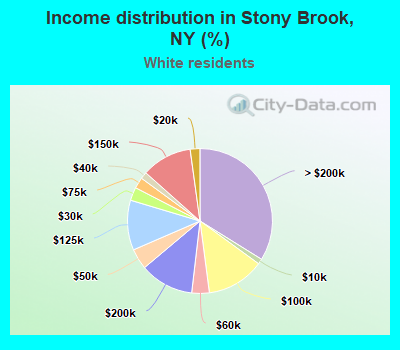
Income statistics for White residents
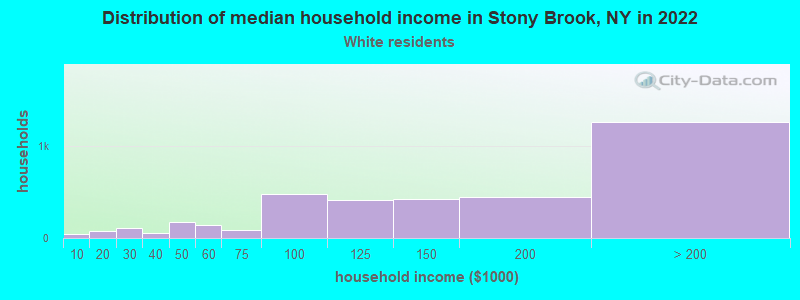
Median household income in Stony Brook, NY in 2022:
Stony Brook:
$135,865
State:
$89,408
Change in median household income between 2000 and 2022:
Stony Brook, New York:
+51.1%
New York:
+85.5%
Number of households with income < $10k:
Stony Brook:
1.2% (44)
New York:
4.8% (225,550)
Number of households with income $10k - 20k:
Stony Brook:
2.2% (81)
New York:
6.1% (289,425)
Number of households with income $20k - 30k:
Stony Brook:
3.0% (110)
New York:
5.9% (280,254)
Number of households with income $30k - 40k:
Stony Brook:
1.5% (57)
New York:
6.1% (288,263)
Number of households with income $40k - 50k:
Stony Brook:
4.6% (172)
State:
5.9% (278,079)
Number of households with income $50k - 60k:
Stony Brook:
3.9% (146)
State:
5.7% (267,554)
Number of households with income $60k - 75k:
Stony Brook:
2.4% (91)
State:
8.4% (398,344)
Number of households with income $75k - 100k:
Stony Brook:
12.9% (480)
State:
11.8% (554,841)
Number of households with income $100k - 125k:
Stony Brook:
11.1% (415)
New York:
10.0% (469,794)
Number of households with income $125k - 150k:
Stony Brook:
11.3% (419)
State:
7.6% (360,467)
Number of households with income $150k - 200k:
Stony Brook:
12.0% (448)
New York:
10.1% (477,078)
Number of households with income > $200k:
Stony Brook:
33.9% (1,261)
New York:
17.6% (829,233)
Aggregate household income in Stony Brook in 2022: $698,071,061
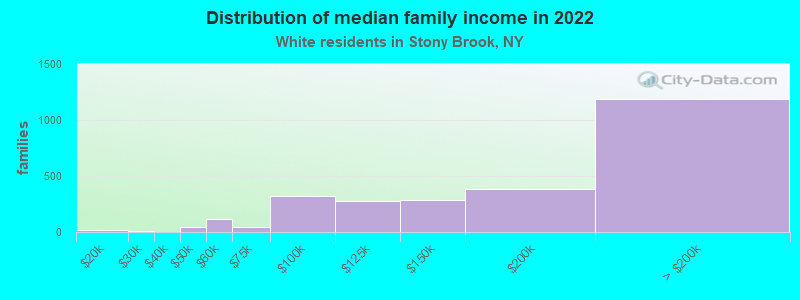
Median family income in Stony Brook in 2022:
Stony Brook:
$169,170
New York:
$115,170
Number of families with income < $10k:
Stony Brook:
0.2% (7)
State:
2.5% (68,851)
Number of families with income $10k - 20k:
Stony Brook:
0.6% (17)
State:
3.0% (83,127)
Number of families with income $20k - 30k:
Stony Brook:
0.5% (13)
State:
3.5% (97,578)
Number of families with income $40k - 50k:
Stony Brook:
1.8% (48)
State:
4.7% (130,902)
Number of families with income $50k - 60k:
Stony Brook:
4.4% (119)
State:
4.9% (135,118)
Number of families with income $60k - 75k:
Stony Brook:
1.8% (48)
State:
7.8% (216,254)
Number of families with income $75k - 100k:
Stony Brook:
12.0% (325)
New York:
12.4% (342,382)
Number of families with income $100k - 125k:
Stony Brook:
10.2% (275)
New York:
11.4% (314,917)
Number of families with income $125k - 150k:
Stony Brook:
10.5% (284)
State:
9.4% (260,489)
Number of families with income $150k - 200k:
Stony Brook:
14.1% (381)
New York:
13.2% (365,586)
Number of families with income > $200k:
Stony Brook:
43.9% (1,187)
State:
23.2% (642,319)
Median non-family income in Stony Brook in 2022:
Stony Brook:
$86,851
State:
$54,783
Change in median non-family income between 2000 and 2022:
Stony Brook, New York:
+110.8%
State:
+87.9%
Median per capita income in Stony Brook in 2022:
Stony Brook:
$77,817
State:
$57,640
Change in median per capita income between 2000 and 2022:
Stony Brook, New York:
+114.2%
State:
+111.6%
Income statistics for Black or African American residents
Number of households with income < $10k:
Stony Brook:
0.0% (0)
State:
12.0% (128,500)
Number of households with income $10k - 20k:
Stony Brook:
0.0% (0)
State:
10.0% (107,541)
Number of households with income $20k - 30k:
Stony Brook:
0.0% (0)
State:
8.4% (90,192)
Number of households with income $30k - 40k:
Stony Brook:
0.0% (0)
State:
7.4% (79,579)
Number of households with income $40k - 50k:
Stony Brook:
0.0% (0)
State:
6.8% (72,491)
Number of households with income $50k - 60k:
Stony Brook:
0.0% (0)
New York:
6.7% (71,309)
Number of households with income $60k - 75k:
Stony Brook:
0.0% (0)
State:
8.9% (95,050)
Number of households with income $75k - 100k:
Stony Brook:
100.0% (14)
State:
11.5% (123,569)
Number of households with income $100k - 125k:
Stony Brook:
0.0% (0)
State:
8.1% (86,632)
Number of households with income $125k - 150k:
Stony Brook:
0.0% (0)
New York:
6.0% (64,788)
Number of households with income $150k - 200k:
Stony Brook:
0.0% (0)
State:
7.2% (76,644)
Number of households with income > $200k:
Stony Brook:
0.0% (0)
State:
7.0% (75,062)
Aggregate household income in Stony Brook in 2022: $12,877,207
Median per capita income in Stony Brook in 2022:
Stony Brook:
$19,328
New York:
$31,947
Change in median per capita income between 2000 and 2022:: -42.3%
Stony Brook, New York:
-42.3%
New York:
+106.1%
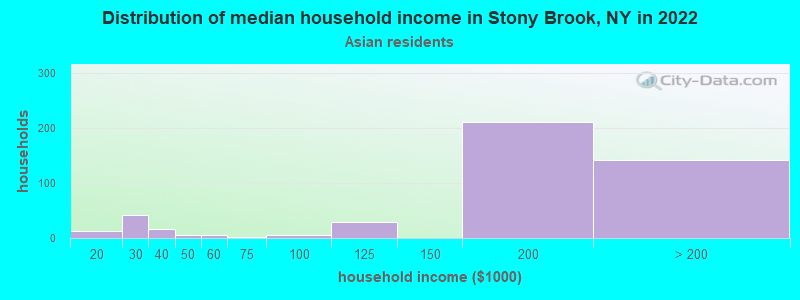
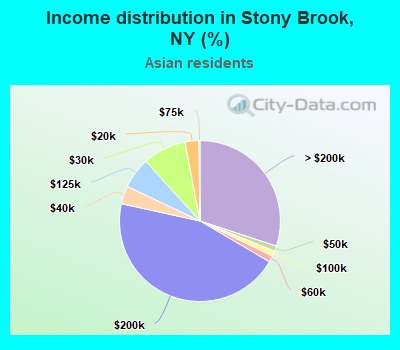
Income statistics for Asian residents
Median household income in Stony Brook, NY in 2022:
Stony Brook:
$167,716
New York:
$89,947
Change in median household income between 2000 and 2022:
Stony Brook, New York:
+94.5%
State:
+98.1%
Number of households with income < $10k:
Stony Brook:
0.0% (0)
New York:
6.9% (42,537)
Number of households with income $10k - 20k:
Stony Brook:
2.8% (13)
New York:
7.3% (44,745)
Number of households with income $20k - 30k:
Stony Brook:
8.7% (41)
State:
6.2% (38,249)
Number of households with income $30k - 40k:
Stony Brook:
3.6% (17)
State:
5.5% (33,993)
Number of households with income $40k - 50k:
Stony Brook:
1.1% (5)
New York:
4.8% (29,795)
Number of households with income $50k - 60k:
Stony Brook:
1.3% (6)
New York:
5.2% (32,100)
Number of households with income $60k - 75k:
Stony Brook:
0.2% (1)
State:
7.3% (44,615)
Number of households with income $75k - 100k:
Stony Brook:
1.1% (5)
State:
10.8% (66,687)
Number of households with income $100k - 125k:
Stony Brook:
6.2% (29)
New York:
8.2% (50,233)
Number of households with income $125k - 150k:
Stony Brook:
0.0% (0)
State:
7.2% (44,299)
Number of households with income $150k - 200k:
Stony Brook:
45.0% (211)
State:
10.4% (63,837)
Number of households with income > $200k:
Stony Brook:
30.1% (141)
New York:
20.1% (123,891)
Aggregate household income in Stony Brook in 2022: $90,325,622
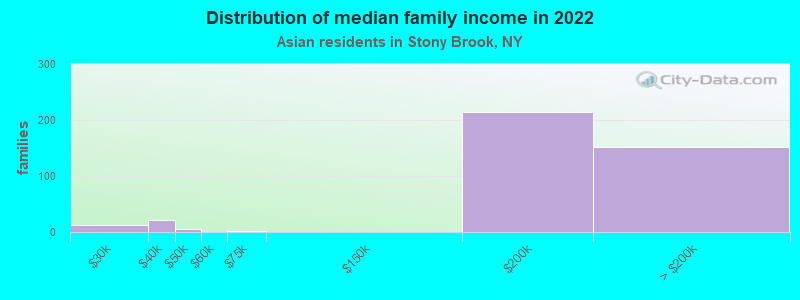
Median family income in Stony Brook in 2022:
Stony Brook:
$169,619
State:
$98,136
Number of families with income $20k - 30k:
Stony Brook:
3.0% (12)
State:
6.4% (27,990)
Number of families with income $30k - 40k:
Stony Brook:
5.3% (22)
State:
6.2% (26,994)
Number of families with income $40k - 50k:
Stony Brook:
1.3% (5)
New York:
5.2% (22,750)
Number of families with income $60k - 75k:
Stony Brook:
0.2% (1)
State:
7.6% (33,120)
Number of families with income $150k - 200k:
Stony Brook:
53.0% (215)
State:
11.0% (48,177)
Number of families with income > $200k:
Stony Brook:
37.1% (151)
State:
22.2% (97,322)
Median per capita income in Stony Brook in 2022:
Stony Brook:
$57,673
State:
$46,726
Change in median per capita income between 2000 and 2022:
Stony Brook, New York:
+142.3%
State:
+126.6%
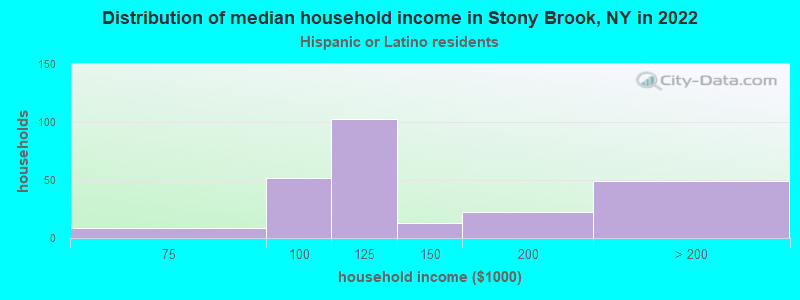
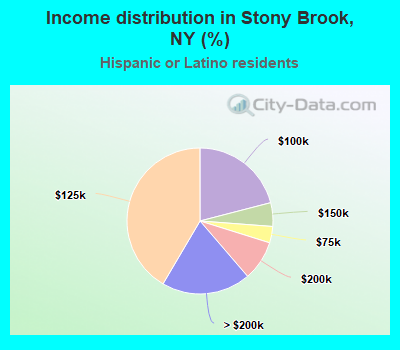
Income statistics for Hispanic or Latino residents
Median household income in Stony Brook, NY in 2022:
Stony Brook:
$112,164
State:
$60,468
Change in median household income between 2000 and 2022:
Stony Brook, New York:
+80.2%
State:
+98.3%
Number of households with income < $10k:
Stony Brook:
0.0% (0)
New York:
9.9% (127,185)
Number of households with income $10k - 20k:
Stony Brook:
0.0% (0)
State:
10.7% (136,699)
Number of households with income $20k - 30k:
Stony Brook:
0.0% (0)
State:
8.1% (102,991)
Number of households with income $30k - 40k:
Stony Brook:
0.0% (0)
New York:
7.8% (100,149)
Number of households with income $40k - 50k:
Stony Brook:
0.0% (0)
New York:
6.9% (87,760)
Number of households with income $50k - 60k:
Stony Brook:
0.0% (0)
State:
6.3% (80,968)
Number of households with income $60k - 75k:
Stony Brook:
3.6% (9)
State:
8.7% (110,631)
Number of households with income $75k - 100k:
Stony Brook:
21.0% (52)
State:
11.2% (142,787)
Number of households with income $100k - 125k:
Stony Brook:
41.5% (103)
State:
8.2% (104,850)
Number of households with income $125k - 150k:
Stony Brook:
5.2% (13)
State:
6.3% (80,274)
Number of households with income $150k - 200k:
Stony Brook:
8.9% (22)
State:
7.4% (95,117)
Number of households with income > $200k:
Stony Brook:
19.8% (49)
State:
8.6% (109,514)
Aggregate household income in Stony Brook in 2022: $47,072,007
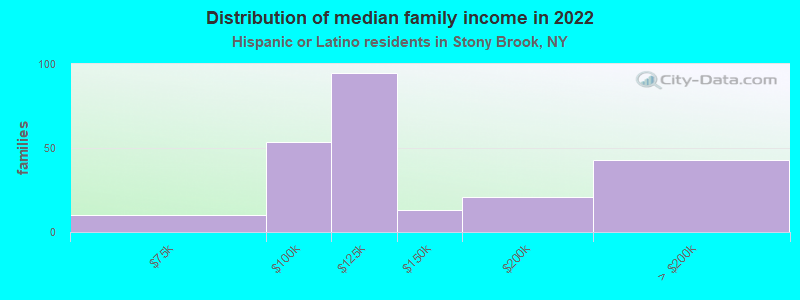
Median family income in Stony Brook in 2022:
Stony Brook:
$107,090
State:
$68,770
Number of families with income $60k - 75k:
Stony Brook:
4.3% (10)
New York:
9.3% (78,564)
Number of families with income $75k - 100k:
Stony Brook:
22.8% (54)
New York:
12.6% (106,685)
Number of families with income $100k - 125k:
Stony Brook:
40.3% (95)
State:
9.4% (79,139)
Number of families with income $125k - 150k:
Stony Brook:
5.5% (13)
New York:
6.9% (58,255)
Number of families with income $150k - 200k:
Stony Brook:
8.8% (21)
New York:
8.3% (69,877)
Number of families with income > $200k:
Stony Brook:
18.3% (43)
New York:
9.3% (78,555)
Median per capita income in Stony Brook in 2022:
Stony Brook:
$59,938
New York:
$29,761
Change in median per capita income between 2000 and 2022:
Stony Brook, New York:
+85.7%
State:
+132.7%
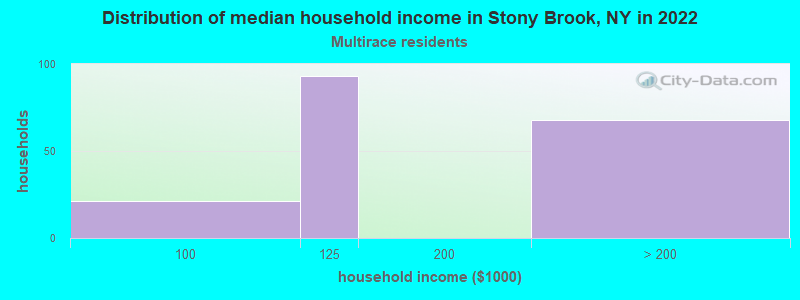
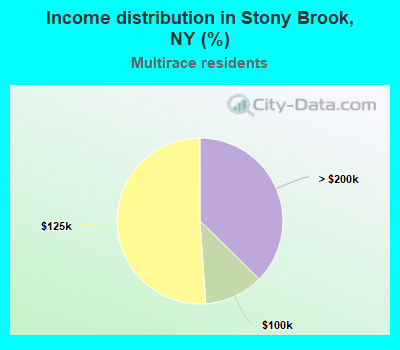
Income statistics for Multirace residents
Number of households with income < $10k:
Stony Brook:
0.0% (0)
New York:
8.9% (57,924)
Number of households with income $10k - 20k:
Stony Brook:
0.0% (0)
State:
8.7% (56,590)
Number of households with income $20k - 30k:
Stony Brook:
0.0% (0)
New York:
7.1% (46,287)
Number of households with income $30k - 40k:
Stony Brook:
0.0% (0)
New York:
6.9% (45,132)
Number of households with income $40k - 50k:
Stony Brook:
0.0% (0)
State:
5.8% (37,946)
Number of households with income $50k - 60k:
Stony Brook:
0.0% (0)
State:
5.6% (36,410)
Number of households with income $60k - 75k:
Stony Brook:
0.0% (0)
State:
7.8% (50,819)
Number of households with income $75k - 100k:
Stony Brook:
11.5% (21)
State:
11.7% (76,024)
Number of households with income $100k - 125k:
Stony Brook:
51.1% (93)
State:
9.3% (60,635)
Number of households with income $125k - 150k:
Stony Brook:
0.0% (0)
State:
6.2% (40,533)
Number of households with income $150k - 200k:
Stony Brook:
0.0% (0)
State:
8.6% (56,409)
Number of households with income > $200k:
Stony Brook:
37.4% (68)
New York:
13.4% (87,442)
Aggregate household income in Stony Brook in 2022: $42,328,782
Median per capita income in Stony Brook in 2022:
Stony Brook:
$59,848
New York:
$36,931
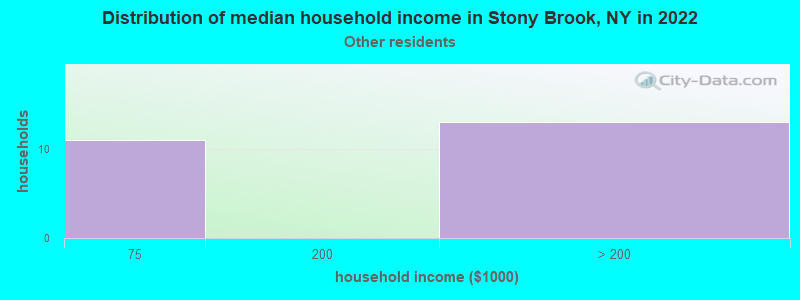
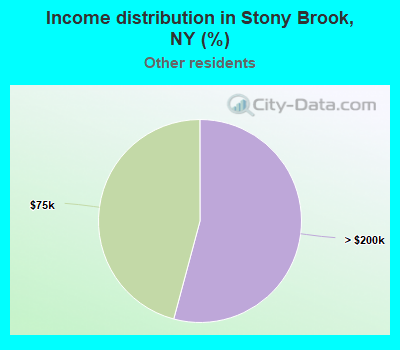
Income statistics for other residents
Number of households with income < $10k:
Stony Brook:
0.0% (0)
State:
10.3% (69,252)
Number of households with income $10k - 20k:
Stony Brook:
0.0% (0)
New York:
11.0% (73,890)
Number of households with income $20k - 30k:
Stony Brook:
0.0% (0)
State:
8.8% (59,096)
Number of households with income $30k - 40k:
Stony Brook:
0.0% (0)
New York:
8.1% (54,418)
Number of households with income $40k - 50k:
Stony Brook:
0.0% (0)
New York:
7.3% (49,042)
Number of households with income $50k - 60k:
Stony Brook:
0.0% (0)
New York:
6.5% (43,945)
Number of households with income $60k - 75k:
Stony Brook:
45.8% (11)
State:
9.5% (64,087)
Number of households with income $75k - 100k:
Stony Brook:
0.0% (0)
New York:
10.9% (73,094)
Number of households with income $100k - 125k:
Stony Brook:
0.0% (0)
State:
7.9% (53,055)
Number of households with income $125k - 150k:
Stony Brook:
0.0% (0)
State:
5.9% (39,446)
Number of households with income $150k - 200k:
Stony Brook:
0.0% (0)
New York:
7.2% (48,653)
Number of households with income > $200k:
Stony Brook:
54.2% (13)
New York:
6.6% (44,703)
Median per capita income in Stony Brook in 2022:
Stony Brook:
$142,625
State:
$26,975
Discuss Stony Brook, New York (NY) on our hugely popular New York forum.