The median household income in Stratford, OK in 2022 was $37,367, which was 59.7% less than the median annual income of $59,673 across the entire state of Oklahoma. Compared to the median income of $19,375 in 2000 this represents an increase of 48.1%. The per capita income in 2022 was $19,891, which means an increase of 43.5% compared to 2000 when it was $11,247.
Whole page based on the data from 2000 / 2022 when the population of Stratford, Oklahoma was 1,474 / 1,369
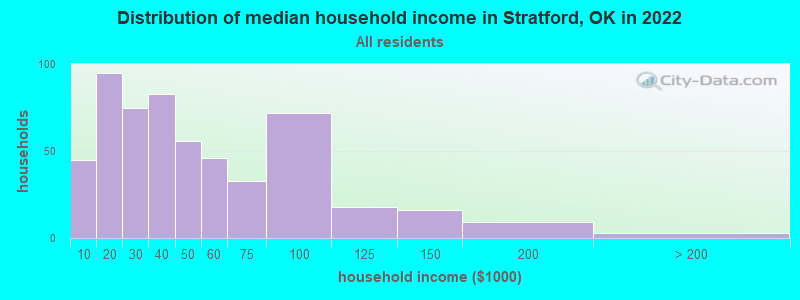
Income statistics for all residents
Median household income in Stratford, OK in 2022:
Stratford:
$37,367
State:
$59,673
Change in median household income between 2000 and 2022:
Stratford, Oklahoma:
+92.9%
State:
+78.7%
Number of households with income < $10k:
Stratford:
8.2% (45)
State:
6.4% (100,950)
Number of households with income $10k - 20k:
Stratford:
17.2% (95)
State:
8.8% (137,709)
Number of households with income $20k - 30k:
Stratford:
13.6% (75)
State:
9.1% (143,661)
Number of households with income $30k - 40k:
Stratford:
15.1% (83)
State:
9.0% (141,098)
Number of households with income $40k - 50k:
Stratford:
10.2% (56)
Oklahoma:
8.9% (140,217)
Number of households with income $50k - 60k:
Stratford:
8.3% (46)
State:
8.1% (126,882)
Number of households with income $60k - 75k:
Stratford:
6.0% (33)
Oklahoma:
10.0% (157,916)
Number of households with income $75k - 100k:
Stratford:
13.1% (72)
Oklahoma:
12.4% (195,015)
Number of households with income $100k - 125k:
Stratford:
3.3% (18)
State:
9.0% (141,779)
Number of households with income $125k - 150k:
Stratford:
2.9% (16)
State:
5.8% (91,594)
Number of households with income $150k - 200k:
Stratford:
1.6% (9)
State:
6.3% (98,589)
Number of households with income > $200k:
Stratford:
0.5% (3)
Oklahoma:
6.2% (97,770)
Aggregate household income in Stratford in 2022: $26,691,230
Median family income in Stratford in 2022:
Stratford:
$46,871
Oklahoma:
$75,476
Number of families with income < $10k:
Stratford:
9.6% (30)
State:
4.2% (42,724)
Number of families with income $10k - 20k:
Stratford:
4.4% (14)
State:
4.9% (49,571)
Number of families with income $20k - 30k:
Stratford:
12.8% (40)
Oklahoma:
6.3% (64,367)
Number of families with income $30k - 40k:
Stratford:
15.7% (49)
State:
7.5% (76,467)
Number of families with income $40k - 50k:
Stratford:
10.0% (31)
Oklahoma:
8.3% (84,578)
Number of families with income $50k - 60k:
Stratford:
12.9% (40)
Oklahoma:
7.8% (79,642)
Number of families with income $60k - 75k:
Stratford:
7.7% (24)
State:
10.6% (108,169)
Number of families with income $75k - 100k:
Stratford:
16.6% (51)
Oklahoma:
14.6% (148,857)
Number of families with income $100k - 125k:
Stratford:
2.9% (9)
State:
11.2% (113,480)
Number of families with income $125k - 150k:
Stratford:
3.5% (11)
Oklahoma:
7.6% (77,253)
Number of families with income $150k - 200k:
Stratford:
2.9% (9)
State:
8.4% (85,947)
Number of families with income > $200k:
Stratford:
1.0% (3)
State:
8.5% (86,531)
Median non-family income in Stratford in 2022:
Stratford:
$25,296
State:
$35,419
Change in median non-family income between 2000 and 2022:
Stratford, Oklahoma:
+145.3%
State:
+83.2%
Median per capita income in Stratford in 2022:
Stratford:
$19,891
Oklahoma:
$32,930
Change in median per capita income between 2000 and 2022:
Stratford, Oklahoma:
+76.9%
State:
+86.6%
Income statistics for White residents
Median household income in Stratford, OK in 2022:
Stratford:
$38,670
Oklahoma:
$63,444
Change in median household income between 2000 and 2022:
Stratford, Oklahoma:
+91.1%
Oklahoma:
+79.3%
Number of households with income < $10k:
Stratford:
8.7% (34)
Oklahoma:
5.5% (60,994)
Number of households with income $10k - 20k:
Stratford:
19.9% (78)
State:
8.2% (91,263)
Number of households with income $20k - 30k:
Stratford:
7.7% (30)
Oklahoma:
8.7% (96,988)
Number of households with income $30k - 40k:
Stratford:
15.3% (60)
Oklahoma:
8.4% (93,121)
Number of households with income $40k - 50k:
Stratford:
9.7% (38)
Oklahoma:
8.6% (95,446)
Number of households with income $50k - 60k:
Stratford:
10.2% (40)
Oklahoma:
7.9% (87,723)
Number of households with income $60k - 75k:
Stratford:
7.4% (29)
State:
9.9% (109,955)
Number of households with income $75k - 100k:
Stratford:
12.8% (50)
State:
12.9% (143,880)
Number of households with income $100k - 125k:
Stratford:
2.6% (10)
Oklahoma:
9.7% (107,851)
Number of households with income $125k - 150k:
Stratford:
3.3% (13)
State:
6.3% (69,802)
Number of households with income $150k - 200k:
Stratford:
1.8% (7)
State:
6.9% (76,863)
Number of households with income > $200k:
Stratford:
0.5% (2)
State:
7.0% (78,099)
Aggregate household income in Stratford in 2022: $18,450,002
Median family income in Stratford in 2022:
Stratford:
$49,426
Oklahoma:
$82,251
Number of families with income < $10k:
Stratford:
9.3% (21)
State:
3.4% (24,057)
Number of families with income $10k - 20k:
Stratford:
4.5% (10)
Oklahoma:
4.1% (29,440)
Number of families with income $20k - 30k:
Stratford:
11.4% (26)
State:
5.7% (40,670)
Number of families with income $30k - 40k:
Stratford:
15.4% (35)
State:
6.5% (46,540)
Number of families with income $40k - 50k:
Stratford:
9.9% (22)
Oklahoma:
7.7% (55,082)
Number of families with income $50k - 60k:
Stratford:
14.4% (33)
State:
7.5% (53,408)
Number of families with income $60k - 75k:
Stratford:
8.6% (20)
State:
10.4% (74,624)
Number of families with income $75k - 100k:
Stratford:
15.8% (36)
State:
15.3% (109,679)
Number of families with income $100k - 125k:
Stratford:
3.0% (7)
Oklahoma:
12.0% (86,208)
Number of families with income $125k - 150k:
Stratford:
3.7% (8)
State:
8.3% (59,328)
Number of families with income $150k - 200k:
Stratford:
3.0% (7)
State:
9.4% (67,640)
Number of families with income > $200k:
Stratford:
0.9% (2)
Oklahoma:
9.7% (69,551)
Median non-family income in Stratford in 2022:
Stratford:
$23,942
State:
$36,941
Change in median non-family income between 2000 and 2022:
Stratford, Oklahoma:
+119.5%
State:
+83.5%
Median per capita income in Stratford in 2022:
Stratford:
$18,968
State:
$37,390
Change in median per capita income between 2000 and 2022:
Stratford, Oklahoma:
+54.3%
State:
+92.4%
Income statistics for Black or African American residents
Median per capita income in Stratford in 2022:
Stratford:
$2,379
State:
$24,741
Change in median per capita income between 2000 and 2022:
Stratford, Oklahoma:
+85.0%
State:
+98.7%
Income statistics for Hispanic or Latino residents
Median household income in Stratford, OK in 2022:
Stratford:
$58,506
State:
$52,856
Aggregate household income in Stratford in 2022: $449,915
Median family income in Stratford in 2022:
Stratford:
$39,538
Oklahoma:
$55,896
Median per capita income in Stratford in 2022:
Stratford:
$26,245
State:
$19,473
Income statistics for American Indian and Alaska Native residents
Median household income in Stratford, OK in 2022:
Stratford:
$51,611
State:
$53,261
Number of households with income < $10k:
Stratford:
4.3% (2)
State:
8.0% (7,959)
Number of households with income $10k - 20k:
Stratford:
12.8% (6)
Oklahoma:
11.2% (11,175)
Number of households with income $20k - 30k:
Stratford:
4.3% (2)
State:
9.7% (9,654)
Number of households with income $30k - 40k:
Stratford:
10.6% (5)
State:
9.1% (9,092)
Number of households with income $40k - 50k:
Stratford:
19.1% (9)
Oklahoma:
9.1% (9,020)
Number of households with income $50k - 60k:
Stratford:
4.3% (2)
State:
8.8% (8,714)
Number of households with income $60k - 75k:
Stratford:
6.4% (3)
State:
10.7% (10,616)
Number of households with income $75k - 100k:
Stratford:
27.7% (13)
Oklahoma:
11.5% (11,402)
Number of households with income $100k - 125k:
Stratford:
4.3% (2)
State:
8.8% (8,769)
Number of households with income $125k - 150k:
Stratford:
4.3% (2)
State:
5.0% (4,965)
Number of households with income $150k - 200k:
Stratford:
0.0% (0)
Oklahoma:
4.5% (4,512)
Number of households with income > $200k:
Stratford:
2.1% (1)
State:
3.6% (3,569)
Aggregate household income in Stratford in 2022: $3,773,062
Median family income in Stratford in 2022:
Stratford:
$60,790
State:
$61,590
Number of families with income < $10k:
Stratford:
7.6% (2)
State:
7.2% (4,788)
Number of families with income $20k - 30k:
Stratford:
14.0% (4)
Oklahoma:
7.3% (4,840)
Number of families with income $30k - 40k:
Stratford:
5.8% (2)
State:
8.6% (5,712)
Number of families with income $40k - 50k:
Stratford:
10.2% (3)
State:
9.6% (6,398)
Number of families with income $50k - 60k:
Stratford:
7.7% (2)
State:
9.9% (6,556)
Number of families with income $60k - 75k:
Stratford:
8.5% (3)
State:
10.8% (7,198)
Number of families with income $75k - 100k:
Stratford:
30.5% (10)
Oklahoma:
12.8% (8,500)
Number of families with income $100k - 125k:
Stratford:
6.7% (2)
Oklahoma:
10.6% (7,043)
Number of families with income $125k - 150k:
Stratford:
6.2% (2)
Oklahoma:
6.5% (4,331)
Number of families with income > $200k:
Stratford:
2.9% (1)
Oklahoma:
4.5% (3,014)
Median non-family income in Stratford in 2022:
Stratford:
$42,223
State:
$30,288
Median per capita income in Stratford in 2022:
Stratford:
$25,413
State:
$25,549
Income statistics for Multirace residents
Median household income in Stratford, OK in 2022:
Stratford:
$26,021
State:
$53,626
Change in median household income between 2000 and 2022:: -16.7%
Stratford, Oklahoma:
-16.7%
Oklahoma:
+81.7%
Number of households with income < $10k:
Stratford:
7.4% (10)
State:
6.8% (11,975)
Number of households with income $10k - 20k:
Stratford:
8.9% (12)
Oklahoma:
8.9% (15,797)
Number of households with income $20k - 30k:
Stratford:
44.4% (60)
State:
10.2% (18,071)
Number of households with income $30k - 40k:
Stratford:
15.6% (21)
State:
11.0% (19,477)
Number of households with income $40k - 50k:
Stratford:
8.1% (11)
State:
9.3% (16,501)
Number of households with income $50k - 60k:
Stratford:
2.2% (3)
State:
8.9% (15,635)
Number of households with income $60k - 75k:
Stratford:
0.0% (0)
State:
10.9% (19,250)
Number of households with income $75k - 100k:
Stratford:
5.9% (8)
State:
11.5% (20,279)
Number of households with income $100k - 125k:
Stratford:
5.9% (8)
Oklahoma:
8.0% (14,067)
Number of households with income $125k - 150k:
Stratford:
0.0% (0)
State:
4.9% (8,612)
Number of households with income $150k - 200k:
Stratford:
1.5% (2)
State:
5.0% (8,897)
Number of households with income > $200k:
Stratford:
0.0% (0)
State:
4.5% (7,970)
Aggregate household income in Stratford in 2022: $5,204,882
Median family income in Stratford in 2022:
Stratford:
$36,684
Oklahoma:
$62,946
Number of families with income < $10k:
Stratford:
14.5% (7)
State:
5.1% (6,084)
Number of families with income $10k - 20k:
Stratford:
9.2% (5)
State:
6.9% (8,220)
Number of families with income $20k - 30k:
Stratford:
19.0% (10)
State:
7.7% (9,202)
Number of families with income $30k - 40k:
Stratford:
24.4% (13)
State:
10.8% (12,890)
Number of families with income $40k - 50k:
Stratford:
12.6% (7)
Oklahoma:
9.6% (11,468)
Number of families with income $50k - 60k:
Stratford:
7.9% (4)
State:
7.7% (9,220)
Number of families with income $75k - 100k:
Stratford:
7.6% (4)
State:
13.1% (15,759)
Number of families with income $150k - 200k:
Stratford:
4.9% (3)
Oklahoma:
6.3% (7,594)
Median non-family income in Stratford in 2022:
Stratford:
$26,575
State:
$34,773
Change in median non-family income between 2000 and 2022:
Stratford, Oklahoma:
+28.8%
Oklahoma:
+103.1%
Median per capita income in Stratford in 2022:
Stratford:
$21,574
State:
$23,085
Change in median per capita income between 2000 and 2022:
Stratford, Oklahoma:
+32.5%
State:
+93.8%
Income statistics for other residents
Median per capita income in Stratford in 2022:
Stratford:
$65,753
State:
$21,007
Discuss Stratford, Oklahoma (OK) on our hugely popular Oklahoma forum.