Tahoma-Maple Valley, Washington (WA) income map, earnings map, and wages data
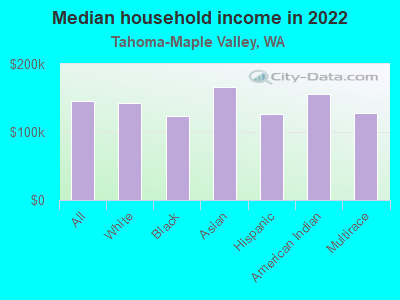
The median household income in Tahoma-Maple Valley, WA in 2022 was $144,858, which was 37.0% greater than the median annual income of $91,306 across the entire state of Washington. Compared to the median income of $66,236 in 2000 this represents an increase of 54.3%. The per capita income in 2022 was $62,022, which means an increase of 57.8% compared to 2000 when it was $26,176.
Income statistics for all residents
Median household income in Tahoma-Maple Valley, WA in 2022:| Tahoma-Maple Valley: | $144,859 |
| State: | $91,306 |
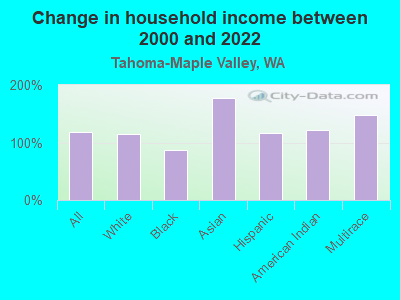
Change in median household income between 2000 and 2022:| Tahoma-Maple Valley, Washington: | +118.7% |
| Washington: | +99.5% |
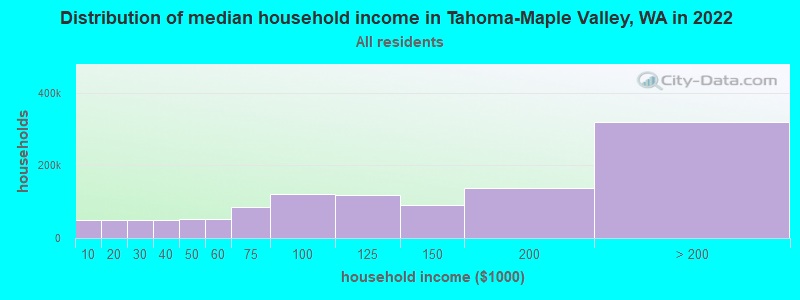
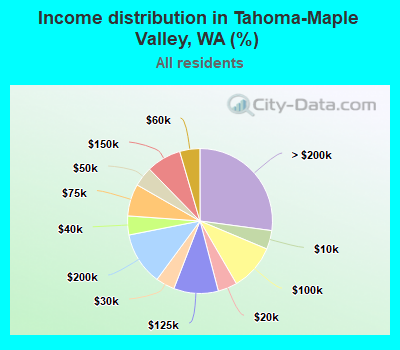
Number of households with income < $10k:| Tahoma-Maple Valley: | 4.2% (49,325) |
| Washington: | 4.5% (139,331) |
Number of households with income $10k - 20k:| Tahoma-Maple Valley: | 4.3% (50,585) |
| Washington: | 5.0% (154,508) |
Number of households with income $20k - 30k:| Tahoma-Maple Valley: | 4.2% (49,891) |
| Washington: | 5.4% (166,555) |
Number of households with income $30k - 40k:| Tahoma-Maple Valley: | 4.2% (49,956) |
| State: | 5.5% (170,324) |
Number of households with income $40k - 50k:| Tahoma-Maple Valley: | 4.4% (51,904) |
| Washington: | 6.0% (183,941) |
Number of households with income $50k - 60k:| Tahoma-Maple Valley: | 4.5% (53,186) |
| State: | 6.1% (187,395) |
Number of households with income $60k - 75k:| Tahoma-Maple Valley: | 7.2% (84,327) |
| State: | 8.7% (266,771) |
Number of households with income $75k - 100k:| Tahoma-Maple Valley: | 10.3% (121,431) |
| State: | 13.1% (404,672) |
Number of households with income $100k - 125k:| Tahoma-Maple Valley: | 9.9% (117,117) |
| Washington: | 11.0% (337,911) |
Number of households with income $125k - 150k:| Tahoma-Maple Valley: | 7.8% (91,541) |
| Washington: | 8.0% (244,934) |
Number of households with income $150k - 200k:| Tahoma-Maple Valley: | 11.8% (138,833) |
| Washington: | 10.5% (323,812) |
Number of households with income > $200k:| Tahoma-Maple Valley: | 27.1% (319,465) |
| State: | 16.2% (499,799) |
Aggregate household income in Tahoma-Maple Valley in 2022: $99,886,698,094
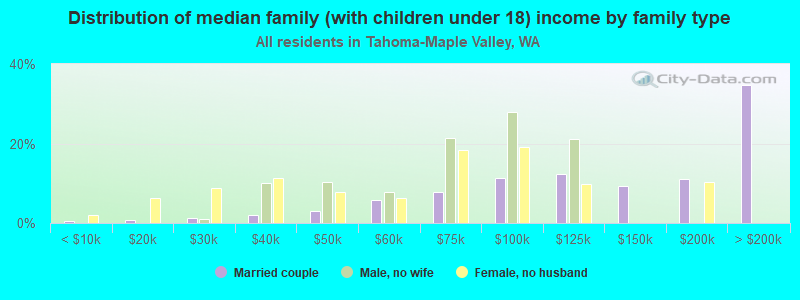
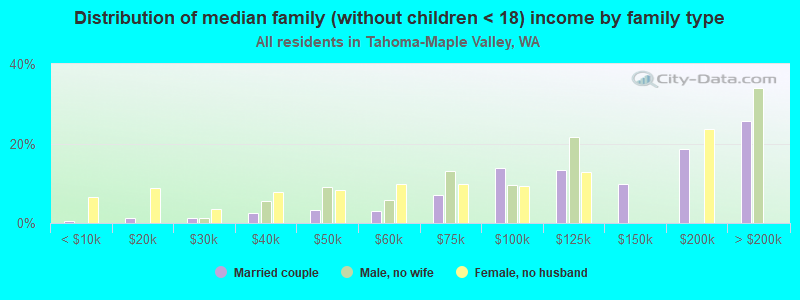
Median family income in Tahoma-Maple Valley in 2022:| Tahoma-Maple Valley: | $158,497 |
| State: | $109,192 |
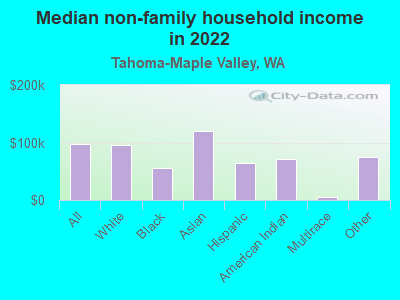
Median non-family income in Tahoma-Maple Valley in 2022:| Tahoma-Maple Valley: | $97,589 |
| State: | $57,299 |
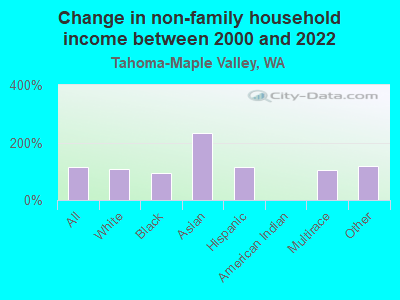
Change in median non-family income between 2000 and 2022:| Tahoma-Maple Valley, Washington: | +114.0% |
| Washington: | +94.9% |
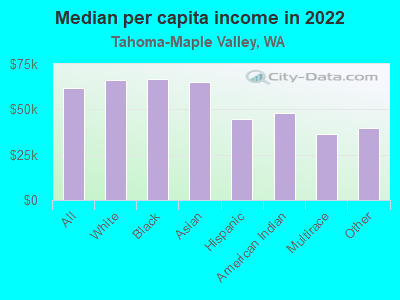
Median per capita income in Tahoma-Maple Valley in 2022:| Tahoma-Maple Valley: | $62,022 |
| State: | $50,764 |
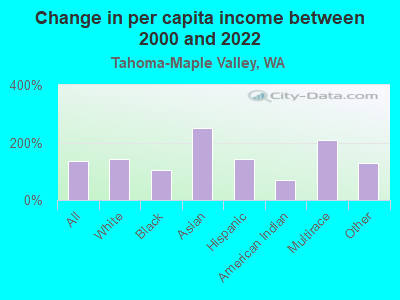
Change in median per capita income between 2000 and 2022:| Tahoma-Maple Valley, Washington: | +136.9% |
| Washington: | +121.0% |
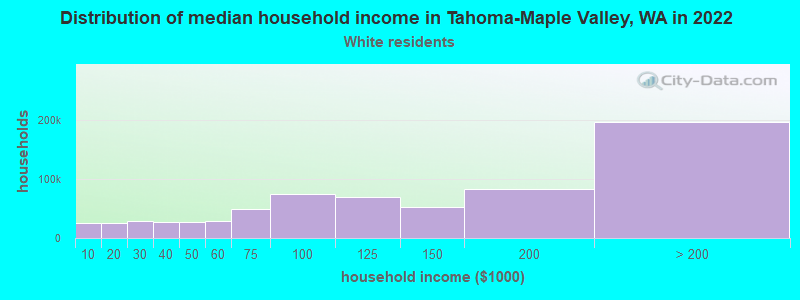
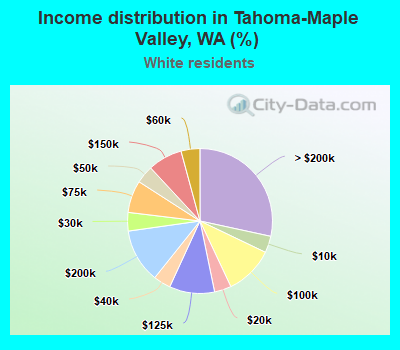
Income statistics for White residents
Median household income in Tahoma-Maple Valley, WA in 2022:| Tahoma-Maple Valley: | $142,751 |
| State: | $91,916 |
Change in median household income between 2000 and 2022:| Tahoma-Maple Valley, Washington: | +114.1% |
| Washington: | +95.4% |
Number of households with income < $10k:| Tahoma-Maple Valley: | 3.7% (25,576) |
| State: | 4.3% (95,850) |
Number of households with income $10k - 20k:| Tahoma-Maple Valley: | 3.8% (25,879) |
| State: | 4.8% (106,421) |
Number of households with income $20k - 30k:| Tahoma-Maple Valley: | 4.1% (28,586) |
| State: | 5.5% (122,860) |
Number of households with income $30k - 40k:| Tahoma-Maple Valley: | 3.9% (26,568) |
| State: | 5.4% (119,627) |
Number of households with income $40k - 50k:| Tahoma-Maple Valley: | 4.0% (27,488) |
| State: | 5.9% (132,276) |
Number of households with income $50k - 60k:| Tahoma-Maple Valley: | 4.2% (29,003) |
| State: | 6.1% (136,212) |
Number of households with income $60k - 75k:| Tahoma-Maple Valley: | 7.2% (49,539) |
| Washington: | 8.8% (196,086) |
Number of households with income $75k - 100k:| Tahoma-Maple Valley: | 10.9% (75,142) |
| Washington: | 13.4% (299,192) |
Number of households with income $100k - 125k:| Tahoma-Maple Valley: | 10.1% (69,671) |
| State: | 11.3% (252,209) |
Number of households with income $125k - 150k:| Tahoma-Maple Valley: | 7.7% (53,144) |
| State: | 7.9% (175,962) |
Number of households with income $150k - 200k:| Tahoma-Maple Valley: | 12.1% (83,131) |
| State: | 10.7% (239,156) |
Number of households with income > $200k:| Tahoma-Maple Valley: | 28.4% (195,963) |
| State: | 16.1% (359,917) |
Aggregate household income in Tahoma-Maple Valley in 2022: $59,413,186,476
Median family income in Tahoma-Maple Valley in 2022:| Tahoma-Maple Valley: | $162,819 |
| State: | $112,511 |
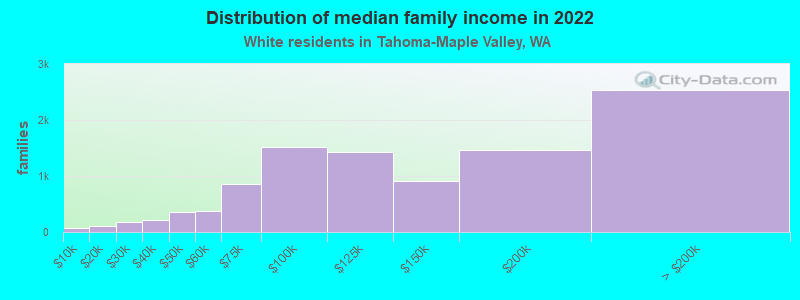
Number of families with income < $10k:| Tahoma-Maple Valley: | 0.8% (76) |
| State: | 2.4% (33,676) |
Number of families with income $10k - 20k:| Tahoma-Maple Valley: | 1.0% (103) |
| State: | 2.0% (28,228) |
Number of families with income $20k - 30k:| Tahoma-Maple Valley: | 1.7% (170) |
| Washington: | 2.9% (39,288) |
Number of families with income $30k - 40k:| Tahoma-Maple Valley: | 2.1% (215) |
| State: | 3.6% (50,190) |
Number of families with income $40k - 50k:| Tahoma-Maple Valley: | 3.6% (365) |
| Washington: | 4.6% (63,009) |
Number of families with income $50k - 60k:| Tahoma-Maple Valley: | 3.7% (375) |
| State: | 5.0% (69,270) |
Number of families with income $60k - 75k:| Tahoma-Maple Valley: | 8.5% (854) |
| Washington: | 8.2% (112,369) |
Number of families with income $75k - 100k:| Tahoma-Maple Valley: | 15.1% (1,516) |
| State: | 14.1% (194,214) |
Number of families with income $100k - 125k:| Tahoma-Maple Valley: | 14.3% (1,435) |
| State: | 13.2% (182,184) |
Number of families with income $125k - 150k:| Tahoma-Maple Valley: | 9.1% (908) |
| Washington: | 9.5% (130,928) |
Number of families with income $150k - 200k:| Tahoma-Maple Valley: | 14.6% (1,461) |
| State: | 13.7% (188,621) |
Number of families with income > $200k:| Tahoma-Maple Valley: | 25.3% (2,535) |
| Washington: | 20.8% (285,982) |
Median non-family income in Tahoma-Maple Valley in 2022:| Tahoma-Maple Valley: | $95,935 |
| Washington: | $56,103 |
Change in median non-family income between 2000 and 2022:| Tahoma-Maple Valley, Washington: | +109.2% |
| Washington: | +87.7% |
Median per capita income in Tahoma-Maple Valley in 2022:| Tahoma-Maple Valley: | $65,928 |
| State: | $55,212 |
Change in median per capita income between 2000 and 2022:| Tahoma-Maple Valley, Washington: | +143.6% |
| State: | +123.8% |
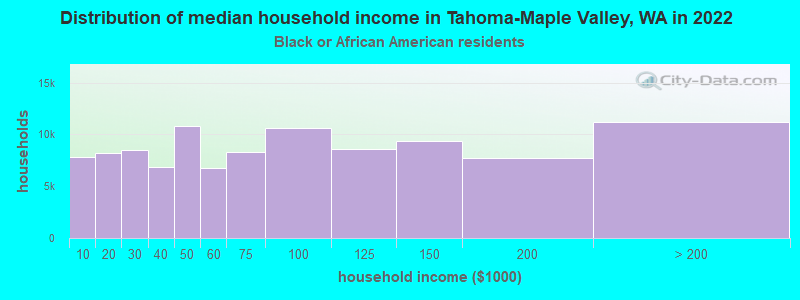
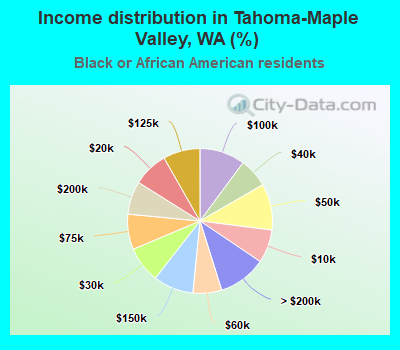
Income statistics for Black or African American residents
Median household income in Tahoma-Maple Valley, WA in 2022:| Tahoma-Maple Valley: | $123,976 |
| State: | $68,202 |
Change in median household income between 2000 and 2022:| Tahoma-Maple Valley, Washington: | +87.5% |
| State: | +89.9% |
Number of households with income < $10k:| Tahoma-Maple Valley: | 7.4% (7,799) |
| State: | 7.2% (8,014) |
Number of households with income $10k - 20k:| Tahoma-Maple Valley: | 7.8% (8,196) |
| State: | 8.0% (8,904) |
Number of households with income $20k - 30k:| Tahoma-Maple Valley: | 8.1% (8,468) |
| State: | 7.4% (8,207) |
Number of households with income $30k - 40k:| Tahoma-Maple Valley: | 6.5% (6,832) |
| State: | 5.6% (6,220) |
Number of households with income $40k - 50k:| Tahoma-Maple Valley: | 10.4% (10,838) |
| Washington: | 9.5% (10,585) |
Number of households with income $50k - 60k:| Tahoma-Maple Valley: | 6.4% (6,740) |
| Washington: | 7.3% (8,078) |
Number of households with income $60k - 75k:| Tahoma-Maple Valley: | 7.9% (8,265) |
| Washington: | 8.7% (9,704) |
Number of households with income $75k - 100k:| Tahoma-Maple Valley: | 10.1% (10,610) |
| State: | 12.9% (14,315) |
Number of households with income $100k - 125k:| Tahoma-Maple Valley: | 8.2% (8,622) |
| State: | 7.7% (8,592) |
Number of households with income $125k - 150k:| Tahoma-Maple Valley: | 9.0% (9,378) |
| State: | 8.9% (9,840) |
Number of households with income $150k - 200k:| Tahoma-Maple Valley: | 7.4% (7,744) |
| State: | 7.6% (8,434) |
Number of households with income > $200k:| Tahoma-Maple Valley: | 10.7% (11,202) |
| State: | 9.1% (10,075) |
Aggregate household income in Tahoma-Maple Valley in 2022: $106,875,072
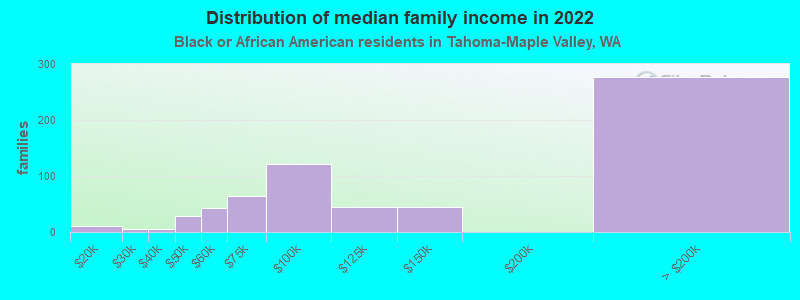
Median family income in Tahoma-Maple Valley in 2022:| Tahoma-Maple Valley: | $134,075 |
| State: | $82,165 |
Number of families with income $10k - 20k:| Tahoma-Maple Valley: | 1.6% (10) |
| State: | 7.4% (4,951) |
Number of families with income $20k - 30k:| Tahoma-Maple Valley: | 1.0% (6) |
| State: | 4.7% (3,151) |
Number of families with income $30k - 40k:| Tahoma-Maple Valley: | 0.8% (5) |
| Washington: | 5.3% (3,525) |
Number of families with income $40k - 50k:| Tahoma-Maple Valley: | 4.3% (28) |
| Washington: | 6.8% (4,558) |
Number of families with income $50k - 60k:| Tahoma-Maple Valley: | 6.5% (42) |
| Washington: | 7.0% (4,687) |
Number of families with income $60k - 75k:| Tahoma-Maple Valley: | 10.1% (65) |
| State: | 9.3% (6,231) |
Number of families with income $75k - 100k:| Tahoma-Maple Valley: | 18.9% (121) |
| State: | 14.8% (9,876) |
Number of families with income $100k - 125k:| Tahoma-Maple Valley: | 6.9% (44) |
| Washington: | 9.0% (6,018) |
Number of families with income $125k - 150k:| Tahoma-Maple Valley: | 6.9% (45) |
| State: | 9.5% (6,348) |
Number of families with income > $200k:| Tahoma-Maple Valley: | 43.1% (277) |
| Washington: | 12.0% (8,041) |
Median non-family income in Tahoma-Maple Valley in 2022:| Tahoma-Maple Valley: | $55,140 |
| State: | $49,169 |
Change in median non-family income between 2000 and 2022:| Tahoma-Maple Valley, Washington: | +92.8% |
| Washington: | +87.7% |
Median per capita income in Tahoma-Maple Valley in 2022:| Tahoma-Maple Valley: | $66,757 |
| State: | $38,209 |
Change in median per capita income between 2000 and 2022:| Tahoma-Maple Valley, Washington: | +104.5% |
| State: | +115.3% |
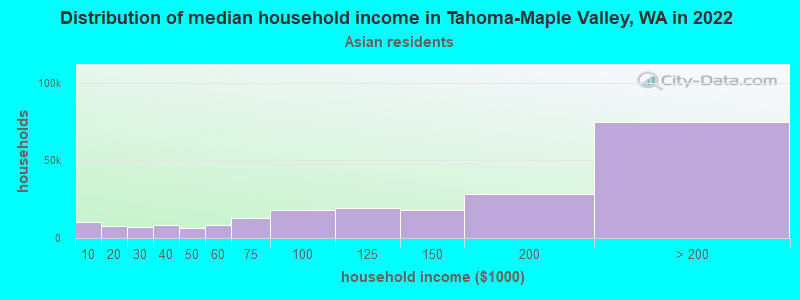
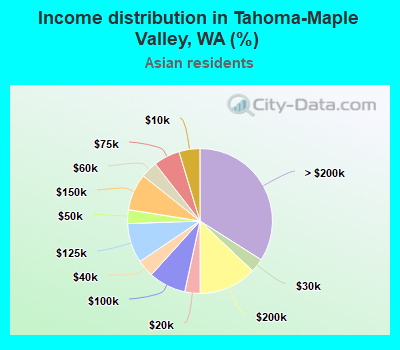
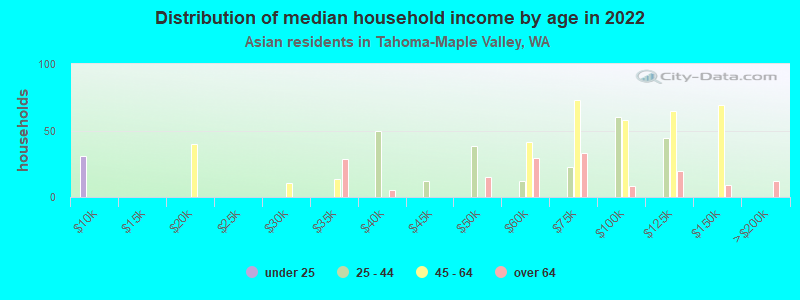
Income statistics for Asian residents
Median household income in Tahoma-Maple Valley, WA in 2022:| Tahoma-Maple Valley: | $165,682 |
| Washington: | $125,692 |
Number of households with income < $10k:| Tahoma-Maple Valley: | 4.7% (10,237) |
| State: | 4.9% (14,099) |
Number of households with income $10k - 20k:| Tahoma-Maple Valley: | 3.4% (7,515) |
| State: | 3.5% (9,873) |
Number of households with income $20k - 30k:| Tahoma-Maple Valley: | 3.1% (6,795) |
| State: | 2.9% (8,352) |
Number of households with income $30k - 40k:| Tahoma-Maple Valley: | 3.9% (8,463) |
| Washington: | 4.0% (11,415) |
Number of households with income $40k - 50k:| Tahoma-Maple Valley: | 3.1% (6,718) |
| State: | 4.0% (11,421) |
Number of households with income $50k - 60k:| Tahoma-Maple Valley: | 3.8% (8,268) |
| State: | 4.2% (12,100) |
Number of households with income $60k - 75k:| Tahoma-Maple Valley: | 5.9% (12,897) |
| Washington: | 6.3% (17,903) |
Number of households with income $75k - 100k:| Tahoma-Maple Valley: | 8.3% (18,246) |
| State: | 10.4% (29,663) |
Number of households with income $100k - 125k:| Tahoma-Maple Valley: | 8.9% (19,485) |
| State: | 9.4% (26,839) |
Number of households with income $125k - 150k:| Tahoma-Maple Valley: | 8.2% (17,996) |
| Washington: | 8.5% (24,200) |
Number of households with income $150k - 200k:| Tahoma-Maple Valley: | 12.9% (28,296) |
| Washington: | 12.6% (35,976) |
Number of households with income > $200k:| Tahoma-Maple Valley: | 34.0% (74,627) |
| State: | 29.2% (83,109) |
Aggregate household income in Tahoma-Maple Valley in 2022: $508,923,692
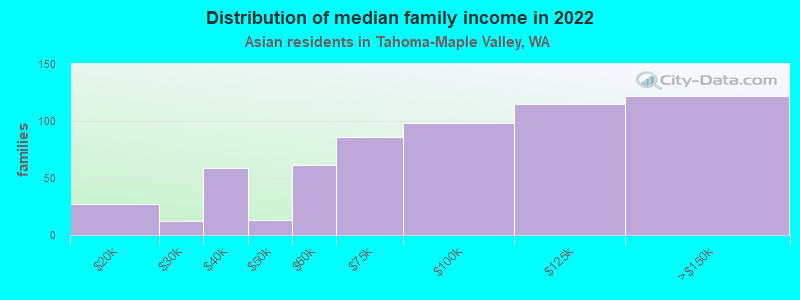
Median family income in Tahoma-Maple Valley in 2022:| Tahoma-Maple Valley: | $186,832 |
| Washington: | $143,595 |
Number of families with income $10k - 20k:| Tahoma-Maple Valley: | 4.5% (27) |
| State: | 2.2% (4,150) |
Number of families with income $20k - 30k:| Tahoma-Maple Valley: | 2.1% (12) |
| Washington: | 1.9% (3,558) |
Number of families with income $30k - 40k:| Tahoma-Maple Valley: | 10.0% (59) |
| Washington: | 3.1% (5,734) |
Number of families with income $40k - 50k:| Tahoma-Maple Valley: | 2.2% (13) |
| State: | 3.6% (6,707) |
Number of families with income $50k - 60k:| Tahoma-Maple Valley: | 10.2% (61) |
| State: | 4.1% (7,663) |
Number of families with income $60k - 75k:| Tahoma-Maple Valley: | 14.5% (86) |
| State: | 5.1% (9,490) |
Number of families with income $75k - 100k:| Tahoma-Maple Valley: | 16.5% (98) |
| State: | 11.7% (21,919) |
Number of families with income $100k - 125k:| Tahoma-Maple Valley: | 19.4% (115) |
| State: | 9.3% (17,280) |
Number of families with income $125k - 150k:| Tahoma-Maple Valley: | 20.5% (122) |
| State: | 8.4% (15,602) |
Median non-family income in Tahoma-Maple Valley in 2022:| Tahoma-Maple Valley: | $119,749 |
| State: | $84,971 |
Median per capita income in Tahoma-Maple Valley in 2022:| Tahoma-Maple Valley: | $65,128 |
| Washington: | $67,666 |
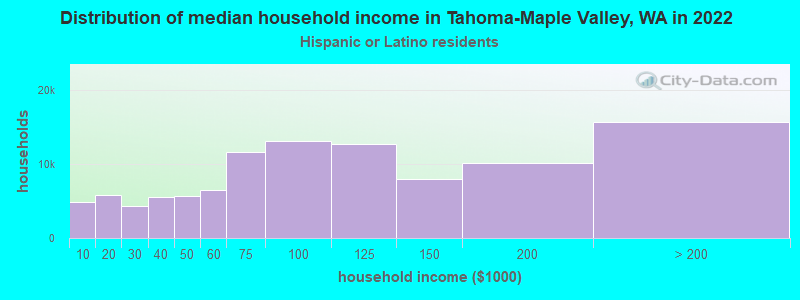
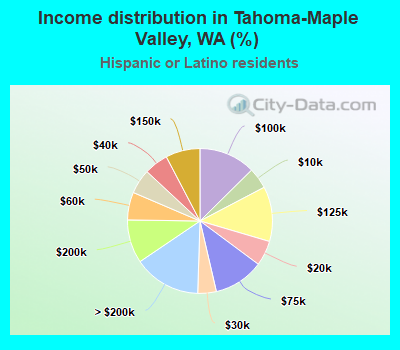
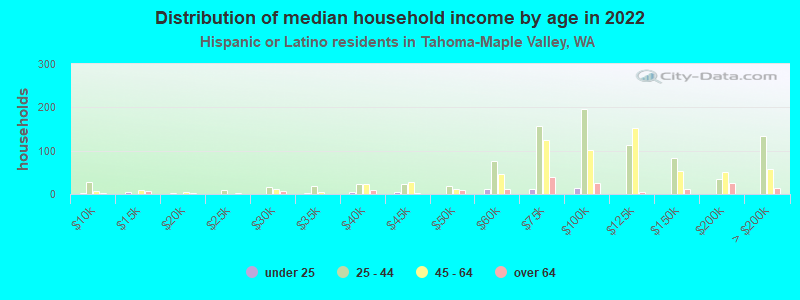
Income statistics for Hispanic or Latino residents
Median household income in Tahoma-Maple Valley, WA in 2022:| Tahoma-Maple Valley: | $125,892 |
| State: | $74,770 |
Change in median household income between 2000 and 2022:| Tahoma-Maple Valley, Washington: | +116.8% |
| State: | +128.3% |
Number of households with income < $10k:| Tahoma-Maple Valley: | 4.7% (4,915) |
| State: | 4.9% (14,456) |
Number of households with income $10k - 20k:| Tahoma-Maple Valley: | 5.6% (5,861) |
| Washington: | 5.3% (15,449) |
Number of households with income $20k - 30k:| Tahoma-Maple Valley: | 4.1% (4,321) |
| State: | 6.8% (20,016) |
Number of households with income $30k - 40k:| Tahoma-Maple Valley: | 5.4% (5,614) |
| State: | 7.7% (22,548) |
Number of households with income $40k - 50k:| Tahoma-Maple Valley: | 5.5% (5,748) |
| Washington: | 7.3% (21,450) |
Number of households with income $50k - 60k:| Tahoma-Maple Valley: | 6.2% (6,472) |
| State: | 7.7% (22,744) |
Number of households with income $60k - 75k:| Tahoma-Maple Valley: | 11.2% (11,699) |
| State: | 10.5% (30,737) |
Number of households with income $75k - 100k:| Tahoma-Maple Valley: | 12.6% (13,177) |
| State: | 14.9% (43,843) |
Number of households with income $100k - 125k:| Tahoma-Maple Valley: | 12.2% (12,786) |
| Washington: | 11.1% (32,554) |
Number of households with income $125k - 150k:| Tahoma-Maple Valley: | 7.7% (8,025) |
| Washington: | 7.4% (21,624) |
Number of households with income $150k - 200k:| Tahoma-Maple Valley: | 9.7% (10,137) |
| State: | 7.3% (21,360) |
Number of households with income > $200k:| Tahoma-Maple Valley: | 15.0% (15,701) |
| State: | 9.2% (27,055) |
Aggregate household income in Tahoma-Maple Valley in 2022: $154,533,044
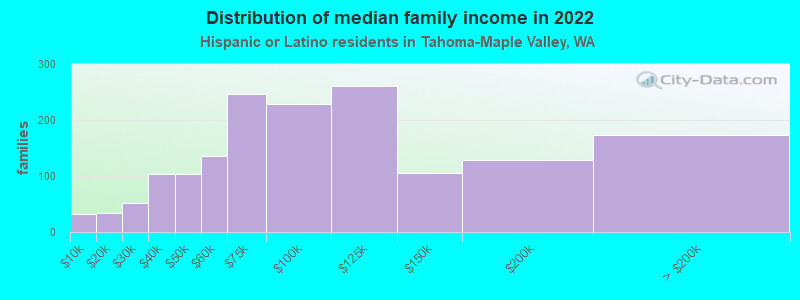
Median family income in Tahoma-Maple Valley in 2022:| Tahoma-Maple Valley: | $155,971 |
| Washington: | $76,866 |
Number of families with income < $10k:| Tahoma-Maple Valley: | 2.0% (32) |
| State: | 4.4% (9,443) |
Number of families with income $10k - 20k:| Tahoma-Maple Valley: | 2.1% (34) |
| Washington: | 3.5% (7,524) |
Number of families with income $20k - 30k:| Tahoma-Maple Valley: | 3.3% (52) |
| State: | 5.6% (12,052) |
Number of families with income $30k - 40k:| Tahoma-Maple Valley: | 6.5% (104) |
| State: | 8.3% (17,803) |
Number of families with income $40k - 50k:| Tahoma-Maple Valley: | 6.4% (103) |
| Washington: | 7.7% (16,361) |
Number of families with income $50k - 60k:| Tahoma-Maple Valley: | 8.5% (136) |
| State: | 7.9% (16,852) |
Number of families with income $60k - 75k:| Tahoma-Maple Valley: | 15.4% (247) |
| State: | 11.4% (24,342) |
Number of families with income $75k - 100k:| Tahoma-Maple Valley: | 14.2% (228) |
| State: | 14.4% (30,698) |
Number of families with income $100k - 125k:| Tahoma-Maple Valley: | 16.2% (260) |
| State: | 11.4% (24,331) |
Number of families with income $125k - 150k:| Tahoma-Maple Valley: | 6.6% (106) |
| Washington: | 7.5% (16,099) |
Number of families with income $150k - 200k:| Tahoma-Maple Valley: | 8.0% (129) |
| Washington: | 8.2% (17,551) |
Number of families with income > $200k:| Tahoma-Maple Valley: | 10.9% (174) |
| State: | 9.7% (20,653) |
Median non-family income in Tahoma-Maple Valley in 2022:| Tahoma-Maple Valley: | $64,233 |
| State: | $54,173 |
Change in median non-family income between 2000 and 2022:| Tahoma-Maple Valley, Washington: | +115.4% |
| Washington: | +105.8% |
Median per capita income in Tahoma-Maple Valley in 2022:| Tahoma-Maple Valley: | $44,407 |
| State: | $28,252 |
Change in median per capita income between 2000 and 2022:| Tahoma-Maple Valley, Washington: | +141.5% |
| State: | +150.2% |
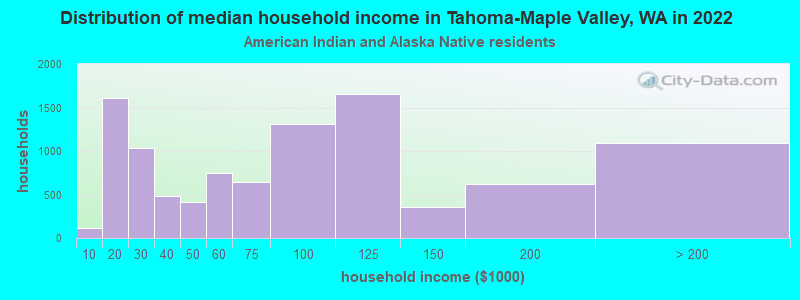
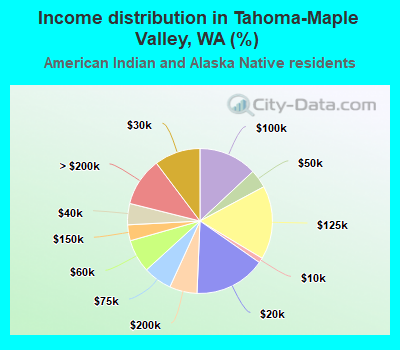
Income statistics for American Indian and Alaska Native residents
Median household income in Tahoma-Maple Valley, WA in 2022:| Tahoma-Maple Valley: | $156,276 |
| State: | $71,255 |
Change in median household income between 2000 and 2022:| Tahoma-Maple Valley, Washington: | +120.6% |
| State: | +118.1% |
Number of households with income < $10k:| Tahoma-Maple Valley: | 1.1% (113) |
| Washington: | 5.9% (1,768) |
Number of households with income $10k - 20k:| Tahoma-Maple Valley: | 15.9% (1,607) |
| State: | 8.9% (2,694) |
Number of households with income $20k - 30k:| Tahoma-Maple Valley: | 10.3% (1,036) |
| State: | 8.0% (2,412) |
Number of households with income $30k - 40k:| Tahoma-Maple Valley: | 4.7% (478) |
| Washington: | 7.7% (2,327) |
Number of households with income $40k - 50k:| Tahoma-Maple Valley: | 4.1% (417) |
| State: | 5.8% (1,755) |
Number of households with income $50k - 60k:| Tahoma-Maple Valley: | 7.4% (744) |
| State: | 7.5% (2,259) |
Number of households with income $60k - 75k:| Tahoma-Maple Valley: | 6.4% (645) |
| State: | 8.8% (2,669) |
Number of households with income $75k - 100k:| Tahoma-Maple Valley: | 13.0% (1,314) |
| State: | 12.8% (3,861) |
Number of households with income $100k - 125k:| Tahoma-Maple Valley: | 16.4% (1,657) |
| Washington: | 12.0% (3,618) |
Number of households with income $125k - 150k:| Tahoma-Maple Valley: | 3.5% (357) |
| Washington: | 8.6% (2,580) |
Number of households with income $150k - 200k:| Tahoma-Maple Valley: | 6.2% (621) |
| State: | 5.9% (1,774) |
Number of households with income > $200k:| Tahoma-Maple Valley: | 10.8% (1,091) |
| Washington: | 8.1% (2,447) |
Aggregate household income in Tahoma-Maple Valley in 2022: $10,192,496
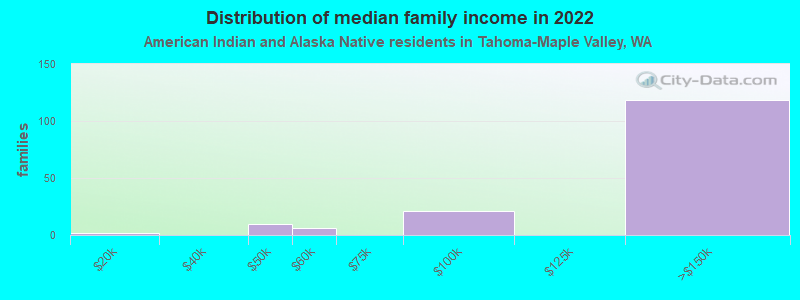
Median family income in Tahoma-Maple Valley in 2022:| Tahoma-Maple Valley: | $115,604 |
| State: | $79,010 |
Number of families with income $10k - 20k:| Tahoma-Maple Valley: | 1.5% (2) |
| State: | 5.2% (1,056) |
Number of families with income $40k - 50k:| Tahoma-Maple Valley: | 6.6% (10) |
| State: | 4.6% (927) |
Number of families with income $50k - 60k:| Tahoma-Maple Valley: | 3.7% (6) |
| State: | 9.7% (1,973) |
Number of families with income $75k - 100k:| Tahoma-Maple Valley: | 13.5% (21) |
| State: | 13.1% (2,669) |
Number of families with income $125k - 150k:| Tahoma-Maple Valley: | 74.7% (118) |
| State: | 9.8% (2,000) |
Median non-family income in Tahoma-Maple Valley in 2022:| Tahoma-Maple Valley: | $70,937 |
| Washington: | $35,591 |
Median per capita income in Tahoma-Maple Valley in 2022:| Tahoma-Maple Valley: | $47,845 |
| Washington: | $27,053 |
Change in median per capita income between 2000 and 2022:| Tahoma-Maple Valley, Washington: | +68.7% |
| Washington: | +98.6% |
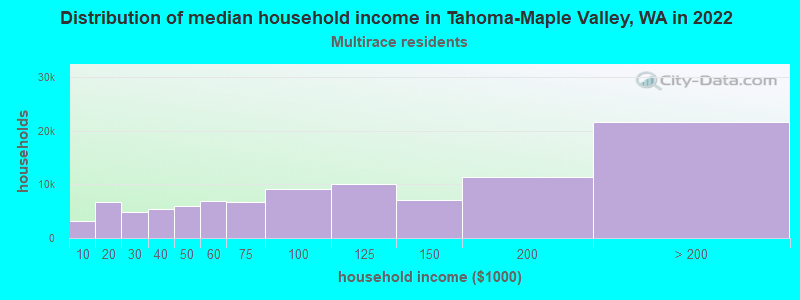
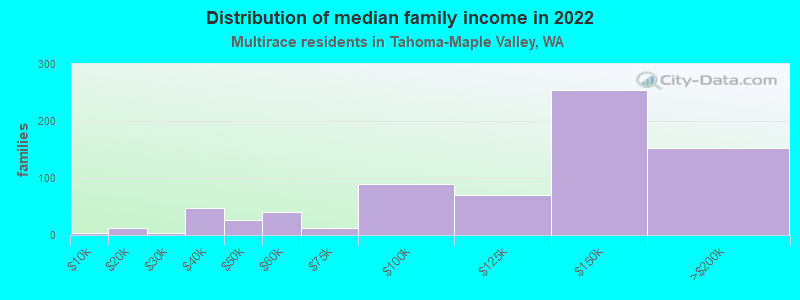
Income statistics for Multirace residents
Median household income in Tahoma-Maple Valley, WA in 2022:| Tahoma-Maple Valley: | $128,458 |
| Washington: | $84,303 |
Change in median household income between 2000 and 2022:| Tahoma-Maple Valley, Washington: | +146.6% |
| Washington: | +125.7% |
Number of households with income < $10k:| Tahoma-Maple Valley: | 3.3% (3,254) |
| Washington: | 4.3% (12,040) |
Number of households with income $10k - 20k:| Tahoma-Maple Valley: | 6.7% (6,685) |
| Washington: | 6.6% (18,437) |
Number of households with income $20k - 30k:| Tahoma-Maple Valley: | 4.9% (4,838) |
| Washington: | 5.2% (14,559) |
Number of households with income $30k - 40k:| Tahoma-Maple Valley: | 5.5% (5,502) |
| State: | 6.7% (18,491) |
Number of households with income $40k - 50k:| Tahoma-Maple Valley: | 6.1% (6,033) |
| State: | 6.3% (17,459) |
Number of households with income $50k - 60k:| Tahoma-Maple Valley: | 7.0% (6,941) |
| State: | 6.9% (19,086) |
Number of households with income $60k - 75k:| Tahoma-Maple Valley: | 6.8% (6,771) |
| Washington: | 9.1% (25,310) |
Number of households with income $75k - 100k:| Tahoma-Maple Valley: | 9.1% (9,067) |
| State: | 13.5% (37,493) |
Number of households with income $100k - 125k:| Tahoma-Maple Valley: | 10.1% (10,060) |
| State: | 10.7% (29,626) |
Number of households with income $125k - 150k:| Tahoma-Maple Valley: | 7.2% (7,123) |
| State: | 8.6% (23,899) |
Number of households with income $150k - 200k:| Tahoma-Maple Valley: | 11.5% (11,466) |
| State: | 10.2% (28,214) |
Number of households with income > $200k:| Tahoma-Maple Valley: | 21.8% (21,671) |
| State: | 11.9% (32,947) |
Aggregate household income in Tahoma-Maple Valley in 2022: $162,383,380
Median family income in Tahoma-Maple Valley in 2022:| Tahoma-Maple Valley: | $165,049 |
| Washington: | $95,629 |
Number of families with income < $10k:| Tahoma-Maple Valley: | 0.6% (4) |
| State: | 3.5% (6,121) |
Number of families with income $10k - 20k:| Tahoma-Maple Valley: | 1.8% (13) |
| Washington: | 4.3% (7,519) |
Number of families with income $20k - 30k:| Tahoma-Maple Valley: | 0.4% (3) |
| State: | 4.4% (7,775) |
Number of families with income $30k - 40k:| Tahoma-Maple Valley: | 6.7% (47) |
| State: | 5.8% (10,186) |
Number of families with income $40k - 50k:| Tahoma-Maple Valley: | 3.7% (27) |
| State: | 5.9% (10,412) |
Number of families with income $50k - 60k:| Tahoma-Maple Valley: | 5.7% (41) |
| Washington: | 5.6% (9,922) |
Number of families with income $60k - 75k:| Tahoma-Maple Valley: | 1.8% (13) |
| State: | 9.7% (17,113) |
Number of families with income $75k - 100k:| Tahoma-Maple Valley: | 12.6% (90) |
| State: | 13.6% (23,984) |
Number of families with income $100k - 125k:| Tahoma-Maple Valley: | 9.9% (71) |
| State: | 10.4% (18,288) |
Number of families with income $125k - 150k:| Tahoma-Maple Valley: | 35.6% (254) |
| Washington: | 10.5% (18,481) |
Number of families with income $150k - 200k:| Tahoma-Maple Valley: | 21.3% (152) |
| State: | 11.9% (20,852) |
Median non-family income in Tahoma-Maple Valley in 2022:| Tahoma-Maple Valley: | $5,150 |
| State: | $56,573 |
Change in median non-family income between 2000 and 2022:| Tahoma-Maple Valley, Washington: | +106.1% |
| Washington: | +115.0% |
Median per capita income in Tahoma-Maple Valley in 2022:| Tahoma-Maple Valley: | $36,410 |
| State: | $32,496 |
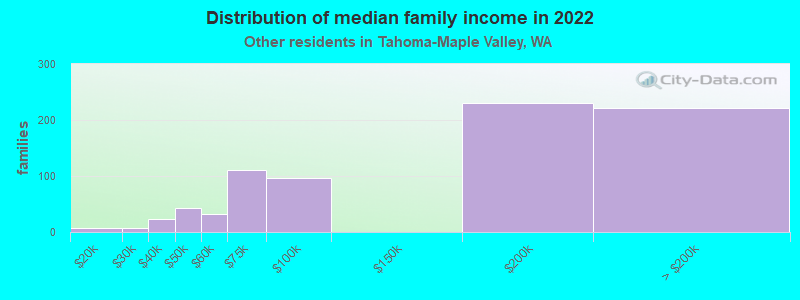
Income statistics for other residents
Number of households with income < $10k:| Tahoma-Maple Valley: | 7.1% (53) |
| State: | 5.3% (6,540) |
Number of households with income $10k - 20k:| Tahoma-Maple Valley: | 4.4% (33) |
| State: | 6.0% (7,385) |
Number of households with income $20k - 30k:| Tahoma-Maple Valley: | 3.0% (22) |
| State: | 7.5% (9,289) |
Number of households with income $30k - 40k:| Tahoma-Maple Valley: | 6.2% (46) |
| Washington: | 8.9% (11,015) |
Number of households with income $40k - 50k:| Tahoma-Maple Valley: | 6.3% (47) |
| State: | 7.6% (9,399) |
Number of households with income $50k - 60k:| Tahoma-Maple Valley: | 4.2% (31) |
| Washington: | 7.2% (8,867) |
Number of households with income $60k - 75k:| Tahoma-Maple Valley: | 13.2% (98) |
| State: | 10.5% (13,032) |
Number of households with income $75k - 100k:| Tahoma-Maple Valley: | 13.7% (102) |
| State: | 14.6% (18,007) |
Number of households with income $100k - 125k:| Tahoma-Maple Valley: | 14.5% (108) |
| Washington: | 12.2% (15,128) |
Number of households with income $125k - 150k:| Tahoma-Maple Valley: | 5.6% (42) |
| Washington: | 5.6% (6,950) |
Number of households with income $150k - 200k:| Tahoma-Maple Valley: | 11.0% (82) |
| State: | 7.1% (8,749) |
Number of households with income > $200k:| Tahoma-Maple Valley: | 10.9% (81) |
| Washington: | 7.5% (9,208) |
Aggregate household income in Tahoma-Maple Valley in 2022: $77,591,224
Median family income in Tahoma-Maple Valley in 2022:| Tahoma-Maple Valley: | $99,930 |
| State: | $72,588 |
Number of families with income $10k - 20k:| Tahoma-Maple Valley: | 1.0% (8) |
| State: | 4.0% (3,814) |
Number of families with income $20k - 30k:| Tahoma-Maple Valley: | 0.9% (7) |
| State: | 6.6% (6,293) |
Number of families with income $30k - 40k:| Tahoma-Maple Valley: | 3.1% (24) |
| State: | 9.2% (8,827) |
Number of families with income $40k - 50k:| Tahoma-Maple Valley: | 5.4% (42) |
| State: | 8.0% (7,634) |
Number of families with income $50k - 60k:| Tahoma-Maple Valley: | 4.1% (32) |
| State: | 7.7% (7,357) |
Number of families with income $60k - 75k:| Tahoma-Maple Valley: | 14.5% (111) |
| State: | 10.3% (9,864) |
Number of families with income $75k - 100k:| Tahoma-Maple Valley: | 12.4% (96) |
| State: | 14.5% (13,800) |
Number of families with income $150k - 200k:| Tahoma-Maple Valley: | 29.8% (230) |
| Washington: | 8.2% (7,822) |
Number of families with income > $200k:| Tahoma-Maple Valley: | 28.9% (222) |
| State: | 7.1% (6,764) |
Median non-family income in Tahoma-Maple Valley in 2022:| Tahoma-Maple Valley: | $74,067 |
| Washington: | $44,777 |
Change in median non-family income between 2000 and 2022:| Tahoma-Maple Valley, Washington: | +120.5% |
| State: | +84.2% |
Median per capita income in Tahoma-Maple Valley in 2022:| Tahoma-Maple Valley: | $39,560 |
| Washington: | $27,542 |
Change in median per capita income between 2000 and 2022:| Tahoma-Maple Valley, Washington: | +128.7% |
| Washington: | +167.8% |