The median household income in Terryville, CT in 2022 was $68,070, which was 29.9% less than the median annual income of $88,429 across the entire state of Connecticut. Compared to the median income of $48,284 in 2000 this represents an increase of 29.1%. The per capita income in 2022 was $37,934, which means an increase of 41.5% compared to 2000 when it was $22,202.
Whole page based on the data from 2000 / 2022 when the population of Terryville, Connecticut was 5,360 / 5,019
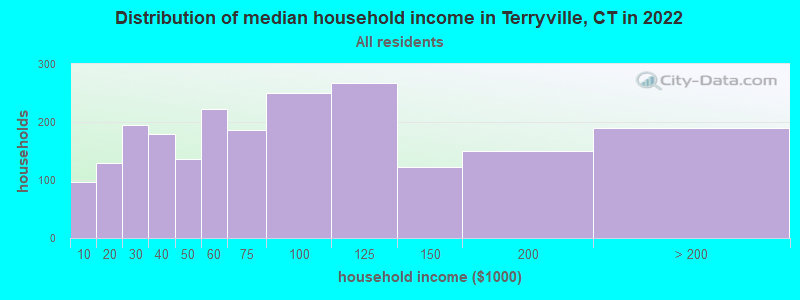
Income statistics for all residents
Median household income in Terryville, CT in 2022:
Terryville:
$68,071
Connecticut:
$88,429
Change in median household income between 2000 and 2022:
Terryville, Connecticut:
+41.0%
State:
+64.0%
Number of households with income < $10k:
Terryville:
4.6% (97)
Connecticut:
5.1% (72,746)
Number of households with income $10k - 20k:
Terryville:
6.1% (130)
State:
5.7% (81,643)
Number of households with income $20k - 30k:
Terryville:
9.1% (194)
Connecticut:
6.5% (92,844)
Number of households with income $30k - 40k:
Terryville:
8.5% (180)
State:
5.9% (83,934)
Number of households with income $40k - 50k:
Terryville:
6.4% (136)
State:
5.8% (83,025)
Number of households with income $50k - 60k:
Terryville:
10.4% (222)
Connecticut:
5.7% (81,788)
Number of households with income $60k - 75k:
Terryville:
8.8% (187)
State:
8.1% (115,651)
Number of households with income $75k - 100k:
Terryville:
11.8% (250)
State:
12.6% (180,173)
Number of households with income $100k - 125k:
Terryville:
12.6% (268)
State:
9.9% (141,231)
Number of households with income $125k - 150k:
Terryville:
5.7% (122)
Connecticut:
7.9% (112,826)
Number of households with income $150k - 200k:
Terryville:
7.1% (150)
Connecticut:
10.8% (154,641)
Number of households with income > $200k:
Terryville:
8.9% (189)
State:
16.3% (233,133)
Aggregate household income in Terryville in 2022: $189,336,174
Median family income in Terryville in 2022:
Terryville:
$83,076
State:
$115,183
Number of families with income $10k - 20k:
Terryville:
5.4% (71)
State:
2.8% (25,184)
Number of families with income $20k - 30k:
Terryville:
6.5% (86)
State:
4.1% (36,835)
Number of families with income $30k - 40k:
Terryville:
4.3% (56)
Connecticut:
4.2% (38,052)
Number of families with income $40k - 50k:
Terryville:
8.6% (113)
State:
4.8% (43,104)
Number of families with income $50k - 60k:
Terryville:
9.9% (131)
State:
4.8% (43,284)
Number of families with income $60k - 75k:
Terryville:
8.7% (114)
State:
7.4% (66,521)
Number of families with income $75k - 100k:
Terryville:
13.4% (177)
State:
12.9% (116,232)
Number of families with income $100k - 125k:
Terryville:
14.9% (196)
State:
10.6% (95,504)
Number of families with income $125k - 150k:
Terryville:
8.8% (117)
Connecticut:
9.5% (86,149)
Number of families with income $150k - 200k:
Terryville:
7.9% (104)
State:
14.0% (125,908)
Number of families with income > $200k:
Terryville:
11.7% (155)
State:
22.4% (202,515)
Median non-family income in Terryville in 2022:
Terryville:
$44,629
State:
$50,964
Change in median non-family income between 2000 and 2022:
Terryville, Connecticut:
+57.0%
Connecticut:
+65.1%
Median per capita income in Terryville in 2022:
Terryville:
$37,935
State:
$51,581
Change in median per capita income between 2000 and 2022:
Terryville, Connecticut:
+70.9%
Connecticut:
+79.3%
Income statistics for White residents
Median household income in Terryville, CT in 2022:
Terryville:
$65,929
State:
$96,890
Change in median household income between 2000 and 2022:
Terryville, Connecticut:
+35.7%
State:
+68.5%
Number of households with income < $10k:
Terryville:
4.9% (95)
State:
4.2% (42,265)
Number of households with income $10k - 20k:
Terryville:
6.6% (129)
Connecticut:
4.8% (48,323)
Number of households with income $20k - 30k:
Terryville:
9.2% (178)
State:
5.7% (57,716)
Number of households with income $30k - 40k:
Terryville:
8.7% (169)
State:
5.3% (53,827)
Number of households with income $40k - 50k:
Terryville:
6.5% (127)
Connecticut:
5.3% (53,301)
Number of households with income $50k - 60k:
Terryville:
11.1% (215)
State:
5.5% (55,690)
Number of households with income $60k - 75k:
Terryville:
9.2% (178)
State:
8.0% (80,329)
Number of households with income $75k - 100k:
Terryville:
9.9% (193)
Connecticut:
12.7% (128,070)
Number of households with income $100k - 125k:
Terryville:
11.4% (221)
Connecticut:
10.0% (101,210)
Number of households with income $125k - 150k:
Terryville:
5.7% (111)
State:
8.0% (81,250)
Number of households with income $150k - 200k:
Terryville:
7.4% (144)
State:
11.8% (119,527)
Number of households with income > $200k:
Terryville:
9.3% (181)
State:
18.6% (187,875)
Aggregate household income in Terryville in 2022: $172,299,804
Median family income in Terryville in 2022:
Terryville:
$80,959
State:
$128,955
Number of families with income $10k - 20k:
Terryville:
5.0% (57)
State:
1.8% (11,289)
Number of families with income $20k - 30k:
Terryville:
6.7% (77)
Connecticut:
3.0% (18,506)
Number of families with income $30k - 40k:
Terryville:
4.0% (46)
Connecticut:
2.9% (18,160)
Number of families with income $40k - 50k:
Terryville:
9.3% (107)
State:
3.9% (24,550)
Number of families with income $50k - 60k:
Terryville:
10.6% (122)
Connecticut:
4.3% (26,723)
Number of families with income $60k - 75k:
Terryville:
9.6% (110)
Connecticut:
7.1% (44,075)
Number of families with income $75k - 100k:
Terryville:
10.6% (122)
State:
12.5% (77,679)
Number of families with income $100k - 125k:
Terryville:
13.7% (158)
Connecticut:
11.1% (69,086)
Number of families with income $125k - 150k:
Terryville:
9.0% (103)
State:
9.6% (59,616)
Number of families with income $150k - 200k:
Terryville:
8.8% (101)
State:
15.7% (97,890)
Number of families with income > $200k:
Terryville:
12.9% (148)
Connecticut:
26.3% (163,417)
Median non-family income in Terryville in 2022:
Terryville:
$43,547
State:
$54,067
Change in median non-family income between 2000 and 2022:
Terryville, Connecticut:
+49.5%
State:
+68.7%
Median per capita income in Terryville in 2022:
Terryville:
$39,334
Connecticut:
$59,916
Change in median per capita income between 2000 and 2022:
Terryville, Connecticut:
+75.8%
Connecticut:
+90.2%
Income statistics for Hispanic or Latino residents
Number of households with income < $10k:
Terryville:
0.0% (0)
State:
8.7% (18,584)
Number of households with income $10k - 20k:
Terryville:
0.0% (0)
Connecticut:
9.1% (19,235)
Number of households with income $20k - 30k:
Terryville:
9.5% (10)
State:
8.9% (18,989)
Number of households with income $30k - 40k:
Terryville:
0.0% (0)
State:
7.5% (15,967)
Number of households with income $40k - 50k:
Terryville:
7.6% (8)
Connecticut:
8.7% (18,466)
Number of households with income $50k - 60k:
Terryville:
30.5% (32)
Connecticut:
6.9% (14,706)
Number of households with income $60k - 75k:
Terryville:
0.0% (0)
State:
8.9% (18,888)
Number of households with income $75k - 100k:
Terryville:
0.0% (0)
State:
13.5% (28,669)
Number of households with income $100k - 125k:
Terryville:
32.4% (34)
State:
8.2% (17,434)
Number of households with income $125k - 150k:
Terryville:
0.0% (0)
Connecticut:
6.5% (13,752)
Number of households with income $150k - 200k:
Terryville:
0.0% (0)
State:
6.6% (14,114)
Number of households with income > $200k:
Terryville:
20.0% (21)
Connecticut:
6.4% (13,630)
Aggregate household income in Terryville in 2022: $11,146,610
Median family income in Terryville in 2022:
Terryville:
$113,126
State:
$68,336
Number of families with income $50k - 60k:
Terryville:
43.1% (38)
State:
8.4% (11,924)
Number of families with income $100k - 125k:
Terryville:
34.9% (31)
State:
8.2% (11,720)
Number of families with income > $200k:
Terryville:
22.0% (19)
State:
7.4% (10,622)
Median per capita income in Terryville in 2022:
Terryville:
$27,130
State:
$28,507
Change in median per capita income between 2000 and 2022:
Terryville, Connecticut:
+135.7%
State:
+117.2%
Income statistics for Multirace residents
Number of households with income < $10k:
Terryville:
0.0% (0)
Connecticut:
6.0% (7,457)
Number of households with income $10k - 20k:
Terryville:
0.0% (0)
State:
8.1% (10,139)
Number of households with income $20k - 30k:
Terryville:
0.0% (0)
State:
7.0% (8,702)
Number of households with income $30k - 40k:
Terryville:
0.0% (0)
State:
6.9% (8,546)
Number of households with income $40k - 50k:
Terryville:
0.0% (0)
State:
7.0% (8,712)
Number of households with income $50k - 60k:
Terryville:
0.0% (0)
Connecticut:
5.9% (7,331)
Number of households with income $60k - 75k:
Terryville:
0.0% (0)
State:
8.5% (10,634)
Number of households with income $75k - 100k:
Terryville:
74.2% (72)
State:
14.1% (17,600)
Number of households with income $100k - 125k:
Terryville:
25.8% (25)
Connecticut:
9.9% (12,383)
Number of households with income $125k - 150k:
Terryville:
0.0% (0)
State:
7.2% (8,921)
Number of households with income $150k - 200k:
Terryville:
0.0% (0)
State:
8.8% (10,922)
Number of households with income > $200k:
Terryville:
0.0% (0)
Connecticut:
10.6% (13,247)
Aggregate household income in Terryville in 2022: $17,644,881
Median per capita income in Terryville in 2022:
Terryville:
$30,126
State:
$32,794
Change in median per capita income between 2000 and 2022:
Terryville, Connecticut:
+119.3%
Connecticut:
+117.2%
Income statistics for other residents
Number of households with income < $10k:
Terryville:
0.0% (0)
State:
9.0% (8,596)
Number of households with income $10k - 20k:
Terryville:
0.0% (0)
Connecticut:
10.2% (9,773)
Number of households with income $20k - 30k:
Terryville:
0.0% (0)
State:
9.1% (8,691)
Number of households with income $30k - 40k:
Terryville:
0.0% (0)
Connecticut:
7.8% (7,447)
Number of households with income $40k - 50k:
Terryville:
0.0% (0)
State:
8.2% (7,860)
Number of households with income $50k - 60k:
Terryville:
0.0% (0)
State:
6.0% (5,757)
Number of households with income $60k - 75k:
Terryville:
0.0% (0)
Connecticut:
9.3% (8,942)
Number of households with income $75k - 100k:
Terryville:
0.0% (0)
State:
14.3% (13,700)
Number of households with income $100k - 125k:
Terryville:
100.0% (17)
State:
7.2% (6,906)
Number of households with income $125k - 150k:
Terryville:
0.0% (0)
Connecticut:
6.5% (6,215)
Number of households with income $150k - 200k:
Terryville:
0.0% (0)
Connecticut:
6.1% (5,865)
Number of households with income > $200k:
Terryville:
0.0% (0)
State:
6.3% (6,065)
Aggregate household income in Terryville in 2022: $4,927,007
Median per capita income in Terryville in 2022:
Terryville:
$25,539
State:
$29,353
Change in median per capita income between 2000 and 2022:: -23.9%
Terryville, Connecticut:
-23.9%
Connecticut:
+165.8%
Discuss Terryville, Connecticut (CT) on our hugely popular Connecticut forum.