Thompson, New York (NY) income map, earnings map, and wages data
The median household income in Thompson, NY in 2022 was $61,213, which was 30.0% less than the median annual income of $79,557 across the entire state of New York. Compared to the median income of $35,511 in 2000 this represents an increase of 42.0%. The per capita income in 2022 was $42,955, which means an increase of 56.5% compared to 2000 when it was $18,668.
Income statistics for all residents
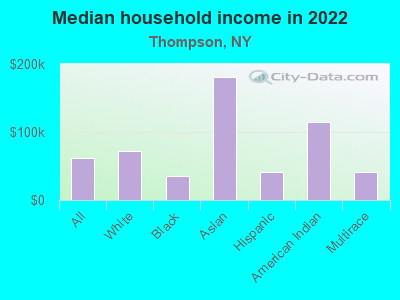
Median household income in Thompson, NY in 2022:| Thompson: | $61,214 |
| State: | $79,557 |
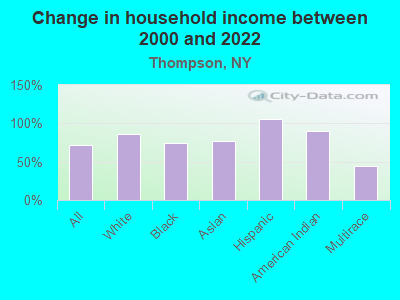
Change in median household income between 2000 and 2022:| Thompson, New York: | +72.4% |
| State: | +83.3% |
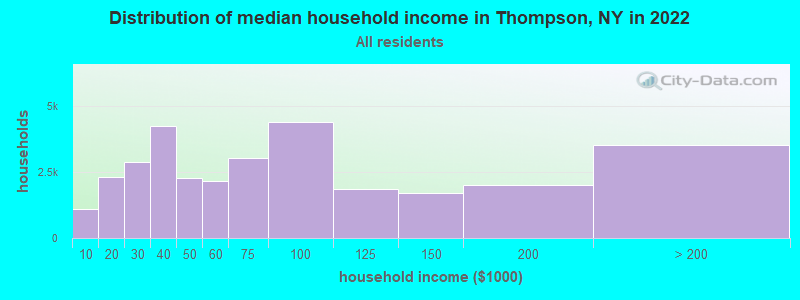
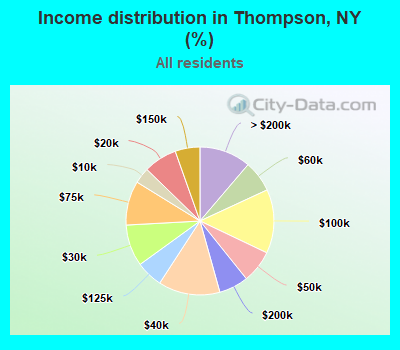
Number of households with income < $10k:| Thompson: | 3.5% (1,093) |
| State: | 6.8% (527,598) |
Number of households with income $10k - 20k:| Thompson: | 7.3% (2,296) |
| New York: | 7.4% (574,940) |
Number of households with income $20k - 30k:| Thompson: | 9.1% (2,865) |
| New York: | 6.7% (517,718) |
Number of households with income $30k - 40k:| Thompson: | 13.5% (4,243) |
| New York: | 6.5% (506,674) |
Number of households with income $40k - 50k:| Thompson: | 7.2% (2,253) |
| State: | 6.1% (470,439) |
Number of households with income $50k - 60k:| Thompson: | 6.9% (2,155) |
| New York: | 5.8% (454,042) |
Number of households with income $60k - 75k:| Thompson: | 9.7% (3,042) |
| State: | 8.5% (657,508) |
Number of households with income $75k - 100k:| Thompson: | 14.0% (4,391) |
| State: | 11.6% (899,824) |
Number of households with income $100k - 125k:| Thompson: | 5.9% (1,842) |
| State: | 9.3% (723,825) |
Number of households with income $125k - 150k:| Thompson: | 5.4% (1,702) |
| State: | 7.1% (552,420) |
Number of households with income $150k - 200k:| Thompson: | 6.4% (2,021) |
| State: | 9.4% (727,051) |
Number of households with income > $200k:| Thompson: | 11.3% (3,539) |
| New York: | 15.0% (1,162,269) |
Aggregate household income in Thompson in 2022: $652,627,790
Median family income in Thompson in 2022:| Thompson: | $81,737 |
| State: | $99,066 |
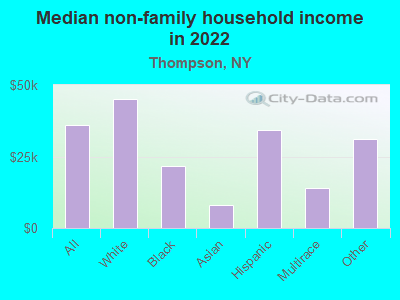
Median non-family income in Thompson in 2022:| Thompson: | $35,881 |
| State: | $50,181 |
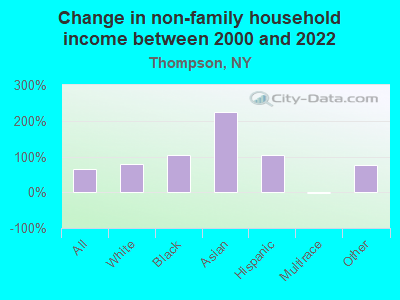
Change in median non-family income between 2000 and 2022:| Thompson, New York: | +66.4% |
| State: | +85.4% |
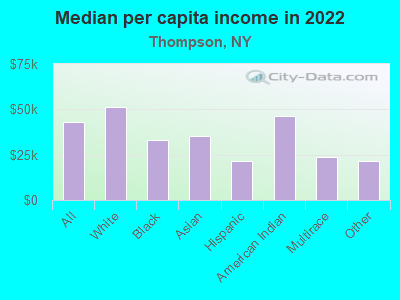
Median per capita income in Thompson in 2022:| Thompson: | $42,956 |
| State: | $47,421 |
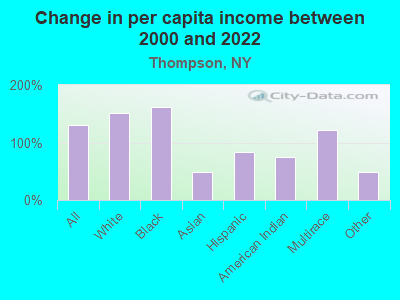
Change in median per capita income between 2000 and 2022:| Thompson, New York: | +130.1% |
| New York: | +102.7% |
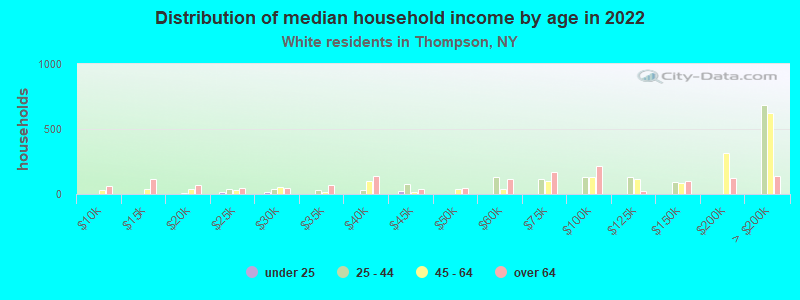
Income statistics for White residents
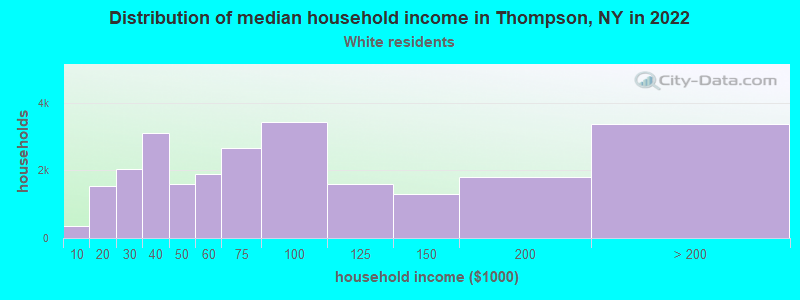
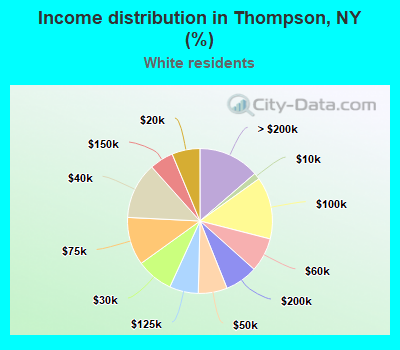
Median household income in Thompson, NY in 2022:| Thompson: | $71,745 |
| State: | $89,408 |
Change in median household income between 2000 and 2022:| Thompson, New York: | +86.1% |
| State: | +85.5% |
Number of households with income < $10k:| Thompson: | 1.5% (360) |
| New York: | 4.8% (225,550) |
Number of households with income $10k - 20k:| Thompson: | 6.3% (1,549) |
| State: | 6.1% (289,425) |
Number of households with income $20k - 30k:| Thompson: | 8.2% (2,038) |
| State: | 5.9% (280,254) |
Number of households with income $30k - 40k:| Thompson: | 12.6% (3,118) |
| New York: | 6.1% (288,263) |
Number of households with income $40k - 50k:| Thompson: | 6.5% (1,595) |
| New York: | 5.9% (278,079) |
Number of households with income $50k - 60k:| Thompson: | 7.6% (1,884) |
| State: | 5.7% (267,554) |
Number of households with income $60k - 75k:| Thompson: | 10.7% (2,653) |
| State: | 8.4% (398,344) |
Number of households with income $75k - 100k:| Thompson: | 13.9% (3,431) |
| New York: | 11.8% (554,841) |
Number of households with income $100k - 125k:| Thompson: | 6.4% (1,593) |
| New York: | 10.0% (469,794) |
Number of households with income $125k - 150k:| Thompson: | 5.3% (1,315) |
| State: | 7.6% (360,467) |
Number of households with income $150k - 200k:| Thompson: | 7.3% (1,808) |
| New York: | 10.1% (477,078) |
Number of households with income > $200k:| Thompson: | 13.7% (3,377) |
| State: | 17.6% (829,233) |
Aggregate household income in Thompson in 2022: $492,213,061
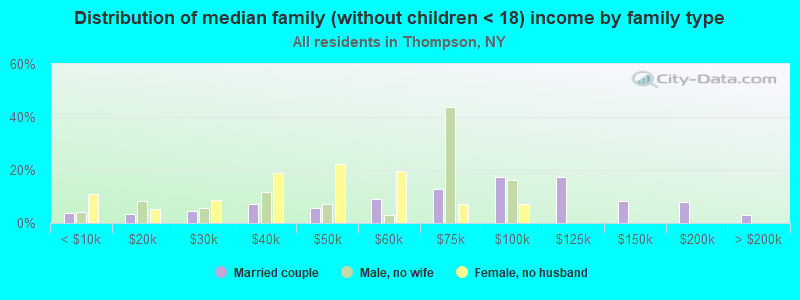
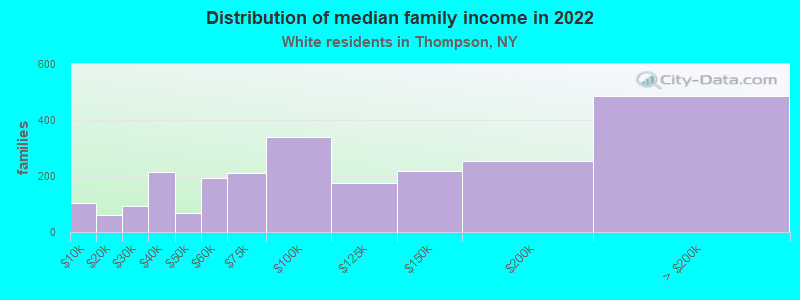
Median family income in Thompson in 2022:| Thompson: | $92,457 |
| New York: | $115,170 |
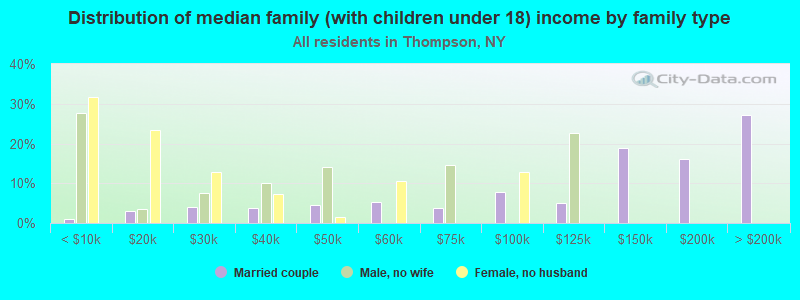
Number of families with income < $10k:| Thompson: | 4.3% (103) |
| New York: | 2.5% (68,851) |
Number of families with income $10k - 20k:| Thompson: | 2.4% (59) |
| State: | 3.0% (83,127) |
Number of families with income $20k - 30k:| Thompson: | 3.9% (93) |
| New York: | 3.5% (97,578) |
Number of families with income $30k - 40k:| Thompson: | 8.9% (213) |
| State: | 4.1% (114,108) |
Number of families with income $40k - 50k:| Thompson: | 2.8% (68) |
| New York: | 4.7% (130,902) |
Number of families with income $50k - 60k:| Thompson: | 8.0% (194) |
| New York: | 4.9% (135,118) |
Number of families with income $60k - 75k:| Thompson: | 8.7% (209) |
| State: | 7.8% (216,254) |
Number of families with income $75k - 100k:| Thompson: | 14.0% (338) |
| State: | 12.4% (342,382) |
Number of families with income $100k - 125k:| Thompson: | 7.3% (175) |
| State: | 11.4% (314,917) |
Number of families with income $125k - 150k:| Thompson: | 9.1% (219) |
| State: | 9.4% (260,489) |
Number of families with income $150k - 200k:| Thompson: | 10.5% (252) |
| State: | 13.2% (365,586) |
Number of families with income > $200k:| Thompson: | 20.2% (486) |
| State: | 23.2% (642,319) |
Median non-family income in Thompson in 2022:| Thompson: | $45,041 |
| State: | $54,783 |
Change in median non-family income between 2000 and 2022:| Thompson, New York: | +78.4% |
| State: | +87.9% |
Median per capita income in Thompson in 2022:| Thompson: | $51,487 |
| State: | $57,640 |
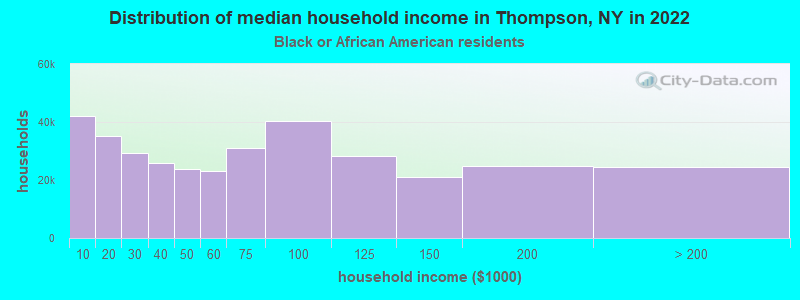
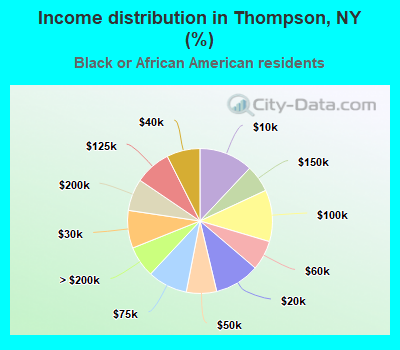
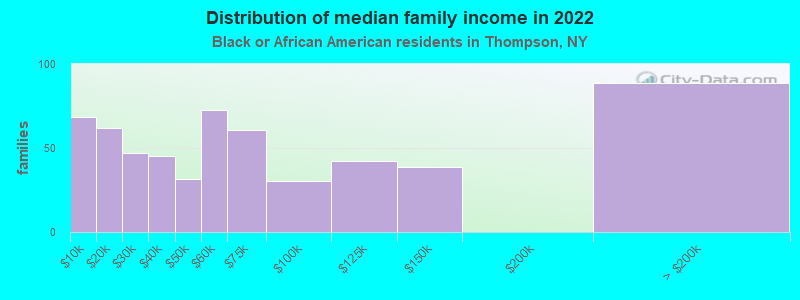
Income statistics for Black or African American residents
Median household income in Thompson, NY in 2022:| Thompson: | $35,575 |
| State: | $57,898 |
Change in median household income between 2000 and 2022:| Thompson, New York: | +73.6% |
| State: | +84.6% |
Number of households with income < $10k:| Thompson: | 12.0% (42,016) |
| State: | 12.0% (128,500) |
Number of households with income $10k - 20k:| Thompson: | 10.0% (35,128) |
| New York: | 10.0% (107,541) |
Number of households with income $20k - 30k:| Thompson: | 8.4% (29,481) |
| State: | 8.4% (90,192) |
Number of households with income $30k - 40k:| Thompson: | 7.4% (25,984) |
| New York: | 7.4% (79,579) |
Number of households with income $40k - 50k:| Thompson: | 6.8% (23,692) |
| State: | 6.8% (72,491) |
Number of households with income $50k - 60k:| Thompson: | 6.6% (23,237) |
| State: | 6.7% (71,309) |
Number of households with income $60k - 75k:| Thompson: | 8.9% (31,065) |
| New York: | 8.9% (95,050) |
Number of households with income $75k - 100k:| Thompson: | 11.5% (40,306) |
| New York: | 11.5% (123,569) |
Number of households with income $100k - 125k:| Thompson: | 8.1% (28,217) |
| State: | 8.1% (86,632) |
Number of households with income $125k - 150k:| Thompson: | 6.1% (21,170) |
| State: | 6.0% (64,788) |
Number of households with income $150k - 200k:| Thompson: | 7.1% (24,980) |
| New York: | 7.2% (76,644) |
Number of households with income > $200k:| Thompson: | 7.0% (24,394) |
| State: | 7.0% (75,062) |
Aggregate household income in Thompson in 2022: $44,570,975
Median family income in Thompson in 2022:| Thompson: | $53,253 |
| State: | $72,528 |
Number of families with income < $10k:| Thompson: | 11.6% (68) |
| New York: | 8.6% (54,100) |
Number of families with income $10k - 20k:| Thompson: | 10.5% (62) |
| New York: | 6.6% (41,506) |
Number of families with income $20k - 30k:| Thompson: | 8.0% (47) |
| State: | 7.0% (44,139) |
Number of families with income $30k - 40k:| Thompson: | 7.7% (45) |
| New York: | 6.9% (43,353) |
Number of families with income $40k - 50k:| Thompson: | 5.4% (31) |
| New York: | 6.6% (41,419) |
Number of families with income $50k - 60k:| Thompson: | 12.3% (72) |
| New York: | 6.3% (39,748) |
Number of families with income $60k - 75k:| Thompson: | 10.3% (61) |
| State: | 9.2% (57,626) |
Number of families with income $75k - 100k:| Thompson: | 5.2% (30) |
| State: | 12.6% (78,986) |
Number of families with income $100k - 125k:| Thompson: | 7.2% (42) |
| New York: | 9.8% (61,670) |
Number of families with income $125k - 150k:| Thompson: | 6.6% (39) |
| State: | 7.5% (47,050) |
Number of families with income > $200k:| Thompson: | 15.1% (89) |
| New York: | 9.3% (58,575) |
Median non-family income in Thompson in 2022:| Thompson: | $21,789 |
| State: | $37,265 |
Change in median non-family income between 2000 and 2022:| Thompson, New York: | +104.6% |
| State: | +81.7% |
Median per capita income in Thompson in 2022:| Thompson: | $32,893 |
| New York: | $31,947 |
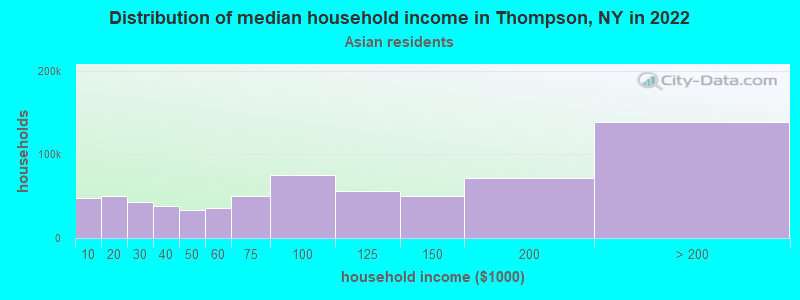
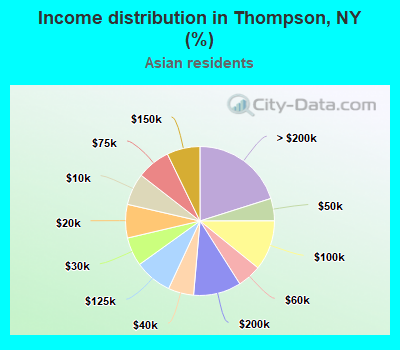
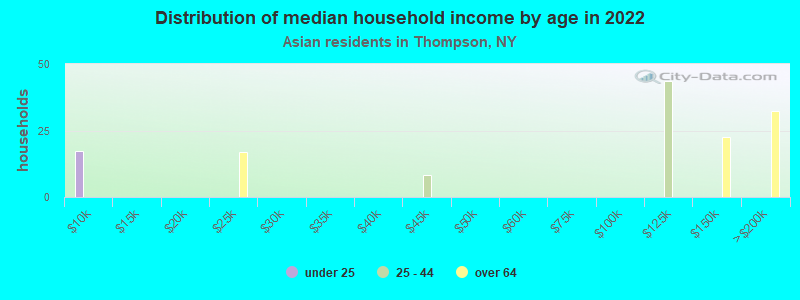
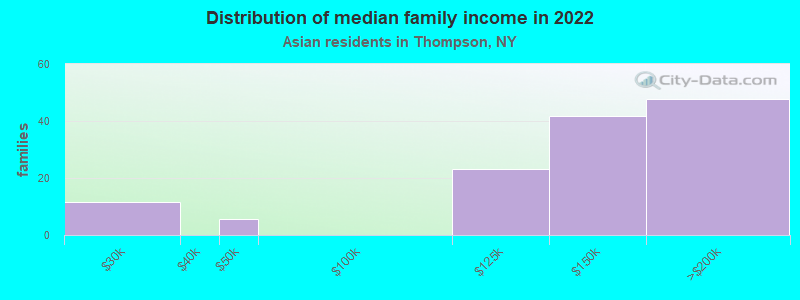
Income statistics for Asian residents
Median household income in Thompson, NY in 2022:| Thompson: | $180,687 |
| New York: | $89,947 |
Change in median household income between 2000 and 2022:| Thompson, New York: | +77.3% |
| State: | +98.1% |
Number of households with income < $10k:| Thompson: | 6.9% (47,738) |
| State: | 6.9% (42,537) |
Number of households with income $10k - 20k:| Thompson: | 7.3% (50,229) |
| State: | 7.3% (44,745) |
Number of households with income $20k - 30k:| Thompson: | 6.2% (43,009) |
| State: | 6.2% (38,249) |
Number of households with income $30k - 40k:| Thompson: | 5.5% (38,153) |
| State: | 5.5% (33,993) |
Number of households with income $40k - 50k:| Thompson: | 4.9% (33,488) |
| State: | 4.8% (29,795) |
Number of households with income $50k - 60k:| Thompson: | 5.2% (35,817) |
| New York: | 5.2% (32,100) |
Number of households with income $60k - 75k:| Thompson: | 7.3% (50,045) |
| State: | 7.3% (44,615) |
Number of households with income $75k - 100k:| Thompson: | 10.9% (74,830) |
| State: | 10.8% (66,687) |
Number of households with income $100k - 125k:| Thompson: | 8.2% (56,222) |
| New York: | 8.2% (50,233) |
Number of households with income $125k - 150k:| Thompson: | 7.2% (49,678) |
| State: | 7.2% (44,299) |
Number of households with income $150k - 200k:| Thompson: | 10.4% (71,474) |
| New York: | 10.4% (63,837) |
Number of households with income > $200k:| Thompson: | 20.1% (138,705) |
| State: | 20.1% (123,891) |
Aggregate household income in Thompson in 2022: $15,541,936
Median family income in Thompson in 2022:| Thompson: | $122,245 |
| State: | $98,136 |
Number of families with income $20k - 30k:| Thompson: | 9.0% (12) |
| State: | 6.4% (27,990) |
Number of families with income $40k - 50k:| Thompson: | 4.4% (6) |
| New York: | 5.2% (22,750) |
Number of families with income $100k - 125k:| Thompson: | 17.9% (23) |
| New York: | 8.6% (37,796) |
Number of families with income $125k - 150k:| Thompson: | 32.0% (42) |
| State: | 7.3% (31,893) |
Number of families with income $150k - 200k:| Thompson: | 36.7% (48) |
| New York: | 11.0% (48,177) |
Median non-family income in Thompson in 2022:| Thompson: | $8,089 |
| State: | $63,573 |
Median per capita income in Thompson in 2022:| Thompson: | $35,537 |
| New York: | $46,726 |
Change in median per capita income between 2000 and 2022:| Thompson, New York: | +47.7% |
| New York: | +126.6% |
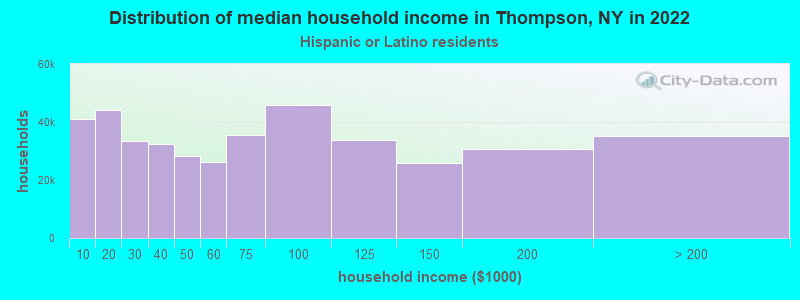
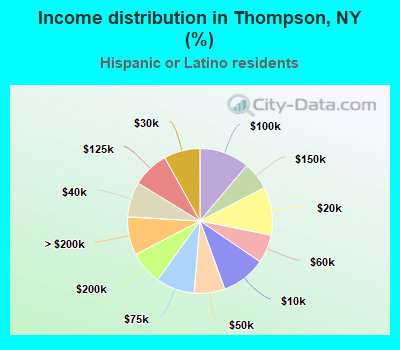
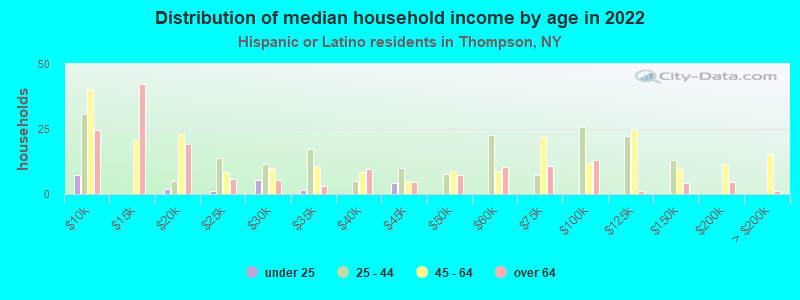
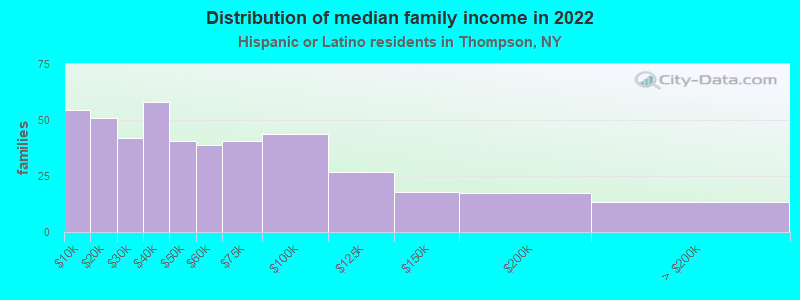
Income statistics for Hispanic or Latino residents
Median household income in Thompson, NY in 2022:| Thompson: | $40,503 |
| New York: | $60,468 |
Change in median household income between 2000 and 2022:| Thompson, New York: | +105.5% |
| State: | +98.3% |
Number of households with income < $10k:| Thompson: | 10.0% (41,068) |
| New York: | 9.9% (127,185) |
Number of households with income $10k - 20k:| Thompson: | 10.7% (44,208) |
| New York: | 10.7% (136,699) |
Number of households with income $20k - 30k:| Thompson: | 8.1% (33,289) |
| State: | 8.1% (102,991) |
Number of households with income $30k - 40k:| Thompson: | 7.8% (32,244) |
| New York: | 7.8% (100,149) |
Number of households with income $40k - 50k:| Thompson: | 6.8% (28,211) |
| State: | 6.9% (87,760) |
Number of households with income $50k - 60k:| Thompson: | 6.3% (26,124) |
| State: | 6.3% (80,968) |
Number of households with income $60k - 75k:| Thompson: | 8.6% (35,607) |
| New York: | 8.7% (110,631) |
Number of households with income $75k - 100k:| Thompson: | 11.2% (45,961) |
| New York: | 11.2% (142,787) |
Number of households with income $100k - 125k:| Thompson: | 8.2% (33,679) |
| New York: | 8.2% (104,850) |
Number of households with income $125k - 150k:| Thompson: | 6.3% (25,841) |
| State: | 6.3% (80,274) |
Number of households with income $150k - 200k:| Thompson: | 7.4% (30,548) |
| State: | 7.4% (95,117) |
Number of households with income > $200k:| Thompson: | 8.6% (35,231) |
| State: | 8.6% (109,514) |
Aggregate household income in Thompson in 2022: $119,921,547
Median family income in Thompson in 2022:| Thompson: | $53,858 |
| New York: | $68,770 |
Number of families with income < $10k:| Thompson: | 12.2% (54) |
| New York: | 6.9% (58,565) |
Number of families with income $10k - 20k:| Thompson: | 11.5% (51) |
| State: | 7.0% (59,058) |
Number of families with income $20k - 30k:| Thompson: | 9.5% (42) |
| New York: | 8.0% (68,048) |
Number of families with income $30k - 40k:| Thompson: | 13.0% (58) |
| New York: | 8.4% (70,668) |
Number of families with income $40k - 50k:| Thompson: | 9.1% (40) |
| State: | 7.4% (62,941) |
Number of families with income $50k - 60k:| Thompson: | 8.7% (39) |
| State: | 6.6% (55,592) |
Number of families with income $60k - 75k:| Thompson: | 9.1% (40) |
| New York: | 9.3% (78,564) |
Number of families with income $75k - 100k:| Thompson: | 9.9% (44) |
| State: | 12.6% (106,685) |
Number of families with income $100k - 125k:| Thompson: | 6.0% (27) |
| New York: | 9.4% (79,139) |
Number of families with income $125k - 150k:| Thompson: | 4.0% (18) |
| State: | 6.9% (58,255) |
Number of families with income $150k - 200k:| Thompson: | 3.9% (17) |
| State: | 8.3% (69,877) |
Number of families with income > $200k:| Thompson: | 3.1% (14) |
| New York: | 9.3% (78,555) |
Median non-family income in Thompson in 2022:| Thompson: | $34,168 |
| State: | $34,000 |
Change in median non-family income between 2000 and 2022:| Thompson, New York: | +103.0% |
| New York: | +93.9% |
Median per capita income in Thompson in 2022:| Thompson: | $21,442 |
| State: | $29,761 |
Change in median per capita income between 2000 and 2022:| Thompson, New York: | +84.1% |
| New York: | +132.7% |
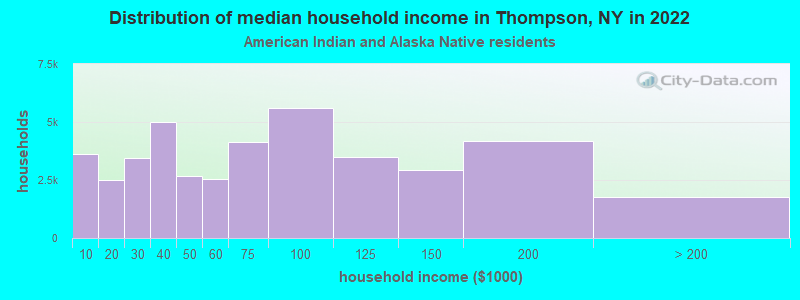
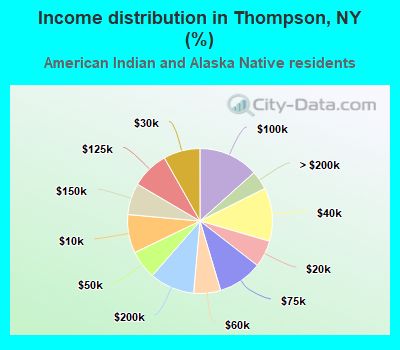
Income statistics for American Indian and Alaska Native residents
Median household income in Thompson, NY in 2022:| Thompson: | $115,205 |
| New York: | $63,208 |
Change in median household income between 2000 and 2022:| Thompson, New York: | +90.5% |
| State: | +110.1% |
Number of households with income < $10k:| Thompson: | 8.6% (3,611) |
| New York: | 8.6% (3,559) |
Number of households with income $10k - 20k:| Thompson: | 6.0% (2,507) |
| State: | 5.9% (2,455) |
Number of households with income $20k - 30k:| Thompson: | 8.2% (3,428) |
| New York: | 8.2% (3,393) |
Number of households with income $30k - 40k:| Thompson: | 11.9% (4,992) |
| State: | 11.9% (4,918) |
Number of households with income $40k - 50k:| Thompson: | 6.4% (2,681) |
| State: | 6.5% (2,682) |
Number of households with income $50k - 60k:| Thompson: | 6.0% (2,524) |
| State: | 6.1% (2,516) |
Number of households with income $60k - 75k:| Thompson: | 9.9% (4,148) |
| New York: | 10.0% (4,125) |
Number of households with income $75k - 100k:| Thompson: | 13.4% (5,610) |
| State: | 13.3% (5,517) |
Number of households with income $100k - 125k:| Thompson: | 8.4% (3,502) |
| State: | 8.4% (3,463) |
Number of households with income $125k - 150k:| Thompson: | 7.0% (2,944) |
| New York: | 7.0% (2,887) |
Number of households with income $150k - 200k:| Thompson: | 10.0% (4,196) |
| State: | 9.9% (4,106) |
Number of households with income > $200k:| Thompson: | 4.2% (1,773) |
| State: | 4.2% (1,744) |
Aggregate household income in Thompson in 2022: $2,509,503
Median per capita income in Thompson in 2022:| Thompson: | $46,319 |
| State: | $25,837 |
Change in median per capita income between 2000 and 2022:| Thompson, New York: | +75.0% |
| State: | +99.6% |
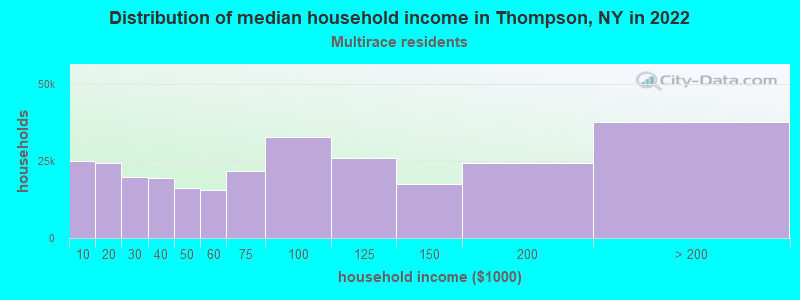
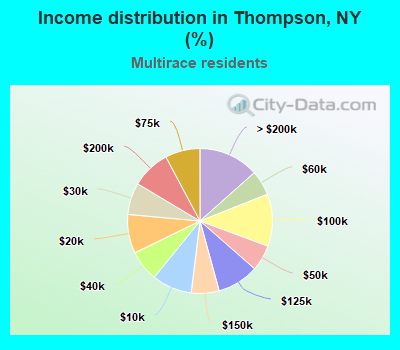
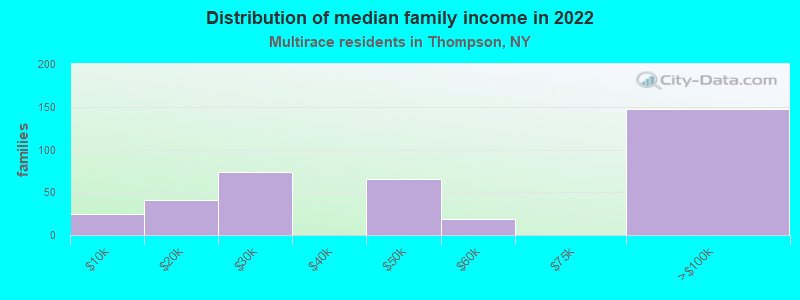
Income statistics for Multirace residents
Median household income in Thompson, NY in 2022:| Thompson: | $40,805 |
| State: | $73,557 |
Change in median household income between 2000 and 2022:| Thompson, New York: | +43.7% |
| State: | +123.9% |
Number of households with income < $10k:| Thompson: | 8.9% (25,062) |
| State: | 8.9% (57,924) |
Number of households with income $10k - 20k:| Thompson: | 8.7% (24,442) |
| State: | 8.7% (56,590) |
Number of households with income $20k - 30k:| Thompson: | 7.1% (19,979) |
| New York: | 7.1% (46,287) |
Number of households with income $30k - 40k:| Thompson: | 6.9% (19,461) |
| New York: | 6.9% (45,132) |
Number of households with income $40k - 50k:| Thompson: | 5.8% (16,331) |
| New York: | 5.8% (37,946) |
Number of households with income $50k - 60k:| Thompson: | 5.6% (15,690) |
| New York: | 5.6% (36,410) |
Number of households with income $60k - 75k:| Thompson: | 7.8% (21,886) |
| New York: | 7.8% (50,819) |
Number of households with income $75k - 100k:| Thompson: | 11.7% (32,796) |
| State: | 11.7% (76,024) |
Number of households with income $100k - 125k:| Thompson: | 9.3% (26,098) |
| State: | 9.3% (60,635) |
Number of households with income $125k - 150k:| Thompson: | 6.2% (17,487) |
| State: | 6.2% (40,533) |
Number of households with income $150k - 200k:| Thompson: | 8.6% (24,325) |
| State: | 8.6% (56,409) |
Number of households with income > $200k:| Thompson: | 13.4% (37,765) |
| New York: | 13.4% (87,442) |
Aggregate household income in Thompson in 2022: $76,244,711
Median family income in Thompson in 2022:| Thompson: | $40,297 |
| State: | $85,788 |
Number of families with income < $10k:| Thompson: | 6.4% (24) |
| New York: | 6.2% (24,976) |
Number of families with income $10k - 20k:| Thompson: | 11.1% (41) |
| New York: | 5.6% (22,512) |
Number of families with income $20k - 30k:| Thompson: | 20.0% (74) |
| New York: | 6.6% (26,534) |
Number of families with income $40k - 50k:| Thompson: | 17.8% (66) |
| State: | 6.1% (24,694) |
Number of families with income $50k - 60k:| Thompson: | 5.2% (19) |
| State: | 5.5% (22,002) |
Number of families with income $75k - 100k:| Thompson: | 39.5% (147) |
| State: | 12.9% (51,995) |
Median non-family income in Thompson in 2022:| Thompson: | $14,010 |
| State: | $46,403 |
Median per capita income in Thompson in 2022:| Thompson: | $23,971 |
| State: | $36,931 |
Change in median per capita income between 2000 and 2022:| Thompson, New York: | +120.9% |
| New York: | +158.8% |
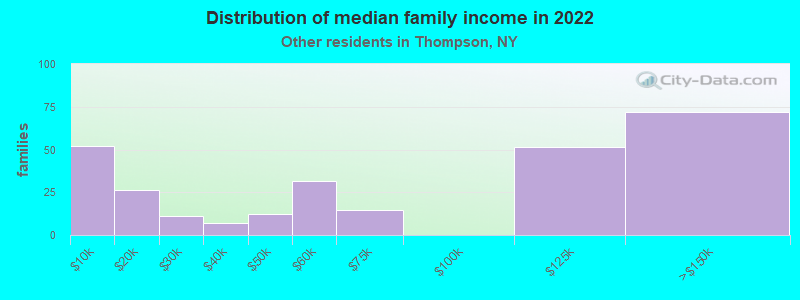
Income statistics for other residents
Number of households with income < $10k:| Thompson: | 10.5% (146) |
| New York: | 10.3% (69,252) |
Number of households with income $10k - 20k:| Thompson: | 10.3% (143) |
| State: | 11.0% (73,890) |
Number of households with income $20k - 30k:| Thompson: | 7.7% (107) |
| New York: | 8.8% (59,096) |
Number of households with income $30k - 40k:| Thompson: | 7.4% (102) |
| State: | 8.1% (54,418) |
Number of households with income $40k - 50k:| Thompson: | 7.4% (103) |
| State: | 7.3% (49,042) |
Number of households with income $50k - 60k:| Thompson: | 5.6% (78) |
| State: | 6.5% (43,945) |
Number of households with income $60k - 75k:| Thompson: | 9.2% (127) |
| State: | 9.5% (64,087) |
Number of households with income $75k - 100k:| Thompson: | 11.3% (157) |
| State: | 10.9% (73,094) |
Number of households with income $100k - 125k:| Thompson: | 8.9% (124) |
| State: | 7.9% (53,055) |
Number of households with income $125k - 150k:| Thompson: | 5.3% (74) |
| State: | 5.9% (39,446) |
Number of households with income $150k - 200k:| Thompson: | 9.0% (125) |
| State: | 7.2% (48,653) |
Number of households with income > $200k:| Thompson: | 7.3% (101) |
| State: | 6.6% (44,703) |
Aggregate household income in Thompson in 2022: $37,115,380
Median family income in Thompson in 2022:| Thompson: | $49,192 |
| State: | $63,465 |
Number of families with income < $10k:| Thompson: | 18.7% (52) |
| New York: | 6.2% (29,008) |
Number of families with income $10k - 20k:| Thompson: | 9.5% (26) |
| State: | 7.4% (34,598) |
Number of families with income $20k - 30k:| Thompson: | 3.9% (11) |
| State: | 9.2% (43,198) |
Number of families with income $30k - 40k:| Thompson: | 2.4% (7) |
| State: | 9.5% (44,688) |
Number of families with income $40k - 50k:| Thompson: | 4.5% (13) |
| New York: | 7.8% (36,771) |
Number of families with income $50k - 60k:| Thompson: | 11.4% (32) |
| State: | 7.1% (33,324) |
Number of families with income $60k - 75k:| Thompson: | 5.3% (15) |
| State: | 10.1% (47,546) |
Number of families with income $100k - 125k:| Thompson: | 18.6% (52) |
| New York: | 8.6% (40,211) |
Number of families with income $125k - 150k:| Thompson: | 25.8% (72) |
| New York: | 6.5% (30,363) |
Median non-family income in Thompson in 2022:| Thompson: | $31,024 |
| New York: | $26,983 |
Change in median non-family income between 2000 and 2022:| Thompson, New York: | +77.3% |
| State: | +66.4% |
Median per capita income in Thompson in 2022:| Thompson: | $21,588 |
| New York: | $26,975 |
Change in median per capita income between 2000 and 2022:| Thompson, New York: | +49.4% |
| New York: | +144.6% |