Throop, New York (NY) income map, earnings map, and wages data
The median household income in Throop, NY in 2022 was $78,682, which was about the same as the median annual income of $79,557 across the entire state of New York. Compared to the median income of $46,065 in 2000 this represents an increase of 41.5%. The per capita income in 2022 was $38,915, which means an increase of 49.1% compared to 2000 when it was $19,799.
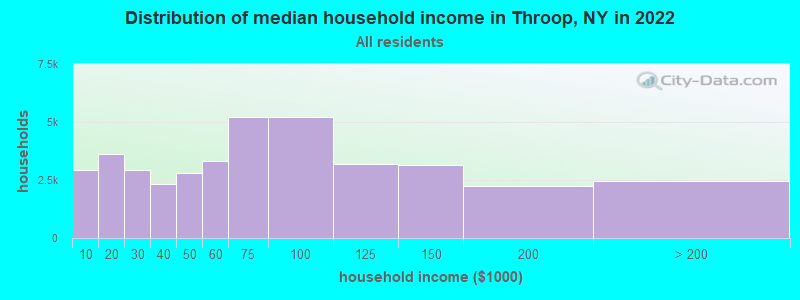
Income statistics for all residents
Median household income in Throop, NY in 2022:| Throop: | $78,683 |
| State: | $79,557 |
Change in median household income between 2000 and 2022:| Throop, New York: | +70.8% |
| New York: | +83.3% |
Number of households with income < $10k:| Throop: | 7.4% (2,920) |
| New York: | 6.8% (527,598) |
Number of households with income $10k - 20k:| Throop: | 9.2% (3,634) |
| State: | 7.4% (574,940) |
Number of households with income $20k - 30k:| Throop: | 7.4% (2,928) |
| State: | 6.7% (517,718) |
Number of households with income $30k - 40k:| Throop: | 5.9% (2,314) |
| State: | 6.5% (506,674) |
Number of households with income $40k - 50k:| Throop: | 7.1% (2,793) |
| State: | 6.1% (470,439) |
Number of households with income $50k - 60k:| Throop: | 8.5% (3,339) |
| State: | 5.8% (454,042) |
Number of households with income $60k - 75k:| Throop: | 13.2% (5,211) |
| State: | 8.5% (657,508) |
Number of households with income $75k - 100k:| Throop: | 13.3% (5,229) |
| New York: | 11.6% (899,824) |
Number of households with income $100k - 125k:| Throop: | 8.1% (3,208) |
| State: | 9.3% (723,825) |
Number of households with income $125k - 150k:| Throop: | 8.0% (3,153) |
| New York: | 7.1% (552,420) |
Number of households with income $150k - 200k:| Throop: | 5.7% (2,260) |
| New York: | 9.4% (727,051) |
Number of households with income > $200k:| Throop: | 6.3% (2,467) |
| State: | 15.0% (1,162,269) |
Aggregate household income in Throop in 2022: $66,562,543
Median family income in Throop in 2022:| Throop: | $96,125 |
| State: | $99,066 |
Median non-family income in Throop in 2022:| Throop: | $55,123 |
| State: | $50,181 |
Change in median non-family income between 2000 and 2022:| Throop, New York: | +107.5% |
| State: | +85.4% |
Median per capita income in Throop in 2022:| Throop: | $38,915 |
| New York: | $47,421 |
Change in median per capita income between 2000 and 2022:| Throop, New York: | +96.6% |
| State: | +102.7% |
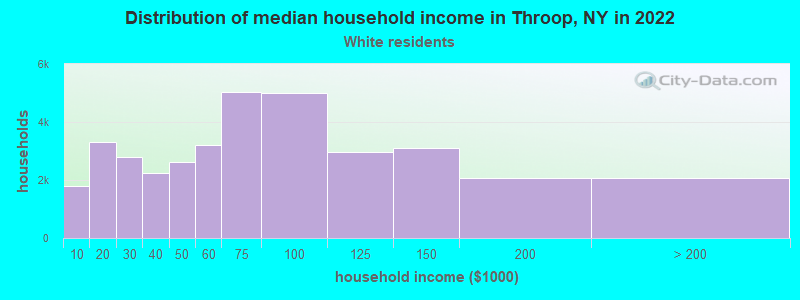
Income statistics for White residents
Median household income in Throop, NY in 2022:| Throop: | $78,703 |
| State: | $89,408 |
Change in median household income between 2000 and 2022:| Throop, New York: | +70.9% |
| State: | +85.5% |
Number of households with income < $10k:| Throop: | 4.9% (1,789) |
| New York: | 4.8% (225,550) |
Number of households with income $10k - 20k:| Throop: | 9.1% (3,305) |
| State: | 6.1% (289,425) |
Number of households with income $20k - 30k:| Throop: | 7.7% (2,794) |
| State: | 5.9% (280,254) |
Number of households with income $30k - 40k:| Throop: | 6.2% (2,251) |
| State: | 6.1% (288,263) |
Number of households with income $40k - 50k:| Throop: | 7.2% (2,616) |
| New York: | 5.9% (278,079) |
Number of households with income $50k - 60k:| Throop: | 8.8% (3,192) |
| State: | 5.7% (267,554) |
Number of households with income $60k - 75k:| Throop: | 13.9% (5,046) |
| State: | 8.4% (398,344) |
Number of households with income $75k - 100k:| Throop: | 13.8% (5,013) |
| State: | 11.8% (554,841) |
Number of households with income $100k - 125k:| Throop: | 8.2% (2,970) |
| New York: | 10.0% (469,794) |
Number of households with income $125k - 150k:| Throop: | 8.6% (3,106) |
| State: | 7.6% (360,467) |
Number of households with income $150k - 200k:| Throop: | 5.7% (2,082) |
| State: | 10.1% (477,078) |
Number of households with income > $200k:| Throop: | 5.7% (2,069) |
| State: | 17.6% (829,233) |
Aggregate household income in Throop in 2022: $63,811,743
Median family income in Throop in 2022:| Throop: | $96,962 |
| New York: | $115,170 |
Number of families with income < $10k:| Throop: | 0.1% (0) |
| State: | 2.5% (68,851) |
Number of families with income $10k - 20k:| Throop: | 2.4% (10) |
| State: | 3.0% (83,127) |
Number of families with income $20k - 30k:| Throop: | 8.4% (36) |
| New York: | 3.5% (97,578) |
Number of families with income $30k - 40k:| Throop: | 5.3% (23) |
| State: | 4.1% (114,108) |
Number of families with income $40k - 50k:| Throop: | 5.7% (25) |
| State: | 4.7% (130,902) |
Number of families with income $50k - 60k:| Throop: | 11.3% (49) |
| State: | 4.9% (135,118) |
Number of families with income $60k - 75k:| Throop: | 15.5% (67) |
| State: | 7.8% (216,254) |
Number of families with income $75k - 100k:| Throop: | 20.4% (88) |
| State: | 12.4% (342,382) |
Number of families with income $100k - 125k:| Throop: | 18.5% (80) |
| New York: | 11.4% (314,917) |
Number of families with income $125k - 150k:| Throop: | 12.4% (54) |
| State: | 9.4% (260,489) |
Median non-family income in Throop in 2022:| Throop: | $57,441 |
| New York: | $54,783 |
Change in median non-family income between 2000 and 2022:| Throop, New York: | +116.2% |
| State: | +87.9% |
Median per capita income in Throop in 2022:| Throop: | $40,098 |
| State: | $57,640 |
Change in median per capita income between 2000 and 2022:| Throop, New York: | +102.7% |
| New York: | +111.6% |
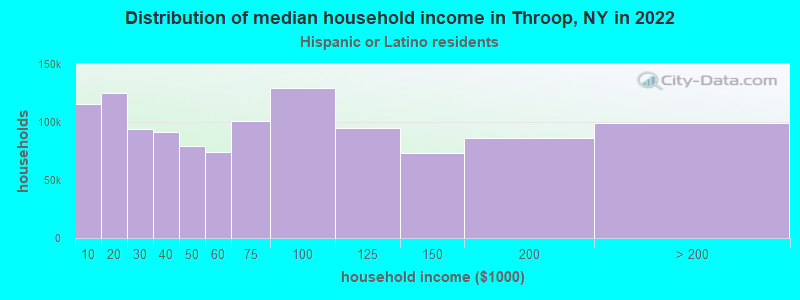
Income statistics for Hispanic or Latino residents
Median household income in Throop, NY in 2022:| Throop: | $109,335 |
| State: | $60,468 |
Change in median household income between 2000 and 2022:| Throop, New York: | +96.6% |
| State: | +98.3% |
Number of households with income < $10k:| Throop: | 10.0% (115,906) |
| State: | 9.9% (127,185) |
Number of households with income $10k - 20k:| Throop: | 10.7% (124,769) |
| State: | 10.7% (136,699) |
Number of households with income $20k - 30k:| Throop: | 8.1% (93,952) |
| New York: | 8.1% (102,991) |
Number of households with income $30k - 40k:| Throop: | 7.8% (91,003) |
| State: | 7.8% (100,149) |
Number of households with income $40k - 50k:| Throop: | 6.8% (79,620) |
| State: | 6.9% (87,760) |
Number of households with income $50k - 60k:| Throop: | 6.3% (73,729) |
| State: | 6.3% (80,968) |
Number of households with income $60k - 75k:| Throop: | 8.6% (100,494) |
| New York: | 8.7% (110,631) |
Number of households with income $75k - 100k:| Throop: | 11.2% (129,716) |
| New York: | 11.2% (142,787) |
Number of households with income $100k - 125k:| Throop: | 8.2% (95,054) |
| New York: | 8.2% (104,850) |
Number of households with income $125k - 150k:| Throop: | 6.3% (72,931) |
| State: | 6.3% (80,274) |
Number of households with income $150k - 200k:| Throop: | 7.4% (86,217) |
| State: | 7.4% (95,117) |
Number of households with income > $200k:| Throop: | 8.6% (99,432) |
| State: | 8.6% (109,514) |
Aggregate household income in Throop in 2022: $398,362
Median family income in Throop in 2022:| Throop: | $117,959 |
| State: | $68,770 |
Number of families with income < $10k:| Throop: | 0.8% (1) |
| State: | 6.9% (58,565) |
Number of families with income $10k - 20k:| Throop: | 5.9% (5) |
| State: | 7.0% (59,058) |
Number of families with income $20k - 30k:| Throop: | 15.4% (13) |
| New York: | 8.0% (68,048) |
Number of families with income $30k - 40k:| Throop: | 15.6% (13) |
| New York: | 8.4% (70,668) |
Number of families with income $40k - 50k:| Throop: | 11.3% (10) |
| State: | 7.4% (62,941) |
Number of families with income $50k - 60k:| Throop: | 9.7% (8) |
| State: | 6.6% (55,592) |
Number of families with income $60k - 75k:| Throop: | 15.7% (14) |
| New York: | 9.3% (78,564) |
Number of families with income $75k - 100k:| Throop: | 15.4% (13) |
| State: | 12.6% (106,685) |
Number of families with income $100k - 125k:| Throop: | 7.2% (6) |
| State: | 9.4% (79,139) |
Number of families with income $125k - 150k:| Throop: | 3.0% (3) |
| State: | 6.9% (58,255) |
Median per capita income in Throop in 2022:| Throop: | $6,149 |
| State: | $29,761 |
Change in median per capita income between 2000 and 2022:| Throop, New York: | +5.3% |
| State: | +132.7% |
Income statistics for other residents
Number of households with income < $10k:| Throop: | 10.3% (114,310) |
| State: | 10.3% (69,252) |
Number of households with income $10k - 20k:| Throop: | 11.0% (122,096) |
| State: | 11.0% (73,890) |
Number of households with income $20k - 30k:| Throop: | 8.8% (97,732) |
| New York: | 8.8% (59,096) |
Number of households with income $30k - 40k:| Throop: | 8.1% (89,967) |
| New York: | 8.1% (54,418) |
Number of households with income $40k - 50k:| Throop: | 7.3% (80,951) |
| New York: | 7.3% (49,042) |
Number of households with income $50k - 60k:| Throop: | 6.5% (72,697) |
| New York: | 6.5% (43,945) |
Number of households with income $60k - 75k:| Throop: | 9.5% (105,868) |
| State: | 9.5% (64,087) |
Number of households with income $75k - 100k:| Throop: | 10.9% (120,613) |
| New York: | 10.9% (73,094) |
Number of households with income $100k - 125k:| Throop: | 7.9% (87,439) |
| State: | 7.9% (53,055) |
Number of households with income $125k - 150k:| Throop: | 5.9% (65,209) |
| State: | 5.9% (39,446) |
Number of households with income $150k - 200k:| Throop: | 7.2% (80,054) |
| State: | 7.2% (48,653) |
Number of households with income > $200k:| Throop: | 6.6% (73,709) |
| State: | 6.6% (44,703) |
Median per capita income in Throop in 2022:| Throop: | $33,786 |
| State: | $26,975 |