The median household income in Trout Valley, IL in 2022 was $202,246, which was 62.1% greater than the median annual income of $76,708 across the entire state of Illinois. Compared to the median income of $99,297 in 2000 this represents an increase of 50.9%. The per capita income in 2022 was $91,804, which means an increase of 36.8% compared to 2000 when it was $58,013.
Whole page based on the data from 2000 / 2022 when the population of Trout Valley, Illinois was 599 / 594
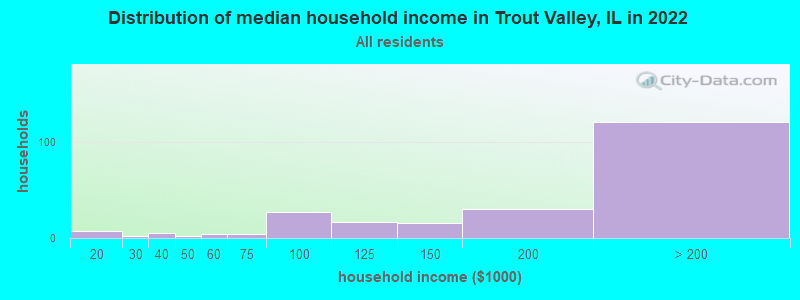
Income statistics for all residents
Median household income in Trout Valley, IL in 2022:
Trout Valley:
$202,246
State:
$76,708
Change in median household income between 2000 and 2022:
Trout Valley, Illinois:
+103.7%
State:
+64.6%
Number of households with income < $10k:
Trout Valley:
0.4% (1)
Illinois:
5.9% (296,090)
Number of households with income $10k - 20k:
Trout Valley:
3.0% (7)
State:
6.6% (333,259)
Number of households with income $20k - 30k:
Trout Valley:
0.8% (2)
Illinois:
6.8% (342,921)
Number of households with income $30k - 40k:
Trout Valley:
2.1% (5)
State:
7.0% (355,254)
Number of households with income $40k - 50k:
Trout Valley:
0.8% (2)
State:
6.7% (340,678)
Number of households with income $50k - 60k:
Trout Valley:
1.7% (4)
Illinois:
6.7% (339,405)
Number of households with income $60k - 75k:
Trout Valley:
1.7% (4)
State:
9.2% (465,709)
Number of households with income $75k - 100k:
Trout Valley:
11.4% (27)
State:
12.9% (651,353)
Number of households with income $100k - 125k:
Trout Valley:
7.2% (17)
State:
10.3% (522,359)
Number of households with income $125k - 150k:
Trout Valley:
6.8% (16)
Illinois:
7.3% (367,136)
Number of households with income $150k - 200k:
Trout Valley:
12.7% (30)
State:
9.0% (455,249)
Number of households with income > $200k:
Trout Valley:
51.3% (121)
Illinois:
11.6% (586,947)
Aggregate household income in Trout Valley in 2022: $53,381,270
Median family income in Trout Valley in 2022:
Trout Valley:
$205,118
State:
$96,948
Number of families with income < $10k:
Trout Valley:
0.5% (1)
State:
3.4% (105,875)
Number of families with income $10k - 20k:
Trout Valley:
1.4% (2)
State:
3.3% (105,017)
Number of families with income $30k - 40k:
Trout Valley:
1.5% (3)
State:
5.3% (167,069)
Number of families with income $50k - 60k:
Trout Valley:
2.4% (4)
Illinois:
6.1% (191,561)
Number of families with income $60k - 75k:
Trout Valley:
2.0% (3)
Illinois:
9.0% (282,985)
Number of families with income $75k - 100k:
Trout Valley:
10.2% (18)
Illinois:
13.8% (432,725)
Number of families with income $100k - 125k:
Trout Valley:
5.6% (10)
State:
11.9% (373,296)
Number of families with income $125k - 150k:
Trout Valley:
8.0% (14)
State:
8.9% (279,791)
Number of families with income $150k - 200k:
Trout Valley:
14.3% (25)
State:
11.9% (372,004)
Number of families with income > $200k:
Trout Valley:
54.1% (93)
State:
15.9% (500,033)
Median non-family income in Trout Valley in 2022:
Trout Valley:
$221,861
State:
$46,533
Median per capita income in Trout Valley in 2022:
Trout Valley:
$91,804
State:
$43,317
Change in median per capita income between 2000 and 2022:
Trout Valley, Illinois:
+58.2%
State:
+87.5%
Income statistics for White residents
Median household income in Trout Valley, IL in 2022:
Trout Valley:
$203,068
State:
$83,346
Change in median household income between 2000 and 2022:
Trout Valley, Illinois:
+112.9%
Illinois:
+67.5%
Number of households with income < $10k:
Trout Valley:
0.4% (1)
State:
4.5% (149,895)
Number of households with income $10k - 20k:
Trout Valley:
2.6% (6)
Illinois:
5.5% (184,529)
Number of households with income $20k - 30k:
Trout Valley:
0.9% (2)
State:
6.1% (205,767)
Number of households with income $30k - 40k:
Trout Valley:
2.2% (5)
State:
6.7% (225,572)
Number of households with income $40k - 50k:
Trout Valley:
0.9% (2)
Illinois:
6.5% (216,965)
Number of households with income $50k - 60k:
Trout Valley:
1.7% (4)
State:
6.6% (222,841)
Number of households with income $60k - 75k:
Trout Valley:
1.7% (4)
Illinois:
9.3% (312,758)
Number of households with income $75k - 100k:
Trout Valley:
11.7% (27)
Illinois:
12.9% (433,180)
Number of households with income $100k - 125k:
Trout Valley:
7.0% (16)
State:
10.7% (360,753)
Number of households with income $125k - 150k:
Trout Valley:
6.5% (15)
State:
7.9% (266,532)
Number of households with income $150k - 200k:
Trout Valley:
12.2% (28)
State:
10.0% (337,357)
Number of households with income > $200k:
Trout Valley:
52.2% (120)
Illinois:
13.3% (446,069)
Aggregate household income in Trout Valley in 2022: $51,268,909
Median family income in Trout Valley in 2022:
Trout Valley:
$205,268
State:
$107,938
Number of families with income < $10k:
Trout Valley:
0.5% (1)
State:
2.2% (45,983)
Number of families with income $10k - 20k:
Trout Valley:
1.5% (2)
State:
2.5% (50,574)
Number of families with income $30k - 40k:
Trout Valley:
1.4% (2)
State:
4.4% (90,563)
Number of families with income $50k - 60k:
Trout Valley:
2.4% (4)
State:
5.8% (119,129)
Number of families with income $60k - 75k:
Trout Valley:
2.0% (3)
State:
8.8% (179,665)
Number of families with income $75k - 100k:
Trout Valley:
10.3% (17)
State:
13.5% (276,887)
Number of families with income $100k - 125k:
Trout Valley:
5.6% (9)
State:
12.5% (256,099)
Number of families with income $125k - 150k:
Trout Valley:
7.5% (13)
Illinois:
9.8% (199,855)
Number of families with income $150k - 200k:
Trout Valley:
13.8% (23)
State:
13.4% (274,569)
Number of families with income > $200k:
Trout Valley:
55.0% (93)
State:
18.6% (381,354)
Median non-family income in Trout Valley in 2022:
Trout Valley:
$228,885
State:
$50,934
Median per capita income in Trout Valley in 2022:
Trout Valley:
$96,817
Illinois:
$50,738
Change in median per capita income between 2000 and 2022:
Trout Valley, Illinois:
+88.9%
State:
+95.5%
Income statistics for Black or African American residents
Median per capita income in Trout Valley in 2022:
Trout Valley:
$224,699
State:
$28,045
Change in median per capita income between 2000 and 2022:
Trout Valley, Illinois:
+34.8%
Illinois:
+90.2%
Income statistics for Hispanic or Latino residents
Median per capita income in Trout Valley in 2022:
Trout Valley:
$26,745
State:
$26,551
Income statistics for Multirace residents
Median per capita income in Trout Valley in 2022:
Trout Valley:
$50,039
State:
$29,285
Change in median per capita income between 2000 and 2022:: -85.2%
Trout Valley, Illinois:
-85.2%
State:
+112.9%
Income statistics for other residents
Median per capita income in Trout Valley in 2022:
Trout Valley:
$1,021
Illinois:
$25,392
Change in median per capita income between 2000 and 2022:
Trout Valley, Illinois:
+63.3%
Illinois:
+117.4%
Discuss Trout Valley, Illinois (IL) on our hugely popular Illinois forum.