The median household income in Tynan, TX in 2022 was $48,340, which was 49.5% less than the median annual income of $72,284 across the entire state of Texas. Compared to the median income of $11,250 in 2000 this represents an increase of 76.7%. The per capita income in 2022 was $13,996, which means an increase of 58.0% compared to 2000 when it was $5,874.
Whole page based on the data from 2000 / 2022 when the population of Tynan, Texas was 301 / 297
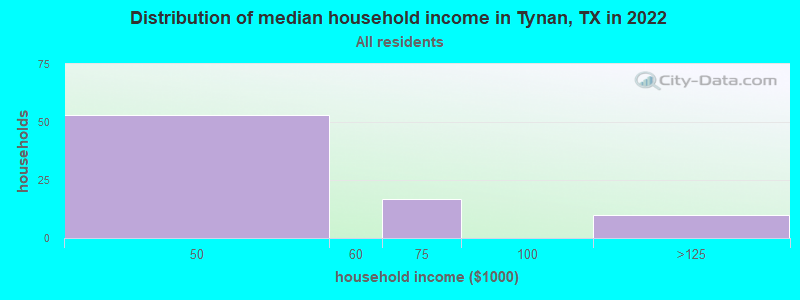
Income statistics for all residents
Median household income in Tynan, TX in 2022:
Tynan:
$48,341
State:
$72,284
Number of households with income < $10k:
Tynan:
0.0% (0)
Texas:
5.5% (611,011)
Number of households with income $10k - 20k:
Tynan:
0.0% (0)
State:
6.7% (743,157)
Number of households with income $20k - 30k:
Tynan:
0.0% (0)
Texas:
7.2% (803,381)
Number of households with income $30k - 40k:
Tynan:
0.0% (0)
State:
7.8% (866,080)
Number of households with income $40k - 50k:
Tynan:
66.2% (53)
State:
7.3% (810,440)
Number of households with income $50k - 60k:
Tynan:
0.0% (0)
State:
7.2% (799,783)
Number of households with income $60k - 75k:
Tynan:
21.2% (17)
State:
9.9% (1,095,384)
Number of households with income $75k - 100k:
Tynan:
0.0% (0)
State:
12.8% (1,419,057)
Number of households with income $100k - 125k:
Tynan:
12.5% (10)
Texas:
9.5% (1,054,577)
Number of households with income $125k - 150k:
Tynan:
0.0% (0)
State:
6.7% (741,518)
Number of households with income $150k - 200k:
Tynan:
0.0% (0)
State:
8.7% (961,776)
Number of households with income > $200k:
Tynan:
0.0% (0)
State:
10.7% (1,181,544)
Aggregate household income in Tynan in 2022: $4,732,777
Median family income in Tynan in 2022:
Tynan:
$47,692
State:
$86,267
Number of families with income $40k - 50k:
Tynan:
75.1% (53)
State:
6.7% (499,663)
Number of families with income $60k - 75k:
Tynan:
10.5% (7)
Texas:
9.5% (710,229)
Number of families with income $100k - 125k:
Tynan:
14.3% (10)
State:
10.7% (797,961)
Median income for families with 0 earners:
Tynan:
$0
Texas:
$41,529
Median income for families with 1 earner:
Tynan:
$0
State:
$59,030
Median income for families with 2 earners:
Tynan:
$48,480
Texas:
$111,348
Median income for families with 3+ earners:
Tynan:
$0
State:
$132,976
Median per capita income in Tynan in 2022:
Tynan:
$13,997
State:
$38,123
Change in median per capita income between 2000 and 2022:
Tynan, Texas:
+138.3%
State:
+94.3%
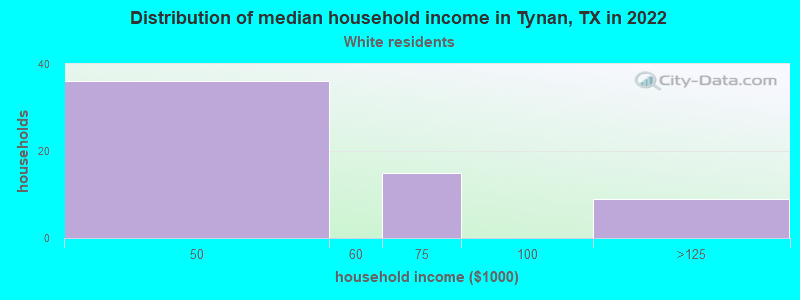
Income statistics for White residents
Median household income in Tynan, TX in 2022:
Tynan:
$50,379
Texas:
$82,032
Number of households with income < $10k:
Tynan:
0.0% (0)
State:
4.7% (273,716)
Number of households with income $10k - 20k:
Tynan:
0.0% (0)
State:
5.5% (322,702)
Number of households with income $20k - 30k:
Tynan:
0.0% (0)
Texas:
6.2% (363,947)
Number of households with income $30k - 40k:
Tynan:
0.0% (0)
State:
6.8% (399,275)
Number of households with income $40k - 50k:
Tynan:
60.0% (36)
State:
6.5% (383,417)
Number of households with income $50k - 60k:
Tynan:
0.0% (0)
Texas:
6.6% (388,535)
Number of households with income $60k - 75k:
Tynan:
25.0% (15)
Texas:
9.7% (566,295)
Number of households with income $75k - 100k:
Tynan:
0.0% (0)
Texas:
13.0% (760,276)
Number of households with income $100k - 125k:
Tynan:
15.0% (9)
State:
10.2% (597,596)
Number of households with income $125k - 150k:
Tynan:
0.0% (0)
State:
7.4% (436,830)
Number of households with income $150k - 200k:
Tynan:
0.0% (0)
State:
9.9% (583,067)
Number of households with income > $200k:
Tynan:
0.0% (0)
State:
13.5% (792,647)
Aggregate household income in Tynan in 2022: $3,857,938
Median family income in Tynan in 2022:
Tynan:
$51,124
State:
$101,788
Number of families with income $40k - 50k:
Tynan:
70.3% (35)
Texas:
5.6% (216,490)
Number of families with income $60k - 75k:
Tynan:
12.2% (6)
State:
9.0% (346,106)
Number of families with income $100k - 125k:
Tynan:
17.5% (9)
Texas:
11.6% (448,411)
Median per capita income in Tynan in 2022:
Tynan:
$15,838
State:
$47,740
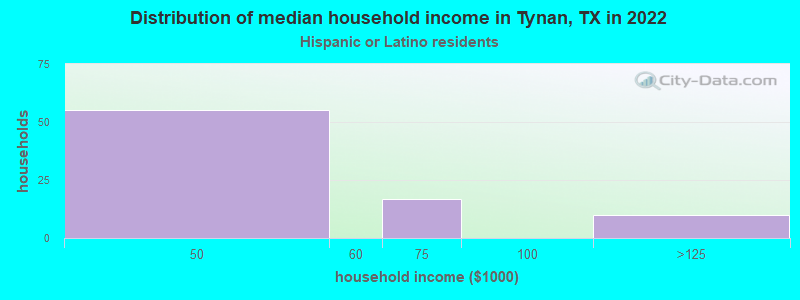
Income statistics for Hispanic or Latino residents
Median household income in Tynan, TX in 2022:
Tynan:
$49,287
State:
$60,504
Number of households with income < $10k:
Tynan:
0.0% (0)
State:
5.8% (213,953)
Number of households with income $10k - 20k:
Tynan:
0.0% (0)
Texas:
8.0% (297,456)
Number of households with income $20k - 30k:
Tynan:
0.0% (0)
State:
9.2% (340,166)
Number of households with income $30k - 40k:
Tynan:
0.0% (0)
State:
9.5% (354,336)
Number of households with income $40k - 50k:
Tynan:
67.1% (55)
State:
8.8% (327,013)
Number of households with income $50k - 60k:
Tynan:
0.0% (0)
Texas:
8.3% (308,818)
Number of households with income $60k - 75k:
Tynan:
20.7% (17)
State:
10.9% (405,109)
Number of households with income $75k - 100k:
Tynan:
0.0% (0)
Texas:
13.8% (511,639)
Number of households with income $100k - 125k:
Tynan:
12.2% (10)
Texas:
8.6% (319,728)
Number of households with income $125k - 150k:
Tynan:
0.0% (0)
State:
5.7% (210,932)
Number of households with income $150k - 200k:
Tynan:
0.0% (0)
State:
6.4% (236,055)
Number of households with income > $200k:
Tynan:
0.0% (0)
Texas:
5.1% (189,259)
Aggregate household income in Tynan in 2022: $4,866,920
Median family income in Tynan in 2022:
Tynan:
$48,558
State:
$65,080
Number of families with income $40k - 50k:
Tynan:
75.1% (54)
State:
8.6% (240,188)
Number of families with income $60k - 75k:
Tynan:
10.6% (8)
State:
10.9% (302,688)
Number of families with income $100k - 125k:
Tynan:
14.3% (10)
State:
9.5% (264,007)
Median per capita income in Tynan in 2022:
Tynan:
$14,159
State:
$24,862
Income statistics for other residents
Aggregate household income in Tynan in 2022: $856,107
Median per capita income in Tynan in 2022:
Tynan:
$17,001
Texas:
$23,899
Discuss Tynan, Texas (TX) on our hugely popular Texas forum.