Upper Yellowstone Valley, Montana (MT) income map, earnings map, and wages data
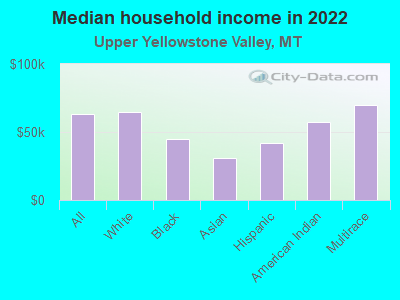
The median household income in Upper Yellowstone Valley, MT in 2022 was $63,490, which was 6.5% less than the median annual income of $67,631 across the entire state of Montana. Compared to the median income of $31,057 in 2000 this represents an increase of 51.1%. The per capita income in 2022 was $39,144, which means an increase of 55.3% compared to 2000 when it was $17,513.
Income statistics for all residents
Median household income in Upper Yellowstone Valley, MT in 2022:| Upper Yellowstone Valley: | $63,490 |
| Montana: | $67,631 |
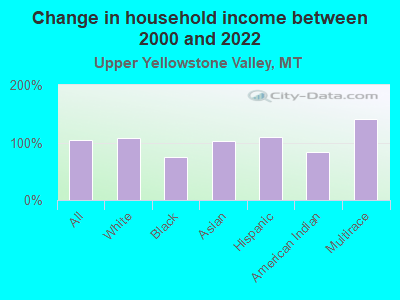
Change in median household income between 2000 and 2022:| Upper Yellowstone Valley, Montana: | +104.4% |
| Montana: | +104.8% |
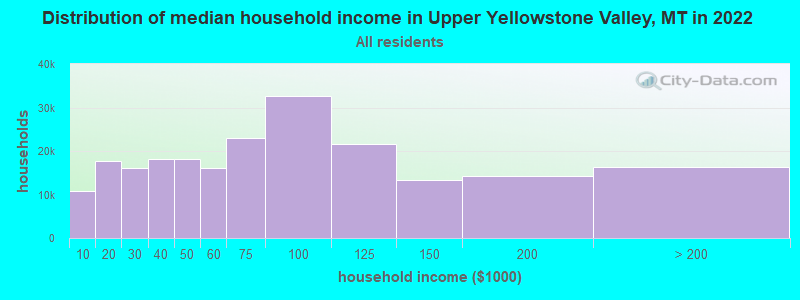
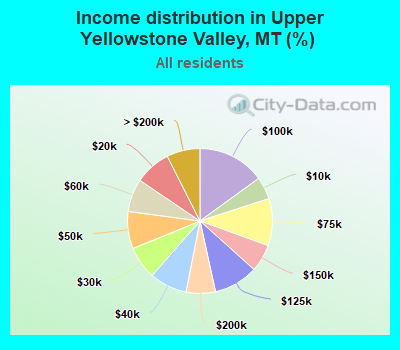
Number of households with income < $10k:| Upper Yellowstone Valley: | 5.0% (10,903) |
| State: | 5.0% (23,231) |
Number of households with income $10k - 20k:| Upper Yellowstone Valley: | 8.1% (17,638) |
| State: | 8.1% (37,478) |
Number of households with income $20k - 30k:| Upper Yellowstone Valley: | 7.3% (16,003) |
| State: | 7.3% (33,880) |
Number of households with income $30k - 40k:| Upper Yellowstone Valley: | 8.4% (18,261) |
| Montana: | 8.4% (38,912) |
Number of households with income $40k - 50k:| Upper Yellowstone Valley: | 8.3% (18,099) |
| State: | 8.3% (38,441) |
Number of households with income $50k - 60k:| Upper Yellowstone Valley: | 7.4% (16,031) |
| Montana: | 7.4% (34,172) |
Number of households with income $60k - 75k:| Upper Yellowstone Valley: | 10.5% (22,924) |
| State: | 10.5% (48,783) |
Number of households with income $75k - 100k:| Upper Yellowstone Valley: | 15.0% (32,723) |
| State: | 15.0% (69,571) |
Number of households with income $100k - 125k:| Upper Yellowstone Valley: | 9.9% (21,583) |
| State: | 9.9% (45,889) |
Number of households with income $125k - 150k:| Upper Yellowstone Valley: | 6.1% (13,373) |
| State: | 6.1% (28,538) |
Number of households with income $150k - 200k:| Upper Yellowstone Valley: | 6.5% (14,250) |
| State: | 6.6% (30,552) |
Number of households with income > $200k:| Upper Yellowstone Valley: | 7.4% (16,210) |
| State: | 7.5% (34,625) |
Aggregate household income in Upper Yellowstone Valley in 2022: $2,022,904,508
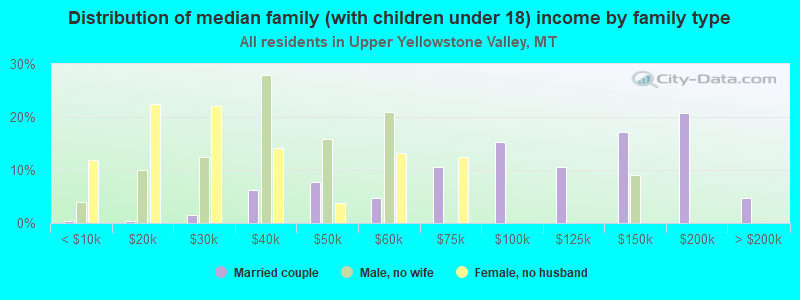
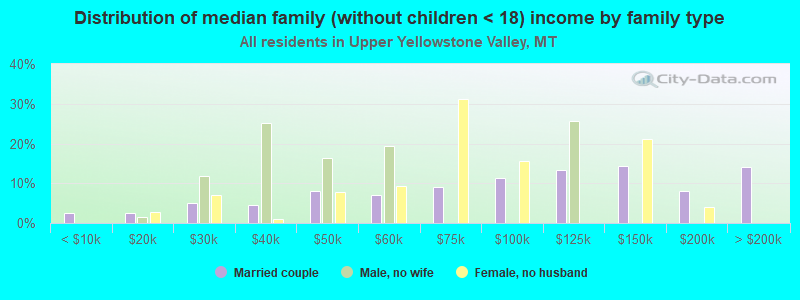
Median family income in Upper Yellowstone Valley in 2022:| Upper Yellowstone Valley: | $83,608 |
| Montana: | $83,580 |
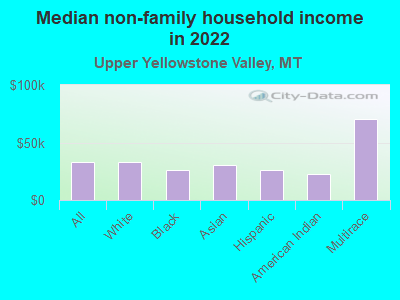
Median non-family income in Upper Yellowstone Valley in 2022:| Upper Yellowstone Valley: | $32,979 |
| State: | $40,582 |
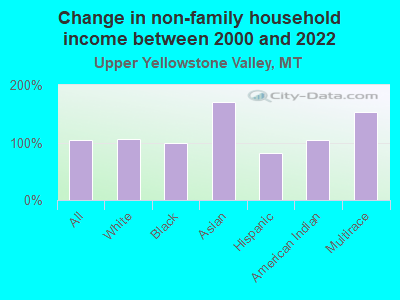
Change in median non-family income between 2000 and 2022:| Upper Yellowstone Valley, Montana: | +103.9% |
| State: | +108.3% |
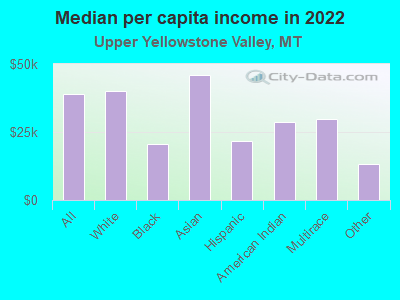
Median per capita income in Upper Yellowstone Valley in 2022:| Upper Yellowstone Valley: | $39,145 |
| State: | $38,329 |
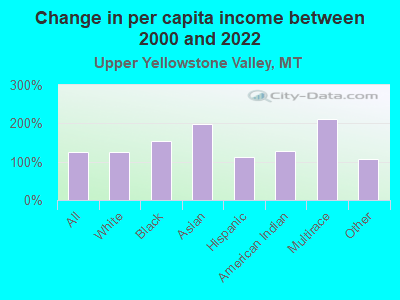
Change in median per capita income between 2000 and 2022:| Upper Yellowstone Valley, Montana: | +123.5% |
| State: | +123.5% |
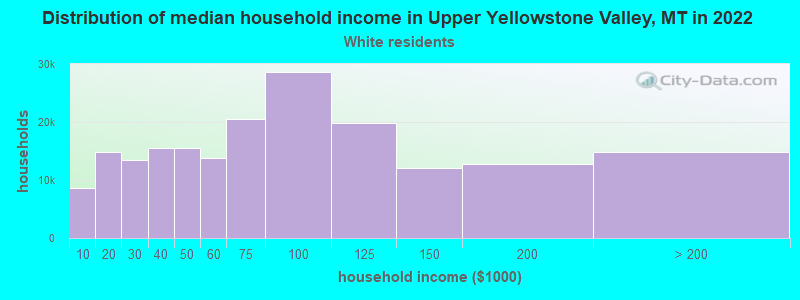
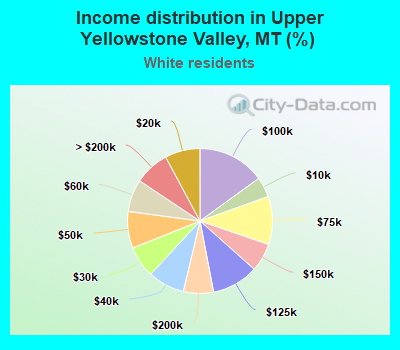
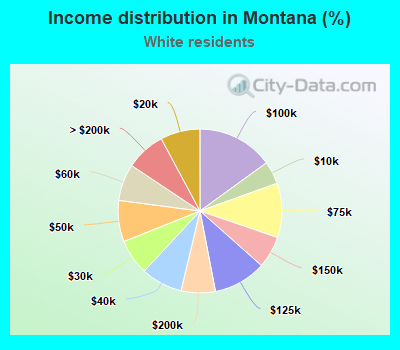
Income statistics for White residents
Median household income in Upper Yellowstone Valley, MT in 2022:| Upper Yellowstone Valley: | $64,683 |
| Montana: | $69,744 |
Change in median household income between 2000 and 2022:| Upper Yellowstone Valley, Montana: | +106.8% |
| State: | +106.5% |
Number of households with income < $10k:| Upper Yellowstone Valley: | 4.5% (8,556) |
| State: | 4.5% (18,406) |
Number of households with income $10k - 20k:| Upper Yellowstone Valley: | 7.8% (14,898) |
| Montana: | 7.8% (32,061) |
Number of households with income $20k - 30k:| Upper Yellowstone Valley: | 7.1% (13,442) |
| State: | 7.0% (28,825) |
Number of households with income $30k - 40k:| Upper Yellowstone Valley: | 8.2% (15,539) |
| State: | 8.2% (33,552) |
Number of households with income $40k - 50k:| Upper Yellowstone Valley: | 8.2% (15,555) |
| Montana: | 8.2% (33,446) |
Number of households with income $50k - 60k:| Upper Yellowstone Valley: | 7.2% (13,778) |
| State: | 7.3% (29,753) |
Number of households with income $60k - 75k:| Upper Yellowstone Valley: | 10.8% (20,448) |
| Montana: | 10.7% (44,051) |
Number of households with income $75k - 100k:| Upper Yellowstone Valley: | 15.0% (28,566) |
| State: | 15.0% (61,580) |
Number of households with income $100k - 125k:| Upper Yellowstone Valley: | 10.4% (19,787) |
| Montana: | 10.4% (42,636) |
Number of households with income $125k - 150k:| Upper Yellowstone Valley: | 6.3% (12,004) |
| State: | 6.3% (25,938) |
Number of households with income $150k - 200k:| Upper Yellowstone Valley: | 6.7% (12,769) |
| Montana: | 6.8% (27,704) |
Number of households with income > $200k:| Upper Yellowstone Valley: | 7.8% (14,823) |
| State: | 7.8% (32,101) |
Aggregate household income in Upper Yellowstone Valley in 2022: $1,799,922,792
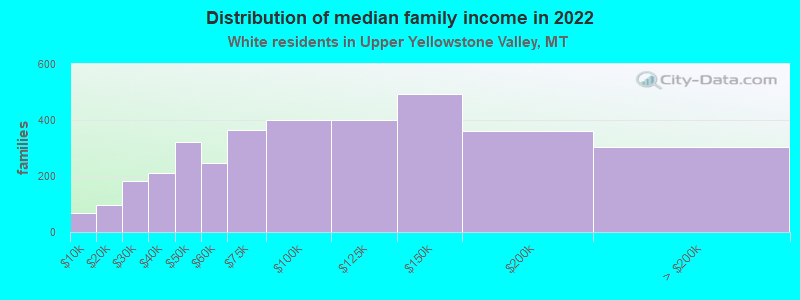
Median family income in Upper Yellowstone Valley in 2022:| Upper Yellowstone Valley: | $85,012 |
| State: | $86,163 |
Number of families with income < $10k:| Upper Yellowstone Valley: | 2.0% (69) |
| Montana: | 2.0% (4,963) |
Number of families with income $10k - 20k:| Upper Yellowstone Valley: | 2.8% (96) |
| State: | 2.8% (7,063) |
Number of families with income $20k - 30k:| Upper Yellowstone Valley: | 5.2% (181) |
| State: | 4.5% (11,218) |
Number of families with income $30k - 40k:| Upper Yellowstone Valley: | 6.1% (209) |
| Montana: | 6.0% (14,834) |
Number of families with income $40k - 50k:| Upper Yellowstone Valley: | 9.3% (321) |
| Montana: | 6.8% (16,997) |
Number of families with income $50k - 60k:| Upper Yellowstone Valley: | 7.2% (246) |
| State: | 7.3% (18,007) |
Number of families with income $60k - 75k:| Upper Yellowstone Valley: | 10.5% (363) |
| State: | 11.6% (28,681) |
Number of families with income $75k - 100k:| Upper Yellowstone Valley: | 11.7% (401) |
| Montana: | 17.2% (42,622) |
Number of families with income $100k - 125k:| Upper Yellowstone Valley: | 11.6% (399) |
| Montana: | 13.5% (33,620) |
Number of families with income $125k - 150k:| Upper Yellowstone Valley: | 14.3% (494) |
| State: | 8.7% (21,654) |
Number of families with income $150k - 200k:| Upper Yellowstone Valley: | 10.5% (361) |
| State: | 9.6% (23,873) |
Number of families with income > $200k:| Upper Yellowstone Valley: | 8.8% (305) |
| State: | 10.0% (24,758) |
Median non-family income in Upper Yellowstone Valley in 2022:| Upper Yellowstone Valley: | $33,243 |
| Montana: | $41,403 |
Change in median non-family income between 2000 and 2022:| Upper Yellowstone Valley, Montana: | +105.8% |
| State: | +109.4% |
Median per capita income in Upper Yellowstone Valley in 2022:| Upper Yellowstone Valley: | $39,964 |
| State: | $40,453 |
Change in median per capita income between 2000 and 2022:| Upper Yellowstone Valley, Montana: | +125.9% |
| Montana: | +125.6% |
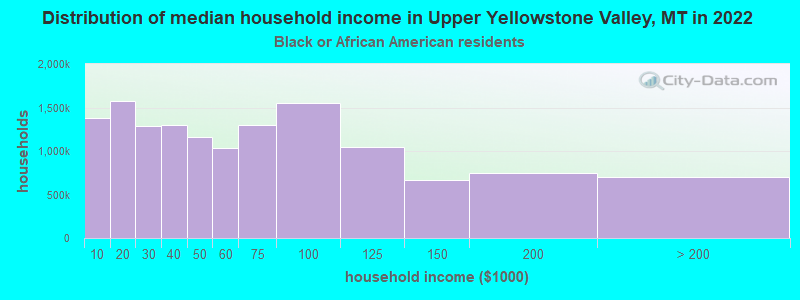
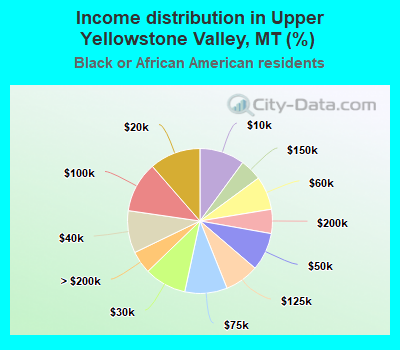
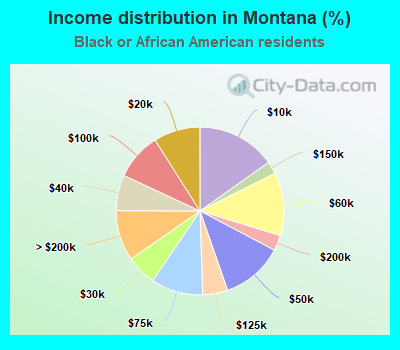
Income statistics for Black or African American residents
Median household income in Upper Yellowstone Valley, MT in 2022:| Upper Yellowstone Valley: | $45,039 |
| State: | $50,676 |
Change in median household income between 2000 and 2022:| Upper Yellowstone Valley, Montana: | +74.6% |
| State: | +93.8% |
Number of households with income < $10k:| Upper Yellowstone Valley: | 10.1% (1,384,402) |
| State: | 15.2% (230) |
Number of households with income $10k - 20k:| Upper Yellowstone Valley: | 11.4% (1,569,973) |
| State: | 9.0% (136) |
Number of households with income $20k - 30k:| Upper Yellowstone Valley: | 9.4% (1,291,708) |
| Montana: | 5.9% (89) |
Number of households with income $30k - 40k:| Upper Yellowstone Valley: | 9.5% (1,301,314) |
| Montana: | 6.9% (104) |
Number of households with income $40k - 50k:| Upper Yellowstone Valley: | 8.5% (1,166,445) |
| State: | 12.0% (181) |
Number of households with income $50k - 60k:| Upper Yellowstone Valley: | 7.5% (1,030,497) |
| State: | 12.2% (184) |
Number of households with income $60k - 75k:| Upper Yellowstone Valley: | 9.5% (1,304,444) |
| State: | 10.0% (151) |
Number of households with income $75k - 100k:| Upper Yellowstone Valley: | 11.3% (1,554,929) |
| State: | 9.1% (137) |
Number of households with income $100k - 125k:| Upper Yellowstone Valley: | 7.6% (1,050,549) |
| Montana: | 4.8% (73) |
Number of households with income $125k - 150k:| Upper Yellowstone Valley: | 4.9% (669,007) |
| Montana: | 2.4% (36) |
Number of households with income $150k - 200k:| Upper Yellowstone Valley: | 5.4% (743,188) |
| State: | 3.0% (45) |
Number of households with income > $200k:| Upper Yellowstone Valley: | 5.1% (696,440) |
| Montana: | 9.7% (147) |
Aggregate household income in Upper Yellowstone Valley in 2022: $2,067,743
Median non-family income in Upper Yellowstone Valley in 2022:| Upper Yellowstone Valley: | $26,513 |
| State: | $39,566 |
Change in median non-family income between 2000 and 2022:| Upper Yellowstone Valley, Montana: | +100.1% |
| Montana: | +100.1% |
Median per capita income in Upper Yellowstone Valley in 2022:| Upper Yellowstone Valley: | $20,431 |
| Montana: | $55,327 |
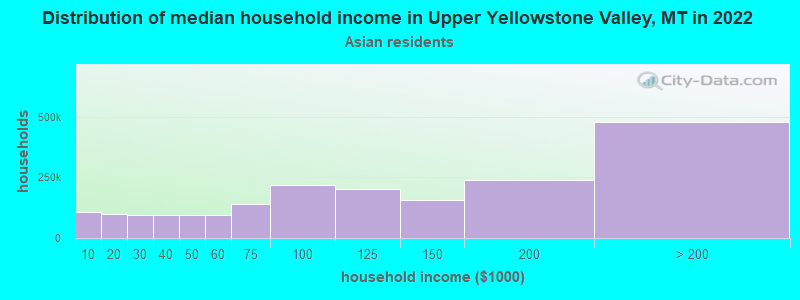
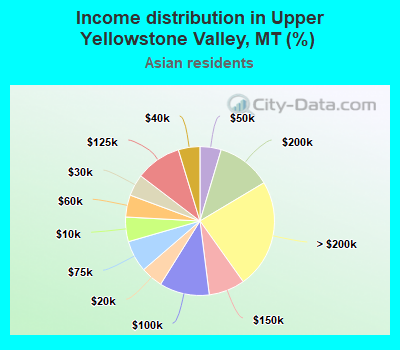
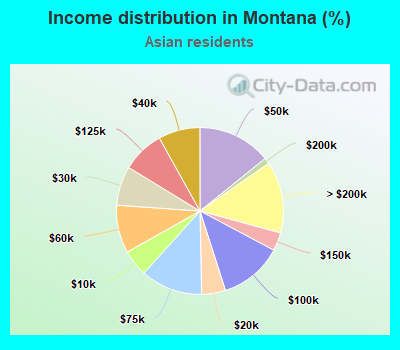
Income statistics for Asian residents
Median household income in Upper Yellowstone Valley, MT in 2022:| Upper Yellowstone Valley: | $31,176 |
| State: | $56,041 |
Change in median household income between 2000 and 2022:| Upper Yellowstone Valley, Montana: | +102.2% |
| Montana: | +129.5% |
Number of households with income < $10k:| Upper Yellowstone Valley: | 5.3% (107,591) |
| Montana: | 5.1% (160) |
Number of households with income $10k - 20k:| Upper Yellowstone Valley: | 4.8% (97,127) |
| Montana: | 4.6% (144) |
Number of households with income $20k - 30k:| Upper Yellowstone Valley: | 4.7% (95,062) |
| Montana: | 7.6% (237) |
Number of households with income $30k - 40k:| Upper Yellowstone Valley: | 4.7% (94,362) |
| Montana: | 8.1% (251) |
Number of households with income $40k - 50k:| Upper Yellowstone Valley: | 4.6% (92,919) |
| Montana: | 14.2% (442) |
Number of households with income $50k - 60k:| Upper Yellowstone Valley: | 4.8% (96,441) |
| State: | 9.3% (289) |
Number of households with income $60k - 75k:| Upper Yellowstone Valley: | 6.9% (138,309) |
| State: | 12.0% (373) |
Number of households with income $75k - 100k:| Upper Yellowstone Valley: | 10.9% (219,104) |
| State: | 12.3% (382) |
Number of households with income $100k - 125k:| Upper Yellowstone Valley: | 10.0% (200,863) |
| State: | 8.2% (255) |
Number of households with income $125k - 150k:| Upper Yellowstone Valley: | 7.8% (158,057) |
| State: | 3.5% (110) |
Number of households with income $150k - 200k:| Upper Yellowstone Valley: | 11.8% (238,547) |
| State: | 1.1% (35) |
Number of households with income > $200k:| Upper Yellowstone Valley: | 23.7% (478,901) |
| State: | 13.9% (433) |
Aggregate household income in Upper Yellowstone Valley in 2022: $1,798,104
Median family income in Upper Yellowstone Valley in 2022:| Upper Yellowstone Valley: | $236,418 |
| Montana: | $83,670 |
Median non-family income in Upper Yellowstone Valley in 2022:| Upper Yellowstone Valley: | $30,371 |
| State: | $40,149 |
Median per capita income in Upper Yellowstone Valley in 2022:| Upper Yellowstone Valley: | $46,063 |
| State: | $44,327 |
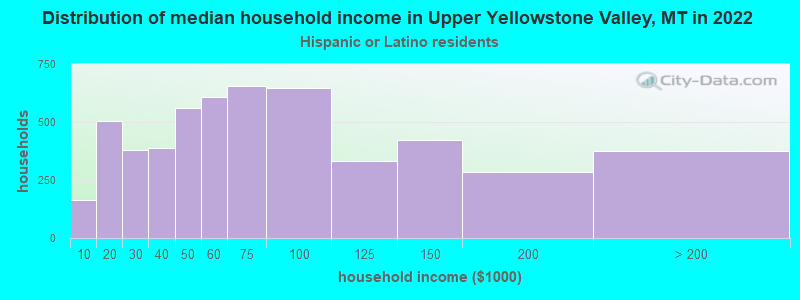
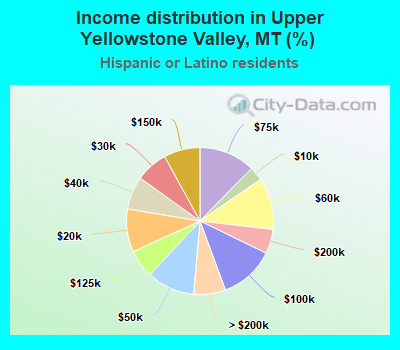
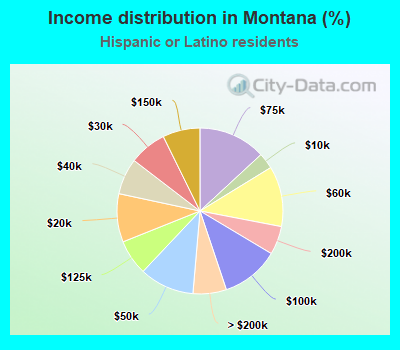
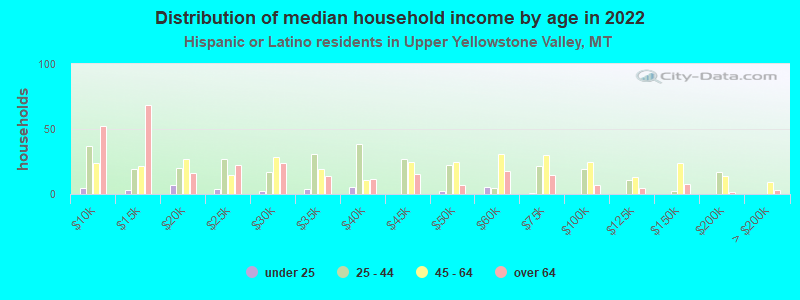
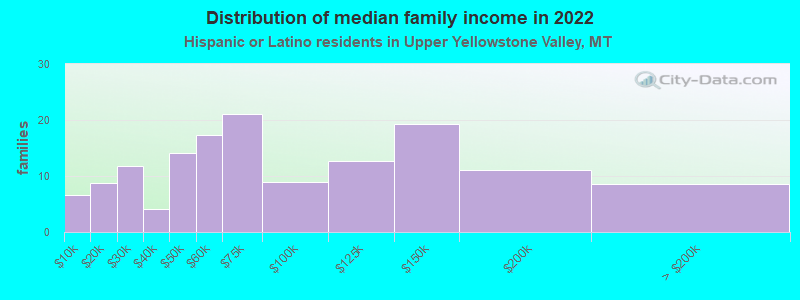
Income statistics for Hispanic or Latino residents
Median household income in Upper Yellowstone Valley, MT in 2022:| Upper Yellowstone Valley: | $41,774 |
| State: | $60,797 |
Change in median household income between 2000 and 2022:| Upper Yellowstone Valley, Montana: | +108.9% |
| State: | +117.3% |
Number of households with income < $10k:| Upper Yellowstone Valley: | 3.1% (165) |
| State: | 3.1% (455) |
Number of households with income $10k - 20k:| Upper Yellowstone Valley: | 9.5% (506) |
| State: | 9.4% (1,375) |
Number of households with income $20k - 30k:| Upper Yellowstone Valley: | 7.1% (378) |
| State: | 7.3% (1,066) |
Number of households with income $30k - 40k:| Upper Yellowstone Valley: | 7.3% (386) |
| State: | 7.1% (1,032) |
Number of households with income $40k - 50k:| Upper Yellowstone Valley: | 10.6% (562) |
| Montana: | 10.7% (1,557) |
Number of households with income $50k - 60k:| Upper Yellowstone Valley: | 11.4% (606) |
| State: | 11.8% (1,722) |
Number of households with income $60k - 75k:| Upper Yellowstone Valley: | 12.3% (657) |
| State: | 13.1% (1,918) |
Number of households with income $75k - 100k:| Upper Yellowstone Valley: | 12.2% (647) |
| Montana: | 11.3% (1,648) |
Number of households with income $100k - 125k:| Upper Yellowstone Valley: | 6.2% (330) |
| State: | 6.9% (1,011) |
Number of households with income $125k - 150k:| Upper Yellowstone Valley: | 8.0% (424) |
| Montana: | 7.3% (1,064) |
Number of households with income $150k - 200k:| Upper Yellowstone Valley: | 5.4% (286) |
| State: | 5.6% (812) |
Number of households with income > $200k:| Upper Yellowstone Valley: | 7.0% (373) |
| Montana: | 6.5% (951) |
Aggregate household income in Upper Yellowstone Valley in 2022: $11,522,456
Median family income in Upper Yellowstone Valley in 2022:| Upper Yellowstone Valley: | $41,460 |
| State: | $66,328 |
Number of families with income < $10k:| Upper Yellowstone Valley: | 4.5% (7) |
| State: | 4.6% (464) |
Number of families with income $10k - 20k:| Upper Yellowstone Valley: | 6.1% (9) |
| State: | 6.8% (696) |
Number of families with income $20k - 30k:| Upper Yellowstone Valley: | 8.2% (12) |
| Montana: | 7.5% (764) |
Number of families with income $30k - 40k:| Upper Yellowstone Valley: | 2.8% (4) |
| State: | 2.8% (285) |
Number of families with income $40k - 50k:| Upper Yellowstone Valley: | 9.8% (14) |
| State: | 7.6% (777) |
Number of families with income $50k - 60k:| Upper Yellowstone Valley: | 12.0% (17) |
| State: | 12.5% (1,269) |
Number of families with income $60k - 75k:| Upper Yellowstone Valley: | 14.6% (21) |
| Montana: | 16.3% (1,654) |
Number of families with income $75k - 100k:| Upper Yellowstone Valley: | 6.2% (9) |
| State: | 9.2% (938) |
Number of families with income $100k - 125k:| Upper Yellowstone Valley: | 8.8% (13) |
| State: | 10.3% (1,050) |
Number of families with income $125k - 150k:| Upper Yellowstone Valley: | 13.4% (19) |
| State: | 8.3% (842) |
Number of families with income $150k - 200k:| Upper Yellowstone Valley: | 7.7% (11) |
| Montana: | 7.2% (727) |
Number of families with income > $200k:| Upper Yellowstone Valley: | 6.0% (9) |
| State: | 6.9% (698) |
Median non-family income in Upper Yellowstone Valley in 2022:| Upper Yellowstone Valley: | $25,903 |
| State: | $37,718 |
Change in median non-family income between 2000 and 2022:| Upper Yellowstone Valley, Montana: | +82.3% |
| State: | +90.0% |
Median per capita income in Upper Yellowstone Valley in 2022:| Upper Yellowstone Valley: | $21,825 |
| Montana: | $23,068 |
Change in median per capita income between 2000 and 2022:| Upper Yellowstone Valley, Montana: | +112.9% |
| State: | +122.4% |
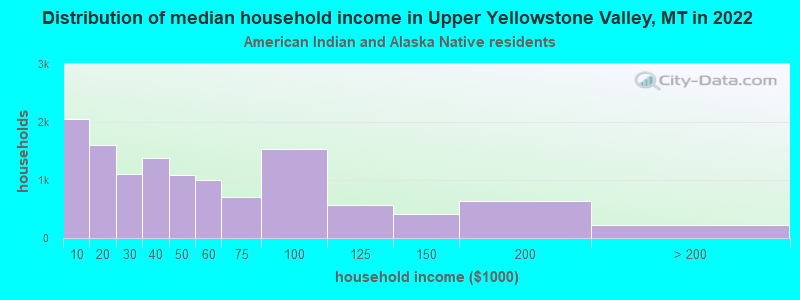
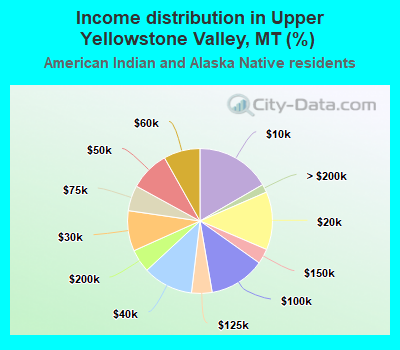
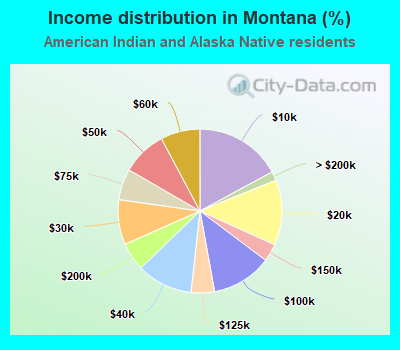
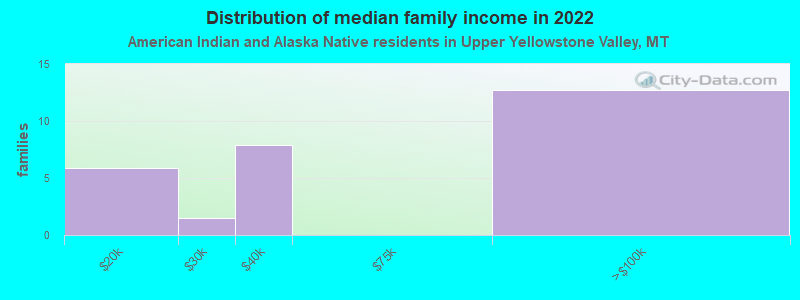
Income statistics for American Indian and Alaska Native residents
Median household income in Upper Yellowstone Valley, MT in 2022:| Upper Yellowstone Valley: | $57,170 |
| State: | $40,063 |
Change in median household income between 2000 and 2022:| Upper Yellowstone Valley, Montana: | +82.9% |
| State: | +77.9% |
Number of households with income < $10k:| Upper Yellowstone Valley: | 16.6% (2,049) |
| State: | 17.1% (3,122) |
Number of households with income $10k - 20k:| Upper Yellowstone Valley: | 13.0% (1,595) |
| Montana: | 12.9% (2,355) |
Number of households with income $20k - 30k:| Upper Yellowstone Valley: | 9.0% (1,111) |
| Montana: | 8.9% (1,620) |
Number of households with income $30k - 40k:| Upper Yellowstone Valley: | 11.2% (1,382) |
| Montana: | 11.0% (2,013) |
Number of households with income $40k - 50k:| Upper Yellowstone Valley: | 8.9% (1,094) |
| State: | 8.8% (1,615) |
Number of households with income $50k - 60k:| Upper Yellowstone Valley: | 8.1% (1,002) |
| Montana: | 7.8% (1,423) |
Number of households with income $60k - 75k:| Upper Yellowstone Valley: | 5.7% (699) |
| State: | 6.1% (1,117) |
Number of households with income $75k - 100k:| Upper Yellowstone Valley: | 12.5% (1,538) |
| Montana: | 11.9% (2,169) |
Number of households with income $100k - 125k:| Upper Yellowstone Valley: | 4.6% (564) |
| Montana: | 4.6% (845) |
Number of households with income $125k - 150k:| Upper Yellowstone Valley: | 3.4% (416) |
| Montana: | 3.5% (637) |
Number of households with income $150k - 200k:| Upper Yellowstone Valley: | 5.1% (634) |
| State: | 5.6% (1,015) |
Number of households with income > $200k:| Upper Yellowstone Valley: | 1.8% (227) |
| Montana: | 1.8% (324) |
Aggregate household income in Upper Yellowstone Valley in 2022: $2,198,527
Median family income in Upper Yellowstone Valley in 2022:| Upper Yellowstone Valley: | $54,584 |
| State: | $41,048 |
Number of families with income $10k - 20k:| Upper Yellowstone Valley: | 21.1% (6) |
| Montana: | 12.8% (1,470) |
Number of families with income $20k - 30k:| Upper Yellowstone Valley: | 5.3% (1) |
| State: | 8.1% (932) |
Number of families with income $30k - 40k:| Upper Yellowstone Valley: | 28.1% (8) |
| Montana: | 17.4% (1,998) |
Number of families with income $75k - 100k:| Upper Yellowstone Valley: | 45.6% (13) |
| Montana: | 10.0% (1,145) |
Median non-family income in Upper Yellowstone Valley in 2022:| Upper Yellowstone Valley: | $22,912 |
| State: | $23,519 |
Change in median non-family income between 2000 and 2022:| Upper Yellowstone Valley, Montana: | +103.7% |
| Montana: | +93.1% |
Median per capita income in Upper Yellowstone Valley in 2022:| Upper Yellowstone Valley: | $28,563 |
| State: | $19,038 |
Change in median per capita income between 2000 and 2022:| Upper Yellowstone Valley, Montana: | +129.4% |
| State: | +114.7% |
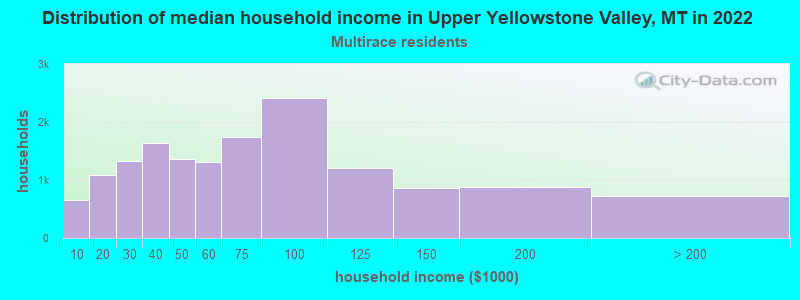
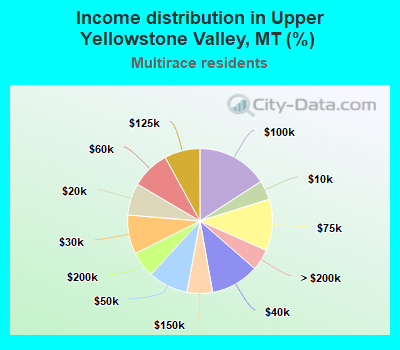
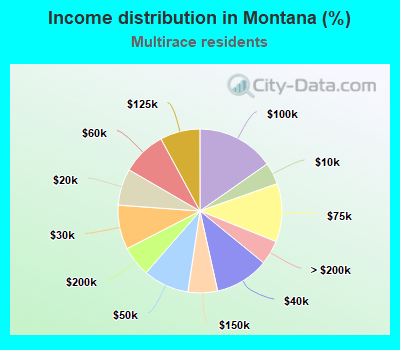
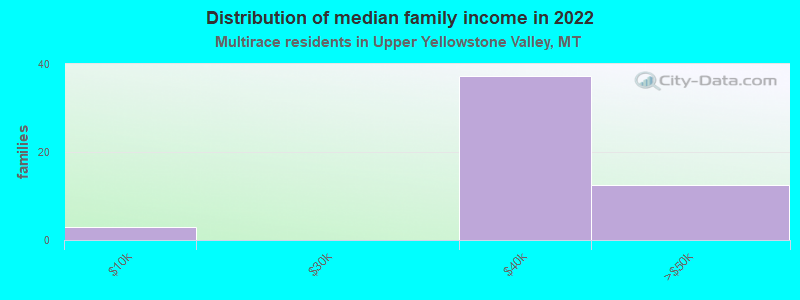
Income statistics for Multirace residents
Median household income in Upper Yellowstone Valley, MT in 2022:| Upper Yellowstone Valley: | $70,140 |
| Montana: | $61,907 |
Change in median household income between 2000 and 2022:| Upper Yellowstone Valley, Montana: | +141.3% |
| State: | +137.5% |
Number of households with income < $10k:| Upper Yellowstone Valley: | 4.3% (657) |
| State: | 4.3% (1,142) |
Number of households with income $10k - 20k:| Upper Yellowstone Valley: | 7.1% (1,084) |
| State: | 7.2% (1,913) |
Number of households with income $20k - 30k:| Upper Yellowstone Valley: | 8.7% (1,329) |
| Montana: | 8.7% (2,315) |
Number of households with income $30k - 40k:| Upper Yellowstone Valley: | 10.8% (1,641) |
| State: | 10.7% (2,822) |
Number of households with income $40k - 50k:| Upper Yellowstone Valley: | 8.9% (1,355) |
| Montana: | 9.0% (2,396) |
Number of households with income $50k - 60k:| Upper Yellowstone Valley: | 8.6% (1,304) |
| State: | 8.7% (2,311) |
Number of households with income $60k - 75k:| Upper Yellowstone Valley: | 11.5% (1,747) |
| State: | 11.5% (3,043) |
Number of households with income $75k - 100k:| Upper Yellowstone Valley: | 15.8% (2,408) |
| Montana: | 15.3% (4,050) |
Number of households with income $100k - 125k:| Upper Yellowstone Valley: | 7.9% (1,208) |
| State: | 7.9% (2,089) |
Number of households with income $125k - 150k:| Upper Yellowstone Valley: | 5.7% (864) |
| State: | 5.8% (1,541) |
Number of households with income $150k - 200k:| Upper Yellowstone Valley: | 5.8% (878) |
| Montana: | 6.0% (1,587) |
Number of households with income > $200k:| Upper Yellowstone Valley: | 4.8% (722) |
| State: | 4.8% (1,271) |
Aggregate household income in Upper Yellowstone Valley in 2022: $14,325,535
Median family income in Upper Yellowstone Valley in 2022:| Upper Yellowstone Valley: | $72,935 |
| Montana: | $70,768 |
Number of families with income < $10k:| Upper Yellowstone Valley: | 5.7% (3) |
| State: | 5.6% (993) |
Number of families with income $30k - 40k:| Upper Yellowstone Valley: | 70.7% (37) |
| State: | 7.0% (1,237) |
Number of families with income $40k - 50k:| Upper Yellowstone Valley: | 23.6% (13) |
| Montana: | 6.0% (1,060) |
Median non-family income in Upper Yellowstone Valley in 2022:| Upper Yellowstone Valley: | $70,691 |
| Montana: | $41,006 |
Median per capita income in Upper Yellowstone Valley in 2022:| Upper Yellowstone Valley: | $29,596 |
| State: | $29,391 |
Income statistics for other residents
Number of households with income < $10k:| Upper Yellowstone Valley: | 6.2% (19) |
| Montana: | 4.0% (142) |
Number of households with income $10k - 20k:| Upper Yellowstone Valley: | 7.2% (22) |
| State: | 8.0% (282) |
Number of households with income $20k - 30k:| Upper Yellowstone Valley: | 8.1% (25) |
| State: | 7.4% (260) |
Number of households with income $30k - 40k:| Upper Yellowstone Valley: | 9.1% (28) |
| State: | 12.9% (455) |
Number of households with income $40k - 50k:| Upper Yellowstone Valley: | 8.5% (26) |
| Montana: | 7.1% (251) |
Number of households with income $50k - 60k:| Upper Yellowstone Valley: | 8.1% (25) |
| State: | 7.4% (262) |
Number of households with income $60k - 75k:| Upper Yellowstone Valley: | 10.7% (33) |
| State: | 7.8% (277) |
Number of households with income $75k - 100k:| Upper Yellowstone Valley: | 14.0% (43) |
| State: | 10.6% (376) |
Number of households with income $100k - 125k:| Upper Yellowstone Valley: | 9.4% (29) |
| Montana: | 10.3% (365) |
Number of households with income $125k - 150k:| Upper Yellowstone Valley: | 6.2% (19) |
| State: | 12.1% (426) |
Number of households with income $150k - 200k:| Upper Yellowstone Valley: | 6.8% (21) |
| State: | 4.5% (159) |
Number of households with income > $200k:| Upper Yellowstone Valley: | 5.5% (17) |
| Montana: | 7.8% (277) |
Aggregate household income in Upper Yellowstone Valley in 2022: $568,489
Median family income in Upper Yellowstone Valley in 2022:| Upper Yellowstone Valley: | $83,886 |
| State: | $89,236 |
Median per capita income in Upper Yellowstone Valley in 2022:| Upper Yellowstone Valley: | $13,094 |
| State: | $23,968 |
Change in median per capita income between 2000 and 2022:| Upper Yellowstone Valley, Montana: | +107.5% |
| State: | +114.9% |