Valleyford, Washington (WA) income map, earnings map, and wages data
The median household income in Valleyford, WA in 2022 was $98,737, which was 7.5% greater than the median annual income of $91,306 across the entire state of Washington. Compared to the median income of $53,333 in 2000 this represents an increase of 46.0%. The per capita income in 2022 was $50,448, which means an increase of 52.0% compared to 2000 when it was $24,215.
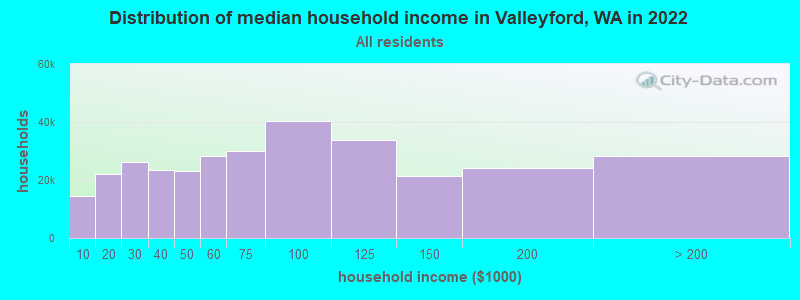
Income statistics for all residents
Median household income in Valleyford, WA in 2022:| Valleyford: | $98,738 |
| State: | $91,306 |
Change in median household income between 2000 and 2022:| Valleyford, Washington: | +85.1% |
| Washington: | +99.5% |
Number of households with income < $10k:| Valleyford: | 4.6% (14,654) |
| Washington: | 4.5% (139,331) |
Number of households with income $10k - 20k:| Valleyford: | 7.0% (22,068) |
| State: | 5.0% (154,508) |
Number of households with income $20k - 30k:| Valleyford: | 8.3% (26,323) |
| State: | 5.4% (166,555) |
Number of households with income $30k - 40k:| Valleyford: | 7.4% (23,429) |
| State: | 5.5% (170,324) |
Number of households with income $40k - 50k:| Valleyford: | 7.3% (23,185) |
| State: | 6.0% (183,941) |
Number of households with income $50k - 60k:| Valleyford: | 9.0% (28,263) |
| State: | 6.1% (187,395) |
Number of households with income $60k - 75k:| Valleyford: | 9.5% (30,113) |
| State: | 8.7% (266,771) |
Number of households with income $75k - 100k:| Valleyford: | 12.8% (40,456) |
| State: | 13.1% (404,672) |
Number of households with income $100k - 125k:| Valleyford: | 10.7% (33,813) |
| Washington: | 11.0% (337,911) |
Number of households with income $125k - 150k:| Valleyford: | 6.7% (21,207) |
| State: | 8.0% (244,934) |
Number of households with income $150k - 200k:| Valleyford: | 7.6% (23,995) |
| State: | 10.5% (323,812) |
Number of households with income > $200k:| Valleyford: | 8.9% (28,249) |
| State: | 16.2% (499,799) |
Aggregate household income in Valleyford in 2022: $530,836,817
Median family income in Valleyford in 2022:| Valleyford: | $120,370 |
| Washington: | $109,192 |
Median non-family income in Valleyford in 2022:| Valleyford: | $51,586 |
| State: | $57,299 |
Change in median non-family income between 2000 and 2022:| Valleyford, Washington: | +89.2% |
| State: | +94.9% |
Median per capita income in Valleyford in 2022:| Valleyford: | $50,448 |
| Washington: | $50,764 |
Change in median per capita income between 2000 and 2022:| Valleyford, Washington: | +108.3% |
| State: | +121.0% |
Income statistics for White residents
Median household income in Valleyford, WA in 2022:| Valleyford: | $102,179 |
| State: | $91,916 |
Change in median household income between 2000 and 2022:| Valleyford, Washington: | +87.9% |
| State: | +95.4% |
Number of households with income < $10k:| Valleyford: | 4.5% (12,377) |
| Washington: | 4.3% (95,850) |
Number of households with income $10k - 20k:| Valleyford: | 6.8% (18,937) |
| Washington: | 4.8% (106,421) |
Number of households with income $20k - 30k:| Valleyford: | 8.1% (22,451) |
| State: | 5.5% (122,860) |
Number of households with income $30k - 40k:| Valleyford: | 7.3% (20,059) |
| State: | 5.4% (119,627) |
Number of households with income $40k - 50k:| Valleyford: | 7.0% (19,368) |
| Washington: | 5.9% (132,276) |
Number of households with income $50k - 60k:| Valleyford: | 8.6% (23,819) |
| State: | 6.1% (136,212) |
Number of households with income $60k - 75k:| Valleyford: | 9.8% (27,144) |
| Washington: | 8.8% (196,086) |
Number of households with income $75k - 100k:| Valleyford: | 12.9% (35,637) |
| State: | 13.4% (299,192) |
Number of households with income $100k - 125k:| Valleyford: | 10.8% (29,868) |
| State: | 11.3% (252,209) |
Number of households with income $125k - 150k:| Valleyford: | 6.6% (18,233) |
| Washington: | 7.9% (175,962) |
Number of households with income $150k - 200k:| Valleyford: | 7.9% (21,982) |
| State: | 10.7% (239,156) |
Number of households with income > $200k:| Valleyford: | 9.7% (26,735) |
| State: | 16.1% (359,917) |
Aggregate household income in Valleyford in 2022: $465,463,709
Median family income in Valleyford in 2022:| Valleyford: | $122,508 |
| State: | $112,511 |
Number of families with income $10k - 20k:| Valleyford: | 0.6% (6) |
| State: | 2.0% (28,228) |
Number of families with income $20k - 30k:| Valleyford: | 1.7% (17) |
| Washington: | 2.9% (39,288) |
Number of families with income $30k - 40k:| Valleyford: | 2.6% (26) |
| Washington: | 3.6% (50,190) |
Number of families with income $40k - 50k:| Valleyford: | 4.6% (46) |
| State: | 4.6% (63,009) |
Number of families with income $50k - 60k:| Valleyford: | 7.1% (71) |
| State: | 5.0% (69,270) |
Number of families with income $60k - 75k:| Valleyford: | 8.7% (87) |
| Washington: | 8.2% (112,369) |
Number of families with income $75k - 100k:| Valleyford: | 14.8% (148) |
| State: | 14.1% (194,214) |
Number of families with income $100k - 125k:| Valleyford: | 13.6% (136) |
| State: | 13.2% (182,184) |
Number of families with income $125k - 150k:| Valleyford: | 32.2% (323) |
| State: | 9.5% (130,928) |
Number of families with income $150k - 200k:| Valleyford: | 10.2% (102) |
| State: | 13.7% (188,621) |
Number of families with income > $200k:| Valleyford: | 3.8% (38) |
| Washington: | 20.8% (285,982) |
Median non-family income in Valleyford in 2022:| Valleyford: | $49,459 |
| State: | $56,103 |
Change in median non-family income between 2000 and 2022:| Valleyford, Washington: | +85.1% |
| State: | +87.7% |
Median per capita income in Valleyford in 2022:| Valleyford: | $52,178 |
| Washington: | $55,212 |
Change in median per capita income between 2000 and 2022:| Valleyford, Washington: | +114.9% |
| State: | +123.8% |
Income statistics for Hispanic or Latino residents
Number of households with income < $10k:| Valleyford: | 5.4% (589) |
| State: | 4.9% (14,456) |
Number of households with income $10k - 20k:| Valleyford: | 5.2% (573) |
| State: | 5.3% (15,449) |
Number of households with income $20k - 30k:| Valleyford: | 7.2% (784) |
| State: | 6.8% (20,016) |
Number of households with income $30k - 40k:| Valleyford: | 10.4% (1,141) |
| Washington: | 7.7% (22,548) |
Number of households with income $40k - 50k:| Valleyford: | 7.0% (770) |
| Washington: | 7.3% (21,450) |
Number of households with income $50k - 60k:| Valleyford: | 9.1% (993) |
| State: | 7.7% (22,744) |
Number of households with income $60k - 75k:| Valleyford: | 5.7% (627) |
| Washington: | 10.5% (30,737) |
Number of households with income $75k - 100k:| Valleyford: | 15.3% (1,677) |
| State: | 14.9% (43,843) |
Number of households with income $100k - 125k:| Valleyford: | 15.5% (1,699) |
| State: | 11.1% (32,554) |
Number of households with income $125k - 150k:| Valleyford: | 6.6% (722) |
| State: | 7.4% (21,624) |
Number of households with income $150k - 200k:| Valleyford: | 7.2% (785) |
| State: | 7.3% (21,360) |
Number of households with income > $200k:| Valleyford: | 5.4% (586) |
| State: | 9.2% (27,055) |
Median per capita income in Valleyford in 2022:| Valleyford: | $28,698 |
| State: | $28,252 |
Change in median per capita income between 2000 and 2022:| Valleyford, Washington: | +127.3% |
| Washington: | +150.2% |
Income statistics for American Indian and Alaska Native residents
Median household income in Valleyford, WA in 2022:| Valleyford: | $84,122 |
| State: | $71,255 |
Change in median household income between 2000 and 2022:| Valleyford, Washington: | +125.6% |
| Washington: | +118.1% |
Number of households with income < $10k:| Valleyford: | 5.9% (1,013) |
| Washington: | 5.9% (1,768) |
Number of households with income $10k - 20k:| Valleyford: | 9.0% (1,547) |
| Washington: | 8.9% (2,694) |
Number of households with income $20k - 30k:| Valleyford: | 8.0% (1,368) |
| Washington: | 8.0% (2,412) |
Number of households with income $30k - 40k:| Valleyford: | 7.7% (1,326) |
| Washington: | 7.7% (2,327) |
Number of households with income $40k - 50k:| Valleyford: | 5.9% (1,013) |
| Washington: | 5.8% (1,755) |
Number of households with income $50k - 60k:| Valleyford: | 7.5% (1,289) |
| Washington: | 7.5% (2,259) |
Number of households with income $60k - 75k:| Valleyford: | 8.8% (1,520) |
| State: | 8.8% (2,669) |
Number of households with income $75k - 100k:| Valleyford: | 12.7% (2,191) |
| State: | 12.8% (3,861) |
Number of households with income $100k - 125k:| Valleyford: | 12.0% (2,068) |
| State: | 12.0% (3,618) |
Number of households with income $125k - 150k:| Valleyford: | 8.6% (1,477) |
| Washington: | 8.6% (2,580) |
Number of households with income $150k - 200k:| Valleyford: | 5.9% (1,010) |
| State: | 5.9% (1,774) |
Number of households with income > $200k:| Valleyford: | 8.0% (1,383) |
| State: | 8.1% (2,447) |
Aggregate household income in Valleyford in 2022: $2,008,897
Median family income in Valleyford in 2022:| Valleyford: | $121,857 |
| State: | $79,010 |
Number of families with income $30k - 40k:| Valleyford: | 3.8% (3) |
| State: | 5.9% (1,190) |
Number of families with income $150k - 200k:| Valleyford: | 96.2% (70) |
| State: | 7.8% (1,584) |
Median per capita income in Valleyford in 2022:| Valleyford: | $45,005 |
| Washington: | $27,053 |
Change in median per capita income between 2000 and 2022:| Valleyford, Washington: | +97.1% |
| State: | +98.6% |
Income statistics for Multirace residents
Median household income in Valleyford, WA in 2022:| Valleyford: | $97,865 |
| Washington: | $84,303 |
Change in median household income between 2000 and 2022:| Valleyford, Washington: | +123.7% |
| State: | +125.7% |
Number of households with income < $10k:| Valleyford: | 7.6% (1,699) |
| State: | 4.3% (12,040) |
Number of households with income $10k - 20k:| Valleyford: | 7.2% (1,614) |
| State: | 6.6% (18,437) |
Number of households with income $20k - 30k:| Valleyford: | 6.4% (1,434) |
| Washington: | 5.2% (14,559) |
Number of households with income $30k - 40k:| Valleyford: | 9.7% (2,173) |
| State: | 6.7% (18,491) |
Number of households with income $40k - 50k:| Valleyford: | 10.9% (2,449) |
| State: | 6.3% (17,459) |
Number of households with income $50k - 60k:| Valleyford: | 10.9% (2,449) |
| State: | 6.9% (19,086) |
Number of households with income $60k - 75k:| Valleyford: | 5.6% (1,251) |
| Washington: | 9.1% (25,310) |
Number of households with income $75k - 100k:| Valleyford: | 10.8% (2,423) |
| State: | 13.5% (37,493) |
Number of households with income $100k - 125k:| Valleyford: | 10.5% (2,356) |
| State: | 10.7% (29,626) |
Number of households with income $125k - 150k:| Valleyford: | 9.2% (2,069) |
| Washington: | 8.6% (23,899) |
Number of households with income $150k - 200k:| Valleyford: | 6.6% (1,472) |
| State: | 10.2% (28,214) |
Number of households with income > $200k:| Valleyford: | 4.5% (1,005) |
| State: | 11.9% (32,947) |
Aggregate household income in Valleyford in 2022: $3,408,920
Median non-family income in Valleyford in 2022:| Valleyford: | $109,941 |
| State: | $56,573 |
Median per capita income in Valleyford in 2022:| Valleyford: | $39,865 |
| State: | $32,496 |
Change in median per capita income between 2000 and 2022:| Valleyford, Washington: | +128.6% |
| Washington: | +156.8% |
Income statistics for other residents
Number of households with income < $10k:| Valleyford: | 5.2% (7,914) |
| State: | 5.3% (6,540) |
Number of households with income $10k - 20k:| Valleyford: | 6.0% (9,126) |
| Washington: | 6.0% (7,385) |
Number of households with income $20k - 30k:| Valleyford: | 7.6% (11,522) |
| State: | 7.5% (9,289) |
Number of households with income $30k - 40k:| Valleyford: | 9.0% (13,612) |
| State: | 8.9% (11,015) |
Number of households with income $40k - 50k:| Valleyford: | 7.7% (11,616) |
| Washington: | 7.6% (9,399) |
Number of households with income $50k - 60k:| Valleyford: | 7.2% (10,939) |
| Washington: | 7.2% (8,867) |
Number of households with income $60k - 75k:| Valleyford: | 10.5% (15,913) |
| State: | 10.5% (13,032) |
Number of households with income $75k - 100k:| Valleyford: | 14.5% (21,972) |
| Washington: | 14.6% (18,007) |
Number of households with income $100k - 125k:| Valleyford: | 12.2% (18,566) |
| State: | 12.2% (15,128) |
Number of households with income $125k - 150k:| Valleyford: | 5.6% (8,490) |
| State: | 5.6% (6,950) |
Number of households with income $150k - 200k:| Valleyford: | 7.0% (10,653) |
| State: | 7.1% (8,749) |
Number of households with income > $200k:| Valleyford: | 7.4% (11,243) |
| State: | 7.5% (9,208) |
Median per capita income in Valleyford in 2022:| Valleyford: | $67,769 |
| State: | $27,542 |