The median household income in Villa Rica, GA in 2022 was $89,391, which was 18.5% greater than the median annual income of $72,837 across the entire state of Georgia. Compared to the median income of $31,161 in 2000 this represents an increase of 65.1%. The per capita income in 2022 was $33,375, which means an increase of 57.1% compared to 2000 when it was $14,310.
Whole page based on the data from 2000 / 2022 when the population of Villa Rica, Georgia was 4,134 / 18,009
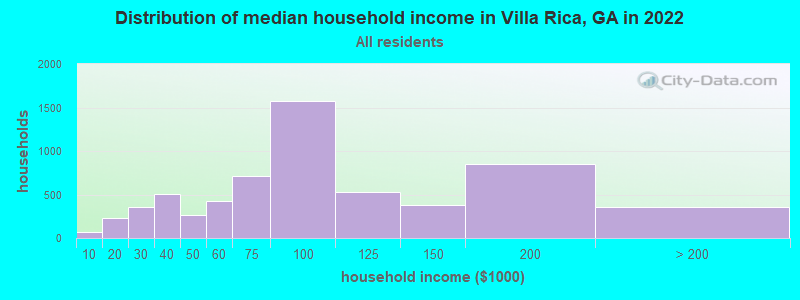
Income statistics for all residents
Median household income in Villa Rica, GA in 2022:
Villa Rica:
$89,392
State:
$72,837
Number of households with income < $10k:
Villa Rica:
1.0% (65)
State:
5.6% (229,257)
Number of households with income $10k - 20k:
Villa Rica:
3.7% (231)
State:
7.0% (285,929)
Number of households with income $20k - 30k:
Villa Rica:
5.7% (360)
State:
7.1% (290,416)
Number of households with income $30k - 40k:
Villa Rica:
8.2% (511)
State:
7.4% (304,514)
Number of households with income $40k - 50k:
Villa Rica:
4.3% (270)
State:
7.5% (306,115)
Number of households with income $50k - 60k:
Villa Rica:
6.8% (426)
State:
7.0% (287,636)
Number of households with income $60k - 75k:
Villa Rica:
11.4% (711)
Georgia:
9.8% (399,796)
Number of households with income $75k - 100k:
Villa Rica:
25.1% (1,573)
State:
13.3% (545,843)
Number of households with income $100k - 125k:
Villa Rica:
8.4% (529)
State:
9.9% (404,546)
Number of households with income $125k - 150k:
Villa Rica:
6.1% (381)
State:
7.0% (286,306)
Number of households with income $150k - 200k:
Villa Rica:
13.6% (852)
State:
8.2% (335,507)
Number of households with income > $200k:
Villa Rica:
5.6% (353)
State:
10.2% (416,602)
Aggregate household income in Villa Rica in 2022: $594,130,524
Median family income in Villa Rica in 2022:
Villa Rica:
$89,797
State:
$86,642
Number of families with income < $10k:
Villa Rica:
0.7% (31)
State:
3.8% (103,600)
Number of families with income $10k - 20k:
Villa Rica:
1.0% (45)
State:
3.8% (103,872)
Number of families with income $20k - 30k:
Villa Rica:
5.7% (270)
Georgia:
5.4% (148,363)
Number of families with income $30k - 40k:
Villa Rica:
5.0% (236)
State:
6.4% (174,443)
Number of families with income $40k - 50k:
Villa Rica:
7.1% (336)
State:
6.8% (186,605)
Number of families with income $50k - 60k:
Villa Rica:
8.3% (392)
Georgia:
6.7% (184,297)
Number of families with income $60k - 75k:
Villa Rica:
11.8% (554)
Georgia:
9.8% (268,515)
Number of families with income $75k - 100k:
Villa Rica:
26.0% (1,224)
State:
14.3% (392,121)
Number of families with income $100k - 125k:
Villa Rica:
7.4% (351)
State:
11.3% (307,809)
Number of families with income $125k - 150k:
Villa Rica:
7.3% (345)
State:
8.1% (222,593)
Number of families with income $150k - 200k:
Villa Rica:
12.8% (604)
Georgia:
10.1% (276,126)
Number of families with income > $200k:
Villa Rica:
6.8% (321)
State:
13.4% (364,890)
Median non-family income in Villa Rica in 2022:
Villa Rica:
$49,051
Georgia:
$44,656
Median per capita income in Villa Rica in 2022:
Villa Rica:
$33,376
State:
$38,378
Change in median per capita income between 2000 and 2022:
Villa Rica, Georgia:
+133.2%
State:
+81.4%
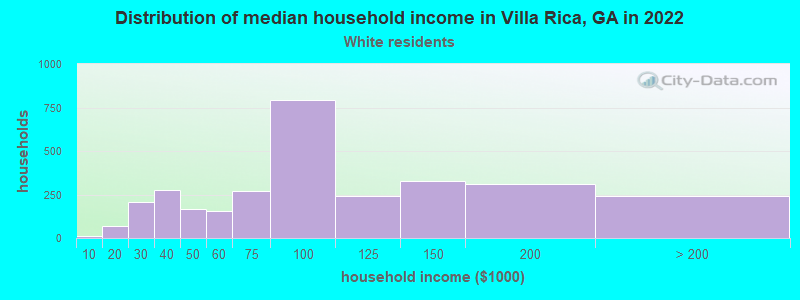
Income statistics for White residents
Median household income in Villa Rica, GA in 2022:
Villa Rica:
$93,752
State:
$82,397
Number of households with income < $10k:
Villa Rica:
0.5% (14)
State:
4.1% (92,223)
Number of households with income $10k - 20k:
Villa Rica:
2.3% (70)
Georgia:
5.7% (129,017)
Number of households with income $20k - 30k:
Villa Rica:
6.7% (207)
State:
6.2% (140,832)
Number of households with income $30k - 40k:
Villa Rica:
9.0% (278)
State:
6.4% (144,887)
Number of households with income $40k - 50k:
Villa Rica:
5.4% (166)
Georgia:
7.0% (157,922)
Number of households with income $50k - 60k:
Villa Rica:
5.1% (158)
State:
6.8% (153,079)
Number of households with income $60k - 75k:
Villa Rica:
8.8% (272)
State:
9.4% (211,282)
Number of households with income $75k - 100k:
Villa Rica:
25.8% (794)
Georgia:
13.6% (306,007)
Number of households with income $100k - 125k:
Villa Rica:
7.8% (241)
State:
10.5% (236,501)
Number of households with income $125k - 150k:
Villa Rica:
10.6% (325)
Georgia:
7.9% (178,986)
Number of households with income $150k - 200k:
Villa Rica:
10.1% (311)
Georgia:
9.6% (216,095)
Number of households with income > $200k:
Villa Rica:
7.9% (244)
Georgia:
12.7% (286,989)
Aggregate household income in Villa Rica in 2022: $311,331,968
Median family income in Villa Rica in 2022:
Villa Rica:
$93,157
Georgia:
$99,049
Number of families with income $10k - 20k:
Villa Rica:
0.6% (14)
State:
2.8% (42,787)
Number of families with income $20k - 30k:
Villa Rica:
6.1% (131)
Georgia:
4.0% (60,599)
Number of families with income $30k - 40k:
Villa Rica:
5.1% (111)
Georgia:
5.1% (78,242)
Number of families with income $40k - 50k:
Villa Rica:
5.9% (127)
State:
6.2% (94,652)
Number of families with income $50k - 60k:
Villa Rica:
6.0% (131)
State:
6.2% (95,179)
Number of families with income $60k - 75k:
Villa Rica:
9.3% (201)
State:
9.2% (141,002)
Number of families with income $75k - 100k:
Villa Rica:
23.0% (499)
State:
14.7% (224,392)
Number of families with income $100k - 125k:
Villa Rica:
9.0% (195)
Georgia:
11.9% (181,130)
Number of families with income $125k - 150k:
Villa Rica:
14.0% (303)
State:
9.3% (141,570)
Number of families with income $150k - 200k:
Villa Rica:
10.7% (231)
State:
11.8% (180,140)
Number of families with income > $200k:
Villa Rica:
10.3% (224)
State:
16.5% (251,188)
Median non-family income in Villa Rica in 2022:
Villa Rica:
$54,004
State:
$48,516
Median per capita income in Villa Rica in 2022:
Villa Rica:
$38,327
State:
$45,764
Change in median per capita income between 2000 and 2022:
Villa Rica, Georgia:
+145.1%
State:
+85.1%
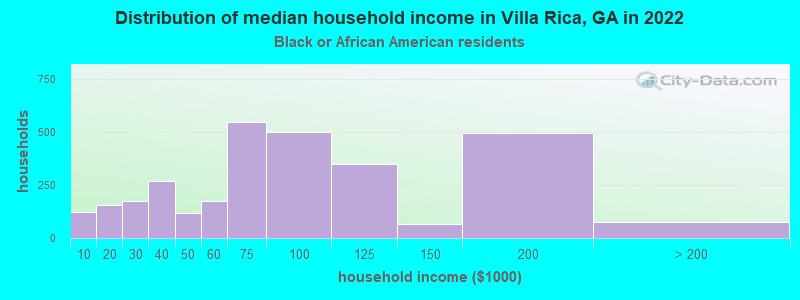
Income statistics for Black or African American residents
Median household income in Villa Rica, GA in 2022:
Villa Rica:
$101,802
Georgia:
$57,293
Number of households with income < $10k:
Villa Rica:
4.1% (124)
Georgia:
8.2% (104,281)
Number of households with income $10k - 20k:
Villa Rica:
5.1% (156)
Georgia:
9.9% (125,572)
Number of households with income $20k - 30k:
Villa Rica:
5.7% (174)
State:
8.7% (109,854)
Number of households with income $30k - 40k:
Villa Rica:
8.8% (268)
State:
9.3% (117,673)
Number of households with income $40k - 50k:
Villa Rica:
3.8% (117)
State:
8.6% (109,631)
Number of households with income $50k - 60k:
Villa Rica:
5.7% (175)
Georgia:
7.1% (89,835)
Number of households with income $60k - 75k:
Villa Rica:
18.0% (547)
Georgia:
10.6% (133,810)
Number of households with income $75k - 100k:
Villa Rica:
16.5% (502)
State:
12.8% (162,675)
Number of households with income $100k - 125k:
Villa Rica:
11.4% (348)
State:
8.5% (108,361)
Number of households with income $125k - 150k:
Villa Rica:
2.2% (67)
State:
5.4% (69,094)
Number of households with income $150k - 200k:
Villa Rica:
16.2% (494)
State:
5.6% (71,287)
Number of households with income > $200k:
Villa Rica:
2.5% (75)
State:
5.2% (66,089)
Aggregate household income in Villa Rica in 2022: $225,991,313
Median family income in Villa Rica in 2022:
Villa Rica:
$95,707
Georgia:
$68,633
Number of families with income < $10k:
Villa Rica:
3.2% (64)
Georgia:
6.6% (51,835)
Number of families with income $10k - 20k:
Villa Rica:
2.4% (47)
State:
5.7% (45,319)
Number of families with income $20k - 30k:
Villa Rica:
7.8% (155)
Georgia:
7.6% (59,822)
Number of families with income $30k - 40k:
Villa Rica:
3.7% (74)
State:
8.2% (64,344)
Number of families with income $40k - 50k:
Villa Rica:
14.2% (284)
State:
8.4% (66,235)
Number of families with income $50k - 60k:
Villa Rica:
5.5% (109)
State:
7.3% (57,291)
Number of families with income $60k - 75k:
Villa Rica:
14.6% (290)
Georgia:
10.9% (85,758)
Number of families with income $75k - 100k:
Villa Rica:
16.4% (326)
State:
13.8% (108,499)
Number of families with income $100k - 125k:
Villa Rica:
6.8% (136)
Georgia:
10.4% (81,983)
Number of families with income $125k - 150k:
Villa Rica:
3.5% (69)
Georgia:
6.6% (51,839)
Number of families with income $150k - 200k:
Villa Rica:
15.7% (313)
Georgia:
7.3% (57,526)
Number of families with income > $200k:
Villa Rica:
6.3% (125)
State:
7.3% (57,738)
Median non-family income in Villa Rica in 2022:
Villa Rica:
$53,057
State:
$37,692
Change in median non-family income between 2000 and 2022:
Villa Rica, Georgia:
+149.7%
State:
+80.0%
Median per capita income in Villa Rica in 2022:
Villa Rica:
$32,411
State:
$29,935
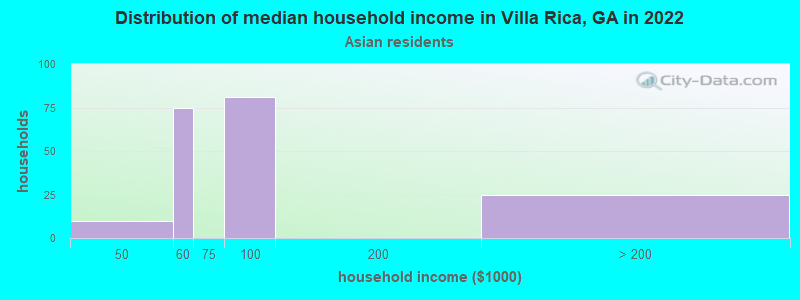
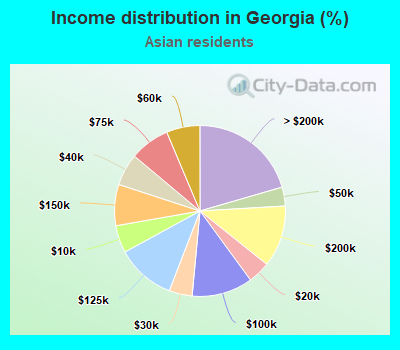
Income statistics for Asian residents
Median household income in Villa Rica, GA in 2022:
Villa Rica:
$142,085
State:
$102,973
Number of households with income < $10k:
Villa Rica:
0.0% (0)
State:
5.2% (8,565)
Number of households with income $10k - 20k:
Villa Rica:
0.0% (0)
State:
4.2% (6,959)
Number of households with income $20k - 30k:
Villa Rica:
0.0% (0)
State:
4.4% (7,214)
Number of households with income $30k - 40k:
Villa Rica:
0.0% (0)
Georgia:
6.1% (10,007)
Number of households with income $40k - 50k:
Villa Rica:
5.2% (10)
Georgia:
3.6% (5,876)
Number of households with income $50k - 60k:
Villa Rica:
39.3% (75)
Georgia:
6.3% (10,440)
Number of households with income $60k - 75k:
Villa Rica:
0.0% (0)
State:
7.6% (12,457)
Number of households with income $75k - 100k:
Villa Rica:
42.4% (81)
State:
11.5% (18,974)
Number of households with income $100k - 125k:
Villa Rica:
0.0% (0)
State:
11.2% (18,431)
Number of households with income $125k - 150k:
Villa Rica:
0.0% (0)
State:
7.8% (12,835)
Number of households with income $150k - 200k:
Villa Rica:
0.0% (0)
Georgia:
11.7% (19,219)
Number of households with income > $200k:
Villa Rica:
13.1% (25)
State:
20.5% (33,791)
Aggregate household income in Villa Rica in 2022: $20,936,769
Median family income in Villa Rica in 2022:
Villa Rica:
$137,126
State:
$114,577
Number of families with income $40k - 50k:
Villa Rica:
2.6% (4)
Georgia:
3.5% (4,488)
Number of families with income $50k - 60k:
Villa Rica:
36.0% (61)
State:
6.4% (8,038)
Number of families with income $75k - 100k:
Villa Rica:
46.3% (78)
State:
10.9% (13,747)
Number of families with income > $200k:
Villa Rica:
15.1% (26)
Georgia:
24.6% (31,134)
Median non-family income in Villa Rica in 2022:
Villa Rica:
$55,459
Georgia:
$56,078
Median per capita income in Villa Rica in 2022:
Villa Rica:
$36,888
State:
$47,657
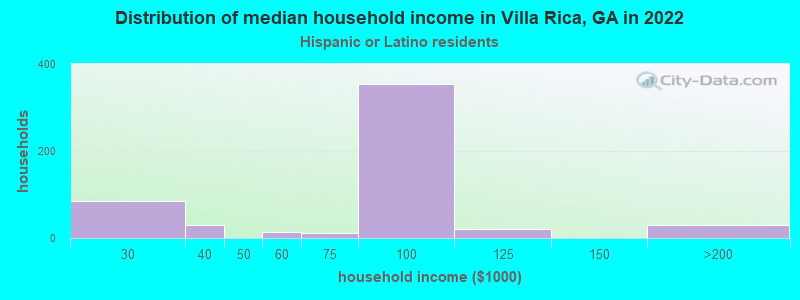
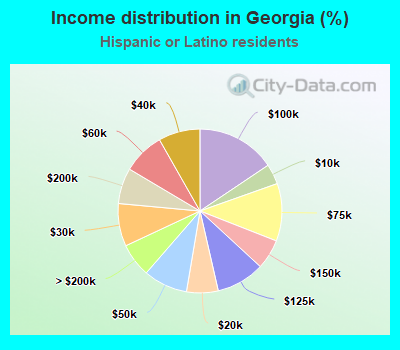
Income statistics for Hispanic or Latino residents
Median household income in Villa Rica, GA in 2022:
Villa Rica:
$93,263
Georgia:
$67,547
Change in median household income between 2000 and 2022:
Villa Rica, Georgia:
+64.5%
State:
+73.0%
Number of households with income < $10k:
Villa Rica:
0.0% (0)
Georgia:
4.0% (12,188)
Number of households with income $10k - 20k:
Villa Rica:
0.2% (1)
Georgia:
6.2% (19,063)
Number of households with income $20k - 30k:
Villa Rica:
15.5% (84)
Georgia:
8.4% (25,797)
Number of households with income $30k - 40k:
Villa Rica:
5.7% (31)
State:
8.2% (25,127)
Number of households with income $40k - 50k:
Villa Rica:
0.0% (0)
State:
8.7% (26,632)
Number of households with income $50k - 60k:
Villa Rica:
2.4% (13)
State:
8.2% (25,168)
Number of households with income $60k - 75k:
Villa Rica:
2.0% (11)
Georgia:
11.4% (34,734)
Number of households with income $75k - 100k:
Villa Rica:
65.1% (353)
State:
15.6% (47,647)
Number of households with income $100k - 125k:
Villa Rica:
3.7% (20)
Georgia:
9.6% (29,177)
Number of households with income $125k - 150k:
Villa Rica:
0.0% (0)
State:
5.9% (18,075)
Number of households with income $150k - 200k:
Villa Rica:
5.4% (29)
Georgia:
7.1% (21,562)
Number of households with income > $200k:
Villa Rica:
0.0% (0)
Georgia:
6.7% (20,315)
Aggregate household income in Villa Rica in 2022: $40,694,835
Median family income in Villa Rica in 2022:
Villa Rica:
$89,947
State:
$68,723
Number of families with income $10k - 20k:
Villa Rica:
0.2% (1)
State:
5.4% (12,876)
Number of families with income $20k - 30k:
Villa Rica:
15.6% (80)
Georgia:
8.3% (19,945)
Number of families with income $50k - 60k:
Villa Rica:
14.1% (72)
Georgia:
8.2% (19,635)
Number of families with income $60k - 75k:
Villa Rica:
2.3% (12)
Georgia:
11.5% (27,479)
Number of families with income $75k - 100k:
Villa Rica:
58.0% (298)
State:
16.1% (38,405)
Number of families with income $100k - 125k:
Villa Rica:
4.1% (21)
State:
9.2% (21,972)
Number of families with income $150k - 200k:
Villa Rica:
5.8% (30)
State:
7.7% (18,324)
Median per capita income in Villa Rica in 2022:
Villa Rica:
$17,544
State:
$25,080
Change in median per capita income between 2000 and 2022:
Villa Rica, Georgia:
+33.4%
Georgia:
+99.4%
Income statistics for American Indian and Alaska Native residents
Median per capita income in Villa Rica in 2022:
Villa Rica:
$22,228
Georgia:
$21,409
Change in median per capita income between 2000 and 2022:
Villa Rica, Georgia:
+109.4%
State:
+23.5%
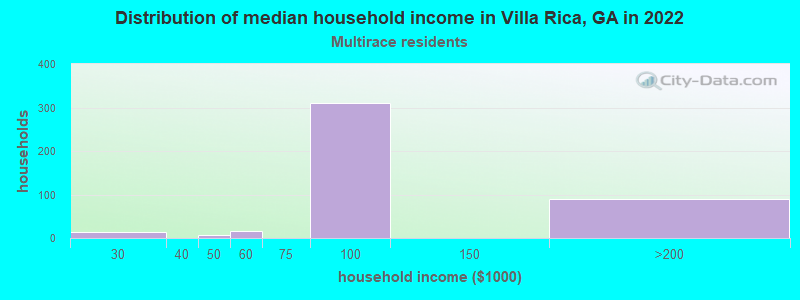
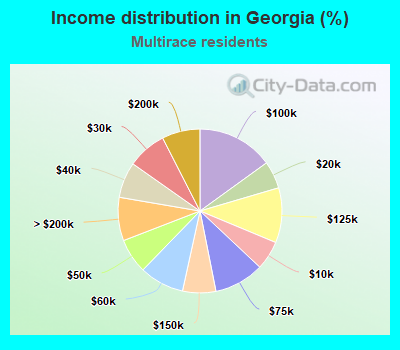
Income statistics for Multirace residents
Median household income in Villa Rica, GA in 2022:
Villa Rica:
$66,012
State:
$72,520
Number of households with income < $10k:
Villa Rica:
0.0% (0)
Georgia:
5.7% (14,963)
Number of households with income $10k - 20k:
Villa Rica:
0.0% (0)
State:
5.4% (14,136)
Number of households with income $20k - 30k:
Villa Rica:
3.0% (13)
State:
7.7% (20,123)
Number of households with income $30k - 40k:
Villa Rica:
0.0% (0)
State:
7.1% (18,449)
Number of households with income $40k - 50k:
Villa Rica:
1.8% (8)
Georgia:
6.9% (17,943)
Number of households with income $50k - 60k:
Villa Rica:
3.9% (17)
State:
8.8% (22,996)
Number of households with income $60k - 75k:
Villa Rica:
0.2% (1)
State:
9.9% (25,722)
Number of households with income $75k - 100k:
Villa Rica:
70.8% (310)
State:
15.0% (39,219)
Number of households with income $100k - 125k:
Villa Rica:
0.0% (0)
State:
10.8% (28,252)
Number of households with income $125k - 150k:
Villa Rica:
0.0% (0)
State:
6.6% (17,124)
Number of households with income $150k - 200k:
Villa Rica:
20.3% (89)
State:
7.5% (19,615)
Number of households with income > $200k:
Villa Rica:
0.0% (0)
State:
8.6% (22,328)
Aggregate household income in Villa Rica in 2022: $24,895,645
Median family income in Villa Rica in 2022:
Villa Rica:
$55,772
State:
$79,509
Number of families with income $20k - 30k:
Villa Rica:
2.8% (13)
State:
6.7% (12,255)
Number of families with income $40k - 50k:
Villa Rica:
1.8% (8)
State:
5.9% (10,824)
Number of families with income $50k - 60k:
Villa Rica:
6.7% (31)
State:
8.8% (16,089)
Number of families with income $60k - 75k:
Villa Rica:
0.3% (2)
State:
9.9% (18,163)
Number of families with income $75k - 100k:
Villa Rica:
71.7% (332)
Georgia:
16.0% (29,226)
Number of families with income $150k - 200k:
Villa Rica:
16.6% (77)
State:
8.2% (14,965)
Median per capita income in Villa Rica in 2022:
Villa Rica:
$35,225
State:
$28,402
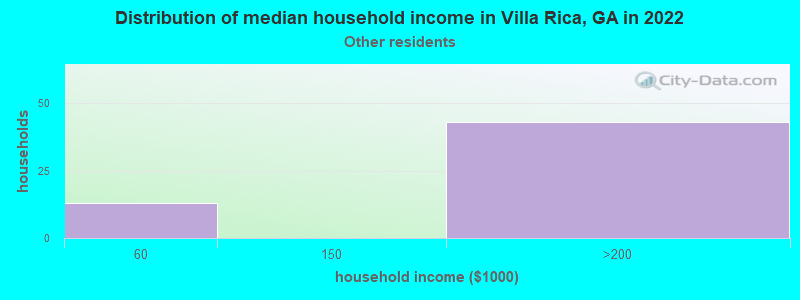
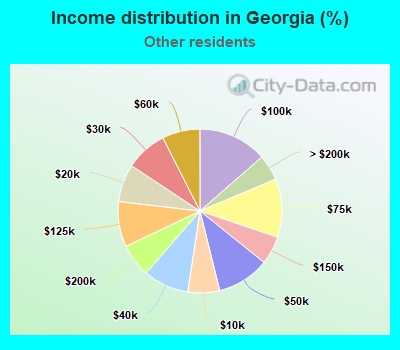
Income statistics for other residents
Number of households with income < $10k:
Villa Rica:
0.0% (0)
Georgia:
6.3% (7,985)
Number of households with income $10k - 20k:
Villa Rica:
0.0% (0)
State:
7.4% (9,485)
Number of households with income $20k - 30k:
Villa Rica:
0.0% (0)
State:
8.2% (10,477)
Number of households with income $30k - 40k:
Villa Rica:
0.0% (0)
State:
9.0% (11,439)
Number of households with income $40k - 50k:
Villa Rica:
0.0% (0)
Georgia:
10.3% (13,166)
Number of households with income $50k - 60k:
Villa Rica:
23.2% (13)
State:
7.5% (9,494)
Number of households with income $60k - 75k:
Villa Rica:
0.0% (0)
Georgia:
11.5% (14,661)
Number of households with income $75k - 100k:
Villa Rica:
0.0% (0)
Georgia:
13.6% (17,309)
Number of households with income $100k - 125k:
Villa Rica:
0.0% (0)
Georgia:
9.0% (11,418)
Number of households with income $125k - 150k:
Villa Rica:
0.0% (0)
State:
5.6% (7,128)
Number of households with income $150k - 200k:
Villa Rica:
76.8% (43)
State:
6.5% (8,311)
Number of households with income > $200k:
Villa Rica:
0.0% (0)
Georgia:
5.1% (6,490)
Aggregate household income in Villa Rica in 2022: $4,581,120
Median per capita income in Villa Rica in 2022:
Villa Rica:
$30,130
State:
$23,261
Change in median per capita income between 2000 and 2022:
Villa Rica, Georgia:
+111.3%
State:
+110.6%
Discuss Villa Rica, Georgia (GA) on our hugely popular Georgia forum.