Warren, Connecticut (CT) income map, earnings map, and wages data
The median household income in Warren, CT in 2022 was $106,262, which was 16.8% greater than the median annual income of $88,429 across the entire state of Connecticut. Compared to the median income of $62,798 in 2000 this represents an increase of 40.9%. The per capita income in 2022 was $67,319, which means an increase of 45.3% compared to 2000 when it was $36,801.
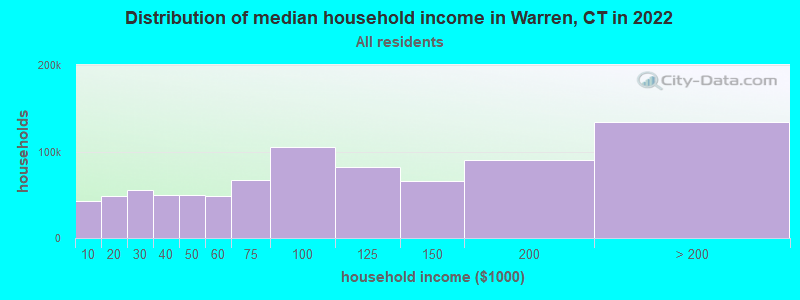
Income statistics for all residents
Median household income in Warren, CT in 2022:| Warren: | $106,263 |
| Connecticut: | $88,429 |
Change in median household income between 2000 and 2022:| Warren, Connecticut: | +69.2% |
| Connecticut: | +64.0% |
Number of households with income < $10k:| Warren: | 5.2% (43,283) |
| Connecticut: | 5.1% (72,746) |
Number of households with income $10k - 20k:| Warren: | 5.8% (48,808) |
| Connecticut: | 5.7% (81,643) |
Number of households with income $20k - 30k:| Warren: | 6.6% (55,246) |
| Connecticut: | 6.5% (92,844) |
Number of households with income $30k - 40k:| Warren: | 5.9% (49,579) |
| State: | 5.9% (83,934) |
Number of households with income $40k - 50k:| Warren: | 5.9% (49,261) |
| State: | 5.8% (83,025) |
Number of households with income $50k - 60k:| Warren: | 5.8% (48,304) |
| State: | 5.7% (81,788) |
Number of households with income $60k - 75k:| Warren: | 8.1% (67,680) |
| Connecticut: | 8.1% (115,651) |
Number of households with income $75k - 100k:| Warren: | 12.6% (105,701) |
| State: | 12.6% (180,173) |
Number of households with income $100k - 125k:| Warren: | 9.8% (82,287) |
| State: | 9.9% (141,231) |
Number of households with income $125k - 150k:| Warren: | 7.8% (65,714) |
| Connecticut: | 7.9% (112,826) |
Number of households with income $150k - 200k:| Warren: | 10.7% (89,892) |
| Connecticut: | 10.8% (154,641) |
Number of households with income > $200k:| Warren: | 16.0% (134,293) |
| State: | 16.3% (233,133) |
Aggregate household income in Warren in 2022: $1,974,778,902
Median family income in Warren in 2022:| Warren: | $118,881 |
| Connecticut: | $115,183 |
Median non-family income in Warren in 2022:| Warren: | $65,374 |
| Connecticut: | $50,964 |
Change in median non-family income between 2000 and 2022:| Warren, Connecticut: | +71.5% |
| State: | +65.1% |
Median per capita income in Warren in 2022:| Warren: | $67,320 |
| State: | $51,581 |
Change in median per capita income between 2000 and 2022:| Warren, Connecticut: | +82.9% |
| State: | +79.3% |
Income statistics for White residents
Median household income in Warren, CT in 2022:| Warren: | $107,103 |
| Connecticut: | $96,890 |
Change in median household income between 2000 and 2022:| Warren, Connecticut: | +69.4% |
| State: | +68.5% |
Number of households with income < $10k:| Warren: | 4.2% (23,426) |
| State: | 4.2% (42,265) |
Number of households with income $10k - 20k:| Warren: | 4.9% (26,933) |
| State: | 4.8% (48,323) |
Number of households with income $20k - 30k:| Warren: | 5.8% (32,030) |
| State: | 5.7% (57,716) |
Number of households with income $30k - 40k:| Warren: | 5.4% (29,648) |
| State: | 5.3% (53,827) |
Number of households with income $40k - 50k:| Warren: | 5.3% (29,525) |
| State: | 5.3% (53,301) |
Number of households with income $50k - 60k:| Warren: | 5.6% (30,727) |
| Connecticut: | 5.5% (55,690) |
Number of households with income $60k - 75k:| Warren: | 7.9% (43,911) |
| State: | 8.0% (80,329) |
Number of households with income $75k - 100k:| Warren: | 12.7% (70,362) |
| Connecticut: | 12.7% (128,070) |
Number of households with income $100k - 125k:| Warren: | 10.0% (55,251) |
| State: | 10.0% (101,210) |
Number of households with income $125k - 150k:| Warren: | 8.0% (44,357) |
| State: | 8.0% (81,250) |
Number of households with income $150k - 200k:| Warren: | 11.8% (65,223) |
| State: | 11.8% (119,527) |
Number of households with income > $200k:| Warren: | 18.4% (102,103) |
| State: | 18.6% (187,875) |
Aggregate household income in Warren in 2022: $1,495,061,532
Median family income in Warren in 2022:| Warren: | $122,952 |
| State: | $128,955 |
Number of families with income < $10k:| Warren: | 2.1% (7) |
| Connecticut: | 1.9% (11,537) |
Number of families with income $10k - 20k:| Warren: | 2.2% (7) |
| Connecticut: | 1.8% (11,289) |
Number of families with income $20k - 30k:| Warren: | 1.8% (6) |
| State: | 3.0% (18,506) |
Number of families with income $30k - 40k:| Warren: | 3.2% (10) |
| Connecticut: | 2.9% (18,160) |
Number of families with income $40k - 50k:| Warren: | 2.9% (9) |
| Connecticut: | 3.9% (24,550) |
Number of families with income $50k - 60k:| Warren: | 4.6% (14) |
| Connecticut: | 4.3% (26,723) |
Number of families with income $60k - 75k:| Warren: | 12.3% (38) |
| State: | 7.1% (44,075) |
Number of families with income $75k - 100k:| Warren: | 11.8% (37) |
| Connecticut: | 12.5% (77,679) |
Number of families with income $100k - 125k:| Warren: | 11.6% (36) |
| State: | 11.1% (69,086) |
Number of families with income $125k - 150k:| Warren: | 4.3% (13) |
| State: | 9.6% (59,616) |
Number of families with income $150k - 200k:| Warren: | 13.3% (41) |
| Connecticut: | 15.7% (97,890) |
Number of families with income > $200k:| Warren: | 29.9% (93) |
| Connecticut: | 26.3% (163,417) |
Median non-family income in Warren in 2022:| Warren: | $67,299 |
| State: | $54,067 |
Change in median non-family income between 2000 and 2022:| Warren, Connecticut: | +73.7% |
| Connecticut: | +68.7% |
Median per capita income in Warren in 2022:| Warren: | $71,344 |
| State: | $59,916 |
Change in median per capita income between 2000 and 2022:| Warren, Connecticut: | +92.1% |
| State: | +90.2% |
Income statistics for Black or African American residents
Number of households with income < $10k:| Warren: | 6.8% (26,516) |
| State: | 6.8% (9,494) |
Number of households with income $10k - 20k:| Warren: | 7.9% (30,730) |
| State: | 7.9% (11,003) |
Number of households with income $20k - 30k:| Warren: | 10.8% (42,019) |
| State: | 10.8% (15,045) |
Number of households with income $30k - 40k:| Warren: | 8.2% (32,122) |
| State: | 8.2% (11,501) |
Number of households with income $40k - 50k:| Warren: | 7.4% (29,091) |
| Connecticut: | 7.4% (10,416) |
Number of households with income $50k - 60k:| Warren: | 7.5% (29,421) |
| State: | 7.5% (10,534) |
Number of households with income $60k - 75k:| Warren: | 8.0% (31,404) |
| Connecticut: | 8.0% (11,244) |
Number of households with income $75k - 100k:| Warren: | 9.6% (37,341) |
| Connecticut: | 9.6% (13,370) |
Number of households with income $100k - 125k:| Warren: | 10.2% (39,782) |
| Connecticut: | 10.2% (14,244) |
Number of households with income $125k - 150k:| Warren: | 8.0% (31,409) |
| Connecticut: | 8.0% (11,246) |
Number of households with income $150k - 200k:| Warren: | 7.7% (29,960) |
| Connecticut: | 7.7% (10,727) |
Number of households with income > $200k:| Warren: | 7.9% (30,962) |
| Connecticut: | 7.9% (11,086) |
Median per capita income in Warren in 2022:| Warren: | $100,281 |
| State: | $36,289 |
Change in median per capita income between 2000 and 2022:| Warren, Connecticut: | +115.2% |
| Connecticut: | +117.5% |
Income statistics for Asian residents
Median household income in Warren, CT in 2022:| Warren: | $116,424 |
| State: | $110,568 |
Change in median household income between 2000 and 2022:| Warren, Connecticut: | +110.1% |
| State: | +79.5% |
Number of households with income < $10k:| Warren: | 7.1% (3,820) |
| State: | 7.1% (4,245) |
Number of households with income $10k - 20k:| Warren: | 3.5% (1,878) |
| Connecticut: | 3.5% (2,087) |
Number of households with income $20k - 30k:| Warren: | 4.1% (2,217) |
| Connecticut: | 4.1% (2,464) |
Number of households with income $30k - 40k:| Warren: | 4.1% (2,229) |
| State: | 4.1% (2,478) |
Number of households with income $40k - 50k:| Warren: | 3.3% (1,784) |
| State: | 3.3% (1,983) |
Number of households with income $50k - 60k:| Warren: | 3.9% (2,095) |
| Connecticut: | 3.9% (2,328) |
Number of households with income $60k - 75k:| Warren: | 7.0% (3,804) |
| Connecticut: | 7.0% (4,228) |
Number of households with income $75k - 100k:| Warren: | 11.5% (6,219) |
| State: | 11.5% (6,911) |
Number of households with income $100k - 125k:| Warren: | 10.2% (5,513) |
| State: | 10.2% (6,127) |
Number of households with income $125k - 150k:| Warren: | 8.5% (4,570) |
| State: | 8.5% (5,079) |
Number of households with income $150k - 200k:| Warren: | 12.4% (6,689) |
| Connecticut: | 12.4% (7,434) |
Number of households with income > $200k:| Warren: | 24.4% (13,192) |
| State: | 24.4% (14,661) |
Aggregate household income in Warren in 2022: $1,218,380
Median family income in Warren in 2022:| Warren: | $116,894 |
| Connecticut: | $134,548 |
Median non-family income in Warren in 2022:| Warren: | $90,113 |
| State: | $63,785 |
Change in median non-family income between 2000 and 2022:| Warren, Connecticut: | +148.6% |
| State: | +77.9% |
Median per capita income in Warren in 2022:| Warren: | $49,302 |
| State: | $55,295 |
Change in median per capita income between 2000 and 2022:| Warren, Connecticut: | +103.6% |
| State: | +97.8% |
Income statistics for American Indian and Alaska Native residents
Median household income in Warren, CT in 2022:| Warren: | $26,805 |
| State: | $41,848 |
Change in median household income between 2000 and 2022:| Warren, Connecticut: | +12.9% |
| State: | +12.9% |
Number of households with income < $10k:| Warren: | 8.4% (67,534) |
| Connecticut: | 10.2% (340) |
Number of households with income $10k - 20k:| Warren: | 9.4% (75,367) |
| Connecticut: | 8.5% (283) |
Number of households with income $20k - 30k:| Warren: | 8.5% (68,170) |
| State: | 9.4% (314) |
Number of households with income $30k - 40k:| Warren: | 9.1% (73,036) |
| State: | 10.1% (337) |
Number of households with income $40k - 50k:| Warren: | 8.3% (66,993) |
| State: | 13.4% (447) |
Number of households with income $50k - 60k:| Warren: | 7.8% (63,169) |
| State: | 3.1% (104) |
Number of households with income $60k - 75k:| Warren: | 9.8% (78,738) |
| Connecticut: | 5.6% (188) |
Number of households with income $75k - 100k:| Warren: | 12.6% (101,638) |
| Connecticut: | 13.4% (447) |
Number of households with income $100k - 125k:| Warren: | 9.4% (76,005) |
| Connecticut: | 9.5% (317) |
Number of households with income $125k - 150k:| Warren: | 5.6% (45,504) |
| Connecticut: | 3.9% (131) |
Number of households with income $150k - 200k:| Warren: | 6.0% (47,970) |
| Connecticut: | 6.3% (212) |
Number of households with income > $200k:| Warren: | 5.2% (41,520) |
| State: | 6.8% (228) |
Aggregate household income in Warren in 2022: $60,904
Median family income in Warren in 2022:| Warren: | $32,453 |
| State: | $57,217 |
Median per capita income in Warren in 2022:| Warren: | $10,461 |
| Connecticut: | $25,355 |
Change in median per capita income between 2000 and 2022:| Warren, Connecticut: | +45.9% |
| State: | +39.4% |
Income statistics for Multirace residents
Number of households with income < $10k:| Warren: | 6.0% (13,702) |
| State: | 6.0% (7,457) |
Number of households with income $10k - 20k:| Warren: | 8.1% (18,630) |
| Connecticut: | 8.1% (10,139) |
Number of households with income $20k - 30k:| Warren: | 7.0% (15,989) |
| Connecticut: | 7.0% (8,702) |
Number of households with income $30k - 40k:| Warren: | 6.9% (15,702) |
| State: | 6.9% (8,546) |
Number of households with income $40k - 50k:| Warren: | 7.0% (16,007) |
| Connecticut: | 7.0% (8,712) |
Number of households with income $50k - 60k:| Warren: | 5.9% (13,470) |
| Connecticut: | 5.9% (7,331) |
Number of households with income $60k - 75k:| Warren: | 8.5% (19,539) |
| Connecticut: | 8.5% (10,634) |
Number of households with income $75k - 100k:| Warren: | 14.1% (32,338) |
| State: | 14.1% (17,600) |
Number of households with income $100k - 125k:| Warren: | 9.9% (22,753) |
| Connecticut: | 9.9% (12,383) |
Number of households with income $125k - 150k:| Warren: | 7.2% (16,392) |
| Connecticut: | 7.2% (8,921) |
Number of households with income $150k - 200k:| Warren: | 8.8% (20,068) |
| State: | 8.8% (10,922) |
Number of households with income > $200k:| Warren: | 10.6% (24,340) |
| State: | 10.6% (13,247) |
Median per capita income in Warren in 2022:| Warren: | $54,226 |
| State: | $32,794 |
Change in median per capita income between 2000 and 2022:| Warren, Connecticut: | +95.5% |
| State: | +117.2% |